Surface-enhanced Raman spectroscopy using a coffee-ring-type three-dimensional silver nanostructure
R. Hara†
,
T. Fukuoka†,
R. Takahashi,
Y. Utsumi and
A. Yamaguchi*
Laboratory of Advanced Science and Technology for Industry, University of Hyogo, 3-1-2 Koto, Kamigori, Hyogo 678-1205, Japan. E-mail: yamaguti@lasti.u-hyogo.ac.jp
First published on 27th November 2014
Abstract
We demonstrated surface-enhanced Raman spectroscopy using a coffee-ring-type three-dimensional silver nanostructure (Ag3D). Ag3D has high activity for surface-enhanced Raman scattering (SERS). We fabricated Ag3D using convective self-assembly to form a ‘coffee-ring’ structure that consisted of a mixed solution of silver particles and polystyrene latex beads. The mechanism of the formation of Ag3D is described by the competition among a radial flow, a Marangoni recirculating flow, DVLO interactions and sedimentation. Using Ag3D, measurements of a trace amount of 4,4′-bipyridine (4bpy) in aqueous solution were performed, and typical spectra of 4bpy were observed within 1 min of dropping 4bpy. By optimizing the Ag3D preparation conditions, we could observe the characteristic enhanced Raman spectrum of 1 nM 4bpy solution. In addition, we succeeded in observing chloride activation, which increased the intensity of the Raman spectra by a factor of two to three on addition of sodium chloride to Ag3D. SERS measurements using Ag3D were stable even with passing time, whereas the peak intensity drastically dropped within a few minutes in the case with silver nanoparticles only.
I. Introduction
Recently, the development of microfluidic devices for various applications, including point-of-care medical diagnostics and environmental and food analyses, has been actively pursued.1–3 An easily operable analytical method for detecting and identifying small amounts of analyte in microfluidic devices is required. Fluorescence method and absorption spectrometry, which are commonly used to analyze chemical species—including small organic molecules, inorganic ions, proteins and even whole organisms such as bacteria and viruses—are not suitable to meet this requirement; this is because these analytical techniques do not provide a sufficient optical path length in the microchannel. Therefore, a novel detection technique is needed to replace the conventional methods.Surface-enhanced Raman scattering (SERS) has been attracting attention as a highly sensitive analysis technique;4–8 it uses Raman spectroscopy and localized surface plasmon resonance (LSPR). A noble metal nanostructure using gold or silver is essential to achieve strong LSPR. Gold nanoparticles (NPs) have often been used to fabricate these nanostructures, because gold NPs do not relatively react with other substances and are easy to use. Therefore, well-established methods for preparing stable colloidal solutions of gold NPs in both polar and nonpolar solvents have been developed. However, because of the higher electrical conductivity of silver, it has a better SERS activity than gold.9–17 Furthermore, silver has a higher reactivity with other substances. Therefore, three-dimensional silver nanostructures, such as porous and nanoshell, are considered suitable for SERS measurements of various compounds.16,17 The Ag nanostructures can be applied in biotechnology, such as in the analysis of proteins. However, fabrication of the Ag nanostructures is difficult because of the high reactivity of the surface of Ag NPs.
In this study, we achieved the fabrication of a novel sterically bulky three-dimensional Ag nanostructure (Ag3D) by optimizing the preparation conditions. We described the mechanism of Ag3D formation considering the competition among four contributions: a radial flow driven by evaporation at the wetting line, a Marangoni recirculating flow driven by surface tension gradients, the transport of particles toward the substrate driven by Derjaguin, Landau, Verwey and Overbeek (DVLO) interactions and sedimentation (gravitation) force. We succeeded in observing chloride activation, which was aided with the two- to three-fold increase in the intensity of the Raman spectrum on addition of NaCl solution to Ag3D. Our experimental observation could be explained by the re-crystallization induced by the oxidative etching process.
II. Results and discussion
A. Method and procedure to fabricate a coffee-ring-type Ag3D structure
Ag3D was prepared using convective self-assembly,18–22 namely the coffee-ring effect. Sulfate polystyrene latex beads (PS) of diameter 600 nm (Invitrogen Inc., 8% w/v) were concentrated by centrifugation and washed to yield a 10% w/v suspension. Aqueous suspensions of Ag colloidal nanoparticles (AgNPs) of diameter 40 nm were synthesized using a standard citrate reduction protocol, Lee-Meisel method.23A dispersion of AgNPs was prepared at 1.00 mM and concentrated 100-fold by centrifuging at 6600 rpm for 60 min. The concentrations of PS and AgNP were estimated as 8.4 × 10¹⁴ particles per L and 3.07 × 10¹⁶ particles per L, respectively. AgNPs (27 μl) were mixed with PS (1 μl) to prepare a mixed solution of ratio 1000![[thin space (1/6-em)]](https://www.rsc.org/images/entities/char_2009.gif) :
:![[thin space (1/6-em)]](https://www.rsc.org/images/entities/char_2009.gif) 1 (AgNP–PS).19–21
1 (AgNP–PS).19–21
A silicone sheet with ϕ 6 mm through hole was put onto an Ag3D-coated ultraviolet-cleaned glass slide (Matsunami Glass Ind., Ltd), and a well (28 μl volume) was made. 5 μl of the mixed solution of AgNPs and PS was dropped into the well and dried at 75% relative humidity for about a day. A PS colloidal crystal was fabricated by convective self-assembly, where AgNPs were simultaneously accumulated in the PS gaps, as shown in Fig. 1(a).19–21 The structure was then soaked in dichloromethane to remove the PS. Thus, Ag3D was successfully obtained as shown in Fig. 1(b).
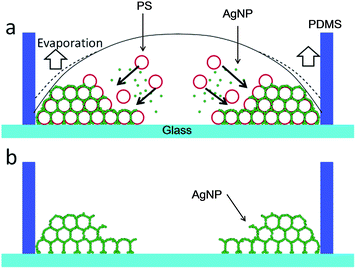 | ||
| Fig. 1 (a) Fabrication of Ag3D using convective self-assembly. (b) Schematic of cross-section of Ag3D after drying and soaking in dichloromethane. | ||
B. Appearance of Ag3D
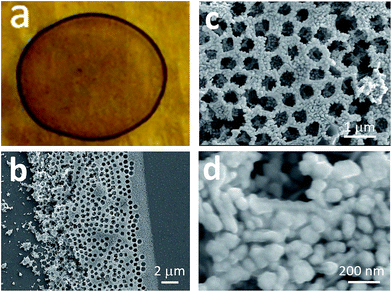
Fig. 2(a) shows the optical micrograph of the prepared Ag3D structure. We confirmed that the fabricated outward form was similar to the coffee-ring structure. Fig. 2(b) shows a scanning electron microscope (SEM) image of the circumferential location of the coffee-ring. The Ag3D structure width was ∼20 μm in the radial direction. As shown in Fig. 2(b), there are many pores along the wall of the coffee-ring. A magnified SEM image revealed the existence of a unique honeycomb-like structure in Ag3D, which was fabricated at the edge of the coffee-ring, as shown in Fig. 2(c). The relatively periodically-patterned porous layers pile up high. The frames are consisting of the silver nanoparticles and sustaining the pores after removing the PS particles as shown in Fig. 2(d). The high-resolution SEM image shown in Fig. 2(d) reveals that the AgNPs are not monodisperse and the size dispersion is expected to in the range from about 30 to 100 nm. Although the diameter of the PS was 600 nm, the average diameter of the pores observed in the uppermost layer—made by removing the PS particles—was 499 ± 70 nm (average and standard deviation were evaluated from 117 pores). This is attributable to shrinking of the porous structure in order to maintain the overall stability of the Ag3D structure.18–21 As a result, there are a lot of nano-scale gaps between AgNPs in the Ag3D structure. The nano-scale gaps within higher order nano-scale architecture of the Ag3D could offer the SERS-active hot spots. The higher order architecture is in good agreement with the cartoon illustrated in Fig. 1(b). The laser for Raman spectroscopy could be focused easily because of the sufficient width and sterically bulky of the Ag3D.The Ag3D structure is basically fabricated by self-assembly from evaporating droplets.19–22 According to Bhardwaj et al.,22 the self-assembly of colloidal particles is built by the competition among three flow patterns: a radial flow driven by evaporation at the wetting line, a Marangoni recirculating flow driven by surface tension gradients, and the transport of particles toward the substrate driven by DVLO interactions. To describe how the Ag3D deposit results from the competition, we have to conduct experiments and simulations considering various parameters. In this study, we represent the essence of Ag3D building mechanism. First, the Marangoni recirculating flow provides the accumulation with a diameter smaller than the initial wetted diameter of the drop as shown in Fig. 1(a). Second, the radial flow, which is induced by the maximum evaporation rate at the pinned wetting line, contributes colloidal particles to roll up and collect them toward the coffee-ring region as described in ref. 22. Here, the circular PDMS wall forces a drop to form the circular boundary along the wall. The wall spontaneously enables us to control the radial and Marangoni flows to accumulate the particles toward the circular edge near the PDMS wall under the suitable conditions. Next, we focus on the DVLO interactions between particles and between particle and substrate to form the Ag3D.
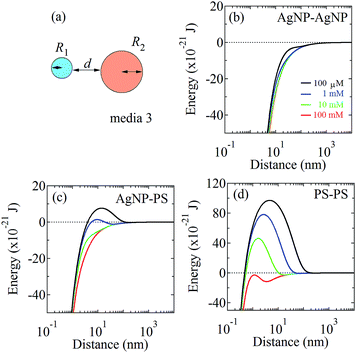
To obtain the understanding of mechanism fabricating Ag3D consisting of hetero two spheres, we evaluated the coagulation potential of AgNP–AgNP, AgNP–PS, PS–PS, AgNP–glass substrate and PS–glass substrate using DVLO theory.24–28 To simplify our experimental system, we assume that the hetero two spheres have the spherical radii R1 and R2, and stay aloof at a distance d between two particles as shown in Fig. 3(a). Then, the interaction free energy between two hetero spheres (Particle 1 and Particle 2) is given by24–26
 | (1) |
 | (2) |
| Interacting media | Hamaker constant A132 (10−20 J) | ||
|---|---|---|---|
| 1 | 3 | 2 | |
| Ag | Water | Ag | 16.8 |
| Ag | Vacuum | Ag | 38.2 |
| Polystyrene | Water | Polystyrene | 0.228 |
| Ag | Water | Polystyrene | 1.96 |
| Ag | Water | Silica (SiO2) | 1.90 |
| Polystyrene | Water | Silica | 0.22 |
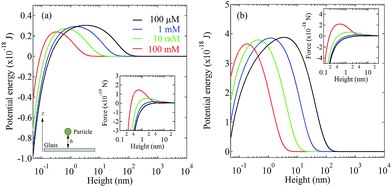
In addition, to obtain the deeper understanding the mechanism of Ag3D formation, we confirm the Ag3D deposition process onto the substrate. Here, under the assumption that a particle with a spherical radius R stays aloof at a height h between the particle and glass substrate as illustrated in the inset of Fig. 4(a), the interaction free energy between the particle and substrate is given by24–28
 | (3) |
 | (4) |
C. SERS measurements
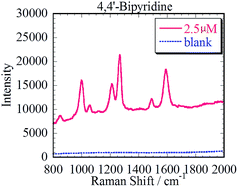
We demonstrated in situ SERS measurement of 4,4′-bipyridine (4bpy) as the Raman active molecule using the prepared Ag3D. The silicone sheet with ϕ 6 mm through hole was put onto the Ag3D on the glass to enable good measurement. 35 μl of 4bpy aqueous solution was dropped into the well on the Ag3D. A cover glass was used to prevent the 4bpy solution from drying and to maintain its concentration. The Ag3D was placed in the Raman spectrometer (RAM-100S, Lambda Vision Inc.), and a 1 s irradiation of wavelength 785 nm (laser power, 50 mW) laser focused on the Ag3D.As shown in Fig. 5, we observed the characteristic enhanced Raman spectrum of 4bpy (1000 cm−1, 1250 cm−1, 1580 cm−1) within 1 min of dropping 4bpy. The SERS spectrum was observed only in the part of Ag3D; no spectrum was observed in the part without Ag3D. The blue and red solid lines in Fig. 5 represent the SERS spectra of 1 and 100 nM of 4bpy, respectively. Considering that the resolution of the spectroscope was approximately 7 cm−1 and that the limit of sensitivity was <10 mM without SERS-active structure, the spectra are in good agreement with literature data.31 The dotted line in Fig. 5 corresponds to the blank (ultrapure water). By comparing the Raman spectrum of the Ag3D with that of the blank, the SERS enhancement factor (EF) was estimated to ∼105 times;32 although this EF is lower than those reported in previous studies,7–21 it is considered adequately sensitive for the detection of small amounts of analyte. The SERS spectrum of 100 nM 4bpy was detected within 1 min. Although the peak of 1 nM 4bpy solution was weak, it was also detectable and distinguished within 1 min. Thus, we achieved high-sensitivity SERS measurements using the Ag3D. We found that Ag3D enabled us to provide higher sensitivity than other SERS substrates used in our previous study.21 This is attributed to Ag3D being so sterically bulky that it can trap many molecules.19,20 We have thus shown that the Ag3D performs well in SERS sensing.
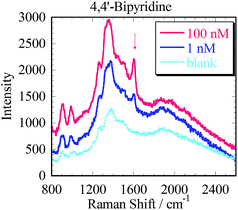 | ||
| Fig. 5 Characteristic enhanced Raman spectra of 4,4′-bipyridine at concentration of 100 nM, 1 nM and a blank (ultrapure water with the Ag3D and no analyte). | ||
D. Chloride activation
To enhance the SERS spectra obtained using the Ag3D, chloride activation,11,12 which enhanced the Raman intensity of 4bpy by a factor of two to three, was performed as follows. After 35 μl of 4bpy aqueous solution was dropped into a well on the Ag3D, 2 μl of NaCl (50 mM) was added to the Ag3D. SERS spectra of 100 μM 4bpy aqueous solution were easily observed by adding an aqueous solution of sodium chloride. Characteristic enhanced Raman peaks attributed to 4bpy (located at 1000, 1250 and 1580 cm−1) were observed. Fig. 6 shows the SERS spectra of 4bpy before and after chloride activation. The blue and brown solid lines correspond to the SERS spectra of 100 μM 4bpy before and after chloride activation, respectively. The black dotted line represents the SERS spectrum of the blank. As evident from Fig. 6, chloride activation enabled us to increase the intensity of the SERS spectra.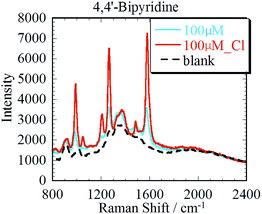 | ||
| Fig. 6 SERS spectra of 4bpy with and without the aqueous solution of sodium chloride. The concentration of 4bpy is 100 μM. | ||
Here, although the chloride activation in colloidal systems was a popular phenomenon, the mechanism had not been understood until the investigations by Prucek et al.33,34 In colloidal state, Prucek et al. revealed that re-crystallization of AgNPs in a highly concentrated NaCl environment provided a considerable enhancement of the SERS signals of adenine by shift of LSPR due to the crystal growth.33,34 Our Ag3D was fixed on the glass substrate under arid conditions, not in colloidal state. Then, the addition of AgCl was expected to be generated on the surface of Ag3D, and the oxidized Ag was considered to be peeled off from the Ag surface keeping the size. As a result, pure silver appeared on the surface of the Ag3D. The Ag3D with a fresh silver surface was expected to enhance SERS spectra. The presence of AgCl was not confirmed in this study, however, the previous experiments X-ray photoemission spectroscopy (XPS) measurements suggested that much smaller quantity of halide and other anions absorbed on an AuNP compared with an AgNP.35,36 This is expected to be the reason why the fresh silver surface is considered to be appeared on the surface of the AgNPs by the chloride activation and enhances the SERS signal. To confirm this hypothesis which fresh silver surface plays important role on the enhancement of the SERS signals, we compared the SEM images of Ag3D before and after adding the NaCl solution as shown in Fig. 7(a) and (b), respectively. As a result, we found that Ag crystal growth occurred. This result indicates that the re-crystallization was also induced in the Ag3D. This re-crystallization is attributable to the oxidative etching process investigated by Wiley et al.37 According to Wiley et al.,37 the defects inherent in twinned nuclei of silver led to their selective etching and dissolution by chloride and oxygen from air, leaving the single-crystals to grow. Therefore, by the same token in the experimental results by Prucek et al.,33,34 the addition of the concentrated solution of chloride ions induced a rapid-crystallization process towards larger silver crystals providing an enhancement of SERS signals with excitation in 785 nm wavelength region in our experiment. The time dependent UV-visible absorption spectra measurement will provide the clue to get deep understanding the chloride activation in the Ag3D system as shown in the previous study.33,34,38
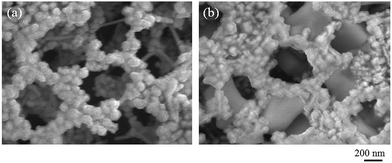 | ||
| Fig. 7 Highly magnified SEM images of Ag3D (a) before and (b) after adding the aqueous solution of sodium chloride, respectively. | ||
The SERS activity of silver is generally higher than that of gold in the colloidal system, because silver has higher electrical conductivity than gold. The measured SERS spectrum using Ag3D was relatively weak compared with the case using Au3D,19–21 indicating that there is a possibility of obtaining a stronger SERS effect using Ag3D than Au3D if the conditions of chloride activation are optimized, i.e. the amount of the aqueous solution of NaCl added to the Ag3D versus the concentration of the aqueous solution of NaCl, and selection of suitable excitation laser wavelength.
E. SERS measurements in the colloidal system
We evaluate the stability of SERS spectrum measurement using Ag3D. For comparison, SERS measurements in the colloidal system were also demonstrated to evaluate SERS sensitivity. 54 μl of mixed solution of colloidal silver used to fabricate the Ag3D and 4bpy was added to an aluminum cup. 3 μl of aqueous solution of NaCl was added as flocculant to the cup. The collection time for each SERS measurement was 1 s (on average 10 times at 0.1 second) using 785 nm laser (50 mW). By comparing the SERS intensity using Ag3D with that using Ag colloid aggregation, we appraised the stability of the highly sensitive detection technique.SERS spectra with Ag colloid aggregation and with Ag3D are shown in Fig. 8 and 9, respectively. By comparing these spectra, we found that SERS intensity with Ag colloid aggregation was higher than that with Ag3D; one reason for this result is that Ag colloid was mixed with 4bpy before aggregation, and 4bpy was easily adsorbed into the gap of the Ag particles.
Next, to clarify the free performance of Ag3D, elapsed time dependence of the peak height of 1580 cm−1 of 4bpy in both cases were measured. Fig. 10 shows the peak height of 1580 cm−1 as a function of time. As evident, the SERS measurement using Ag3D was stable even with passing time, whereas the peak intensity drastically dropped within a few hundreds seconds in the case with Ag colloid. This is attributable to the decrease of ratio of SERS active region within the laser spot by Tyndall settling and the shift of LSPR due to the crystal growth.33,34 Thus, the Ag colloidal system is unstable, although it has the ability to achieve highly sensitive detection of a trace amount of analyte.7–12 In contrast, the Ag3D provides a more stable detection despite its falling short of the sensitivity of the colloidal system. Our results indicate that Ag3D will open the door to an in situ stable SERS measurement platform with Ag.
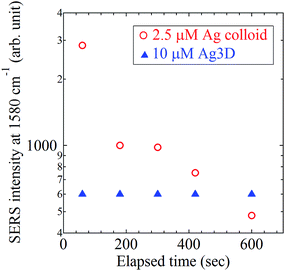 | ||
| Fig. 10 Time dependences of 4bpy peak intensity (at 1580 cm−1) with Ag3D and Ag colloid aggregation. | ||
III. Conclusions
We fabricated a novel sterically bulky three-dimensional silver nanostructure and demonstrated SERS measurements. The essence of Ag3D formation process can be explained by the competition among four contributions: a radial flow, a Marangoni recirculating flow, the transport of particles toward the substrate driven by DVLO interactions and sedimentation force. The Ag3D easily enabled detection of 1 nM 4bpy through the SERS spectrum. The observed Raman spectra in the Ag3D were enhanced about 105 times compared with the case without Ag3D. Thus, highly sensitive SERS measurements was achieved using Ag3D. Using chloride activation, the possibility of further development for SERS measurements using Ag3D was demonstrated. We found that the enhancement of SERS spectra could also be induced by the LSPR shift due to the re-crystallization of Ag within the Ag3D. Finally, we proved by SERS measurements that Ag3D is advantageous as it is stable with the passage of time.Acknowledgements
We are grateful to Dr Yamaguchi, Dr Takigawa and Dr Saiki in Hyogo prefectural Institute of Technology for SEM and EDX measurement support. This work is partly supported by MEXT Grants-in-Aid for Scientific Research in a Priority Area and a JSPS Grants-in-Aid for Scientific Research.References
- D. Mark, S. Haeberle, G. Roth, F. von Stetten and R. Zengerle, Chem. Soc. Rev., 2010, 39, 1153 RSC.
- P. Yager, T. Edwards, E. Fu, K. Helton, K. Nelson, M. R. Tam and B. H. Weigl, Nature, 2006, 442, 412 CrossRef CAS PubMed.
- M. Miro and E. H. Hansen, Anal. Chim. Acta, 2007, 600, 46 CrossRef CAS PubMed.
- C. L. Haynes, A. D. McFarland and R. P. Van Duyne, Anal. Chem., 2005, 77, 338A CrossRef CAS.
- M. G. Albrecht and J. A. Creighton, J. Am. Chem. Soc., 1977, 99, 5215 CrossRef CAS.
- D. L. Jeanmaire and R. P. Van Duyne, J. Electroanal. Chem., 1977, 84, 1 CrossRef CAS.
- F. Ni, R. Sheng and T. M. Cotton, Anal. Chem., 1990, 62, 1958 CrossRef CAS PubMed.
- S. M. Nie and S. R. Emory, Science, 1997, 275, 1102 CrossRef CAS PubMed.
- K. Kneipp, Y. Wang, H. Kneipp, L. T. Perelman, I. Itzkan, R. Dasari and M. S. Feld, Phys. Rev. Lett., 1997, 78, 1667 CrossRef CAS.
- P. Hildebrandt and M. Stockburger, J. Phys. Chem., 1984, 88, 5935 CrossRef CAS.
- W. E. Doering and S. Nie, J. Phys. Chem. B, 2002, 106, 311 CrossRef CAS.
- S. Habuchi, M. Cotlet, R. Gronheid, G. Dirix, J. Michiels, J. Vanderleyden, F. C. De Schryver and J. Hofkens, J. Am. Chem. Soc., 2003, 125, 8446 CrossRef CAS PubMed.
- S. L. Kleinman, E. Ringe, N. Valley, K. L. Wustholz, E. Phillips, K. A. Scheidt, G. C. Schatz and R. P. Van Duyne, J. Am. Chem. Soc., 2011, 133, 4115 CrossRef CAS PubMed.
- M. P. Cecchini, V. A. Turek, J. Paget, A. A. Kornyshev and J. B. Edel, Nat. Mater., 2013, 12, 165 CrossRef CAS PubMed.
- L. Su, W. Jia, D. P. Manuzzi, L. Zhang, X. Li, Z. Gu and Y. Lei, RSC Adv., 2012, 2, 1439 RSC.
- S. Akil-Jradi, S. Jradi, J. Plain, P. M. Adam, J. L. Bijeon, P. Royer and R. Bachelot, RSC Adv., 2012, 2, 7837 RSC.
- J. B. Jackson, S. L. Westcott, L. R. Hirsh, J. L. West and N. J. Halas, Appl. Phys. Lett., 2003, 82, 257 CrossRef CAS.
- D. M. Kuncicky, B. G. Prevo and O. D. Velve, J. Mater. Chem., 2006, 16, 1207 RSC.
- Y. Mori, N. Shinohara, and T. Fukuoka, in International Workshop on Nanomechanical Cantilever Sensors 2008, Mainz, Germany, 19 May 2008 Search PubMed.
- R. Takahashi, T. Fukuoka, Y. Utsumi and A. Yamaguchi, Jpn. J. Appl. Phys., 2013, 52, 06GK12 CrossRef.
- T. Fukuoka, D. Fukuoka, Y. Mori and Y. Utsumi, IEEJ Trans. EIS., 2010, 130, 1806 CrossRef; T. Fukuoka et al., to be published.
- R. Bhardwaj, X. Fang, P. Somasundaran and D. Attinger, Langmuir, 2010, 26, 7833 CrossRef CAS PubMed.
- P. C. Lee and D. Meisel, J. Phys. Chem., 1982, 86, 3391 CrossRef CAS.
- R. Hogg, T. W. Healy and D. W. Fuerstenau, Trans. Faraday Soc., 1966, 62, 1638 RSC.
- J. N. Israelachvili, Intermolecular and Surface Forces, Academic Press, London, 3rd edn, 2011 Search PubMed.
- C. V. Chrysikopoulos and V. I. Syngouna, Colloids Surf., B, 2012, 92, 74 CrossRef CAS PubMed.
- S. Bhattacharjee, M. Elimelech and M. Borkovec, Croat. Chem. Acta, 1998, 71, 883 CAS.
- H.-J. Butt, K. Graf and M. Kappl, Physics and Chemistry of Interfaces, Wiley-VCH GmbH & Co. KGaA, 2003 Search PubMed.
- A. Sze, D. Erickson, L. Ren and D. Li, J. Colloid Interface Sci., 2003, 261, 402 CrossRef CAS PubMed.
- L. D. Landau and E. M. Lifshitz, Fluid Mechanics, Pergamon, London, 3rd edn, 1966 Search PubMed.
- S. W. Joo, Vib. Spectrosc., 2004, 34, 269 CrossRef CAS.
- Here, the SERS enhancement factor (EF) can be defined as
 where ISERS(INR) is the intensity of the surface-enhanced Raman signal (from the normal Raman signal as the same wavelength on a nonenhanced substrate) and NSERS(NNR) is the number of molecules contributing to ISERS, respectively, in accordance with M. Suzuki, Y. Niidome and S. Yamada, Thin Solid Films, 2006, 496, 740. Following to our previous study in ref. 20, the EF was estimated.
 - R. Prucek, A. Panáček, A. Fargašová, V. Ranc, V. Mašek, L. Kvítek and R. Zbořil, CrystEngComm, 2011, 13, 2242 RSC.
- R. Prucek, A. Panáček, J. Soukupová, R. Novotny and L. Kvítek, J. Mater. Chem., 2011, 21, 6416 RSC.
- M. Futamata and Y. Maruyama, Appl. Phys. B: Lasers Opt., 2008, 93, 117 CrossRef CAS; T. Yajima, Y. Yu and M. Futamata, Phys. Chem. Chem. Phys., 2011, 13, 12454 RSC.
- A. Zhang and Y. Fang, Chem. Phys. Lett., 2006, 429, 518 CrossRef CAS.
- B. Wiley, T. Herricks, Y. Sun and Y. Xia, Nano Lett., 2004, 4, 1733 CrossRef CAS.
- L. Kvítek, A. Panáček, J. Soukupová, M. Kolář, R. Večeřová, R. Prucek, M. Holecová and R. Zbořil, J. Phys. Chem. C, 2008, 112, 5825 Search PubMed.
Footnote |
| † These authors contributed equally to this work. |
| This journal is © The Royal Society of Chemistry 2015 |

