
A comprehensive investigation of Sr segregation effects on the high-temperature oxygen evolution reaction rate†
Weicheng
Feng‡
ab,
Geng
Zou‡
ab,
Tianfu
Liu‡
ab,
Rongtan
Li‡
 ab,
Jingcheng
Yu
ab,
Yige
Guo
ab,
Qingxue
Liu
ab,
Xiaomin
Zhang
a,
Junhu
Wang
ac,
Na
Ta
a,
Mingrun
Li
a,
Peng
Zhang
d,
Xingzhong
Cao
d,
Runsheng
Yu
d,
Yuefeng
Song
*ae,
Meilin
Liu
*e,
Guoxiong
Wang
*af and
Xinhe
Bao
a
ab,
Jingcheng
Yu
ab,
Yige
Guo
ab,
Qingxue
Liu
ab,
Xiaomin
Zhang
a,
Junhu
Wang
ac,
Na
Ta
a,
Mingrun
Li
a,
Peng
Zhang
d,
Xingzhong
Cao
d,
Runsheng
Yu
d,
Yuefeng
Song
*ae,
Meilin
Liu
*e,
Guoxiong
Wang
*af and
Xinhe
Bao
a
aState Key Laboratory of Catalysis, Dalian National Laboratory for Clean Energy, iChEM (Collaborative Innovation Center of Chemistry for Energy Materials), Dalian Institute of Chemical Physics, Chinese Academy of Sciences, Dalian, 116023, China. E-mail: wanggx@dicp.ac.cn
bCollege of Energy, University of Chinese Academy of Sciences, Beijing, 100049, China
cCenter for Advanced Mössbauer Spectroscopy, Dalian Institute of Chemical Physics, Chinese Academy of Sciences, Dalian, 116023, Liaoning, China
dMulti-disciplinary Research Division, Institute of High Energy Physics, Chinese Academy of Sciences, Beijing, 100049, P. R. China
eSchool of Materials Science and Engineering, Georgia Institute of Technology, Atlanta, 30332, USA
fDepartment of Chemistry, Shanghai Key Laboratory of Molecular Catalysis and Innovative Materials, iChEM (Collaborative Innovation Center of Chemistry for Energy Materials), Fudan University, Shanghai, 200438, China
First published on 22nd January 2025
Abstract
While the effects of Sr segregation on the performance and stability of perovskite electrodes in solid oxide electrolysis cells (SOECs) have been widely studied, most attention has been focused on surface Sr segregates, with the impact of the resulting Sr deficiencies within the bulk phase of the electrodes largely ignored. Here, we report our findings from an investigation into the impact of Sr deficiencies in the SrCo0.7Fe0.3O3−δ (SCF) lattice and surface Sr segregates on the electrochemical behavior of well-controlled anode materials. Results demonstrate that Sr deficiencies in the perovskite lattice significantly enhance bulk oxygen ion transport, while surface Sr segregates suppress oxygen vacancy formation at interfaces, resulting in a reduced rate of oxygen exchange and lower surface electrical conductivity. Our study provides critical insights into the roles of bulk Sr deficiencies and surface Sr segregates, particularly their effects on oxygen vacancy formation, electrical conductivity, oxygen ion transport, and the overall rate of a high-temperature oxygen evolution reaction.
Broader contextSolid oxide electrolysis cells (SOECs) represent a promising technology to efficiently convert renewable energy into stable chemical energy. However, Sr segregation onto the anode surface is generally considered as a common stability issue for a high-temperature oxygen evolution reaction (OER). Most studies have primarily focused on the influence of surface Sr segregates, while the effect of bulk Sr deficiencies on the elementary processes of electrode reactions has been rarely investigated. Herein, density functional theory calculations combined with various physicochemical characterization studies and electrochemical impedance spectra confirm that the generated bulk Sr deficiencies in the SrCo0.7Fe0.3O3−δ anode during Sr segregation can lift the O 2p band center toward the Fermi level and promote the formation of oxygen vacancies, thus accelerating the bulk oxygen ion transportation and the electron transfer processes in the bulk, while the surface Sr segregates decelerate the oxygen exchange and electron transfer processes. This work provides a comprehensive understanding of the Sr segregation process during a high-temperature OER and is instructive for the knowledge-based design of advanced anode materials with enhanced performance and stability. |
1. Introduction
Solid oxide electrolysis cells (SOECs) demonstrate significant potential for CO2 conversion, high-value chemical synthesis, and peak load shifting of clean energy due to their lower overpotential and higher current density and faradaic efficiency.1–3 However, the stability of SOECs at high current densities is still inadequate to meet the demand for large-scale applications. During CO2 electrolysis, the anodic oxygen evolution reaction (OER) is a four-electron transfer process that consumes the majority of electrical energy, and its sluggish reaction kinetics limits the reaction rate of CO2 conversion.4,5 Therefore, developing anode materials with high OER activity and stability is crucial for improving the overall CO2 electrolysis performance.6,7Perovskite oxides with mixed electron–ion conductivity are commonly used as anode materials due to their high conductivities and oxygen vacancy concentrations, which are essential for high-temperature electrocatalytic reactions.8–11 Numerous studies have confirmed that replacing A-site cations (of an oxidation state +3 or higher) with Sr2+ increases the concentration of oxygen vacancies, thus improving the OER activity.12–16 However, Sr segregation onto the electrode surface is commonly observed under typical SOEC operating conditions (at high temperatures and high oxygen partial pressures) due to cation size mismatch between doped Sr2+ and the host cation along with the electrostatic interactions between the dopant and the surrounding lattice ions.17–20 Recently, Sr segregation and its effect on the performance degradation of perovskite electrodes have been extensively studied.6 Yildiz et al. revealed that the enlarged band gap with Sr segregation on the SrTi1−xFexO3 surface inhibited the electron transfer process from the bulk to surface adsorbed oxygen species and decreased the active oxygen vacancy concentration.18 Rupp et al. observed the spontaneous formation of Sr-rich composite oxides on a LSC thin film at high temperatures and confirmed their adverse effects on oxygen surface exchange kinetics.21
However, contradictory effects of Sr segregation on the electrochemical processes have also been reported. Li et al. discovered that the presence of SrO on the La0.6Sr0.4CoO3−δ surface could prevent intrinsic Sr segregation and improve the electrochemical performance efficiently at 600 °C.22 Additionally, many Sr-containing perovskite anodes also demonstrated good stability during long-term operation.23–26 For example, Barnett et al. achieved a stability of more than 1000 h for the SrTi0.3Fe0.7O3−δ anode at high current density, with only a slight increase in resistance.27 Our previous work demonstrated satisfactory stability of the SrCo0.7Fe0.3O3−δ anode for 487 h,16 with a slight decrease in the SOEC performance accompanied by a significant amount of Sr segregates on the anode surface. In fact, Sr deficiencies are inevitably generated in the bulk lattice of the electrode as Sr segregates to the surface. However, most studies have primarily focused on the influence of surface Sr segregates, while the effect of bulk Sr deficiencies on the elementary processes of electrode reactions has been rarely investigated. As the anodic OER involves not only the surface electron transfer and oxygen ion exchange but also the transport of oxygen ions and electrons through the bulk phase of the electrode,4,28,29 taking into consideration the effects of both surface Sr segregates and bulk Sr deficiencies is of great significance to assess the real effects of Sr segregation on the high-temperature OER performance and stability.
In this study, we carried out various ex situ and in situ physicochemical characterization studies, density functional theory (DFT) calculations, and electrochemical impedance spectroscopy (EIS) analysis to explore the influence of Sr segregation on the OER performance and stability of the SrCo0.7Fe0.3O3−δ (SCF) anode from two aspects: surface Sr segregates and bulk Sr deficiencies. DFT calculation results show that the bulk Sr deficiencies lift the O 2p band center and promote oxygen vacancy formation, which is inhibited by surface Sr segregates. Physicochemical measurements confirm the promoted bulk oxygen ion mobility and electron transfer by the bulk Sr deficiencies and the decelerated surface oxygen exchange and electron transfer processes by surface Sr-enriched oxides. These results reveal the dual-impact mechanism of the Sr segregation process and explain the absence of significant performance degradation during long-term operation in actual electrode systems, which is instructive for the design of stable and efficient anode materials for SOECs.
2. Results and discussion
2.1. Sr segregation
High oxygen partial pressure during anodic polarization is considered as a major triggering factor for the Sr segregation of perovskites.30,31 Herein, the SCF electrode is treated in pure oxygen at 800 °C (SCF-O2) to mimick the working environment of the SOEC anode, and the surface change is detected by scanning electron microscopy (SEM), energy dispersive X-ray spectroscopy (EDS) elemental maps and X-ray photoelectron spectroscopy (XPS) spectra. After O2 treatment, segregated oxide particles of 300–500 nm in size are observed on the SCF anode surface (Fig. S1a and b, ESI†), with morphology and size similar to those on the anode after a stability test of 487 h in our previous work.16 EDS elemental maps in Fig. S1c and d (ESI†) confirm that the main component of the surface segregates is Sr with a slight amount of Co. Meanwhile, the surface Sr segregate in the oxygen-treated SCF electrode is observed on the boundaries of SCF particles throughout the anode, including the electrode surface, the electrode/current collector interface, and the electrode/electrolyte interface (Fig. S2, ESI†). XPS spectra in Fig. 1a and b and Table S1 (ESI†) reveal that the proportion of the surface Sr species to the total Sr species (Srsur./Sr) on SCF increases from 39.99% to 60.60% after O2 treatment at 800 °C, indicative of the surface segregation of Sr species. Based on the results above, O2 treatment could indeed induce the Sr segregation on the anode surface just like anodic polarization. However, unlike electrochemical polarization, which inevitably causes simultaneous changes in the cathode and anode, O2 treatment allows us to focus on the change in the anode exclusively. Therefore, in this work, we apply O2 treatment to actuate the Sr segregation on the anode surface and explore its effect on SOEC performance and stability. Along with the surface segregation of Sr species, Sr deficiencies are naturally generated in the SCF bulk lattice, which is confirmed by the positron annihilation lifetime spectrum in Fig. 1c. Typically, the source-corrected lifetime spectra are divided into three components (C1–C3) according to different lifetime intervals, which are labeled with lifetimes (τ1–τ3) and relative intensities (I1–I3). Among them, τ1–τ3 represent the positron annihilation lifetime in perfect crystals without deficiency, metal ion deficiencies, and micropores or mesopores in the samples, respectively.32 Clearly, the resolved results in Fig. 1d and Table S2 (ESI†) show that τ2 in SCF-O2 (207.1 ps) is longer than that in SCF (199.5 ps). Therefore, two different components are formed in SCF after Sr segregation: surface Sr-enriched segregates and bulk Sr-deficient parent, as shown in Fig. 1e. | ||
| Fig. 1 Sr 3d XPS spectra of (a) SCF and (b) SCF-O2. (c) Positron annihilation lifetime spectra of SCF and SCF-O2 and (d) fitting results. (e) The schematic of Sr segregation to generate surface Sr segregates and bulk Sr deficiencies. | ||
2.2. Crystalline structure
X-ray diffraction (XRD) refinement was performed to investigate the impact of Sr segregation on the crystalline structure of SCF. The data in Fig. S3 and Table S3 and S4 (ESI†) indicate that both the SCF and SCF-O2 samples exhibit a tetragonal perovskite structure with a space group of I4/mmm.33 In this structure, the B-site Co and Fe cations are coordinated with five or six oxygen ions, and the coordination polyhedron alternates between pyramidal [FeO5] or [CoO5] and octahedral [FeO6] or [CoO6] along the a-axis and the b-axis. Moreover, the A-site Sr cations are coordinated with 11 or 12 oxygen ions. Thus, SCF-O2 with Sr deficiencies still retains the essential features of a perovskite crystal structure.2.3. Valence states and coordination environments of B-site transition metals
To investigate the changes in valence states of B-site cations due to Sr deficiencies, while avoiding the influence of surface Sr segregates, Sr0.9Co0.7Fe0.3O3−δ (SCF with 10 mol% of Sr deficiency, SCF-d) was synthesized and characterized. The XPS spectra of SCF and SCF-d are shown in Fig. 2a and b and Table S5 and S6 (ESI†). It is known that the binding energy peaks of Fe3+ are located at approximately 709.4 and 722.8 eV while those of Fe4+ are at 711.3 and 724.3 eV in the Fe 2p XPS spectra.34 Thus, the proportion of Fe4+ species to total Fe species (Fe4+/Fe) is approximately 46.17% in SCF, but increases to about 52.50% in SCF-d. Similarly, the proportion of Co4+ species to total Co species (Co4+/Co) in SCF-d (47.66%) is also higher than that in SCF (43.65%).35–37 | ||
| Fig. 2 XPS spectra of (a) Fe 2p and (b) Co 2p of SCF and SCF-d. 57Fe Mossbaüer spectra of (c) SCF and (d) SCF-d samples. | ||
Moreover, 57Fe Mössbauer spectroscopy was used to characterize the changes in valence states and coordination environments of Fe species after Sr segregation. The results are shown in Fig. 2c and d, and Table S7 (ESI†). According to the variations in isomer shift (IS), magnetic field strength (MF), and quadrupole splitting (QS),38 the spectra of both SCF and SCF-d can be fitted in three doublets (labelled as D1, D2, and D3) and one singlet (labelled as S1) with their areas representing the proportion of different Fe species. The ISs of the D1 subspectra of SCF and SCF-d are 0.23(1) mm s−1 and 0.27(1) mm s−1, respectively, which are attributed to Fe3+ species with pyramidal coordination,39 and the D3 of SCF and SCF-d are 0.29(3) and 0.33(3) mm s−1, respectively, which are attributed to Fe3+ species with octahedral coordination.40 The D2 and S1 of both samples with ISs less than 0 are both attributed to Fe4+ species with octahedral coordination. The distinctions in peak shapes, IS and QS of D2 and S1 are mainly caused by differences in adjacent metal elements, as well as the symmetry and distortion of the coordination polyhedra.41–43 With the formation of Sr deficiencies, the proportion of Fe4+ species in SCF-d increases from 43.72% to 51.76%, and the average valence of Fe increases from +3.43 to +3.52.
The increase in the valence states of the B-site transition metal cations due to Sr deficiencies in SCF-d creates more Fe3+–Fe4+ and Co3+–Co4+ ion pairs, thereby expanding the electronic conduction pathway.44 This is reflected in the increased electrical conductivity of SCF-d (155.76 S cm−1) compared to that of SCF (113.55 S cm−1) at 800 °C (Fig. S4, ESI†). In contrast, the electrical conductivity of SCF-O2 decreases significantly to 50.47 S cm−1, primarily due to surface Sr segregates. Generally, the electronic conductivity in bulk materials is orders of magnitude higher than the oxygen ion conductivity.45–50 As the high-temperature OER involves both electronic conduction and oxygen ion conduction processes, oxygen ion transport at the interface plays a decisive role in determining the resistance and the final electrochemical performance.
2.4. DFT calculations
DFT calculations were performed to investigate the influences of surface Sr segregates and bulk Sr deficiencies on oxygen vacancy formation and oxygen ion mobility. First, a model of the dominant crystal (222) facet in the SCF perovskite is constructed based on the refinement results of XRD, as shown in Fig. 3a. Then, the surface model of the SCF-d perovskite (Fig. 3b) is obtained by removing several Sr atoms and reconstructing the structure. Finally, the SrO particle is constructed on the surface of SCF-d to simulate Sr segregation in SCF (SCF-O2, Fig. 3c). Partial density of states (PDOS) diagrams in Fig. 3d reveal that the O 2p band center is lifted from −2.24 eV to −1.88 eV toward the Fermi level after the formation of Sr deficiencies in SCF-d but is reduced to −2.17 eV in the presence of Sr segregates on the SCF-d surface. It is generally believed that with the lifting of the O 2p band center toward the Fermi level, the hybridization between the transition metal 3d and O 2p orbitals is stronger, which is beneficial for the charge transfer process between M–O–M′ (M and M′ represent transition metal ions with different valence states) and the activation of oxygen ions.51–54 Therefore, the electron transfer capacity and surface oxygen ion activity might be promoted by the bulk Sr deficiencies, but hindered by the surface Sr segregates.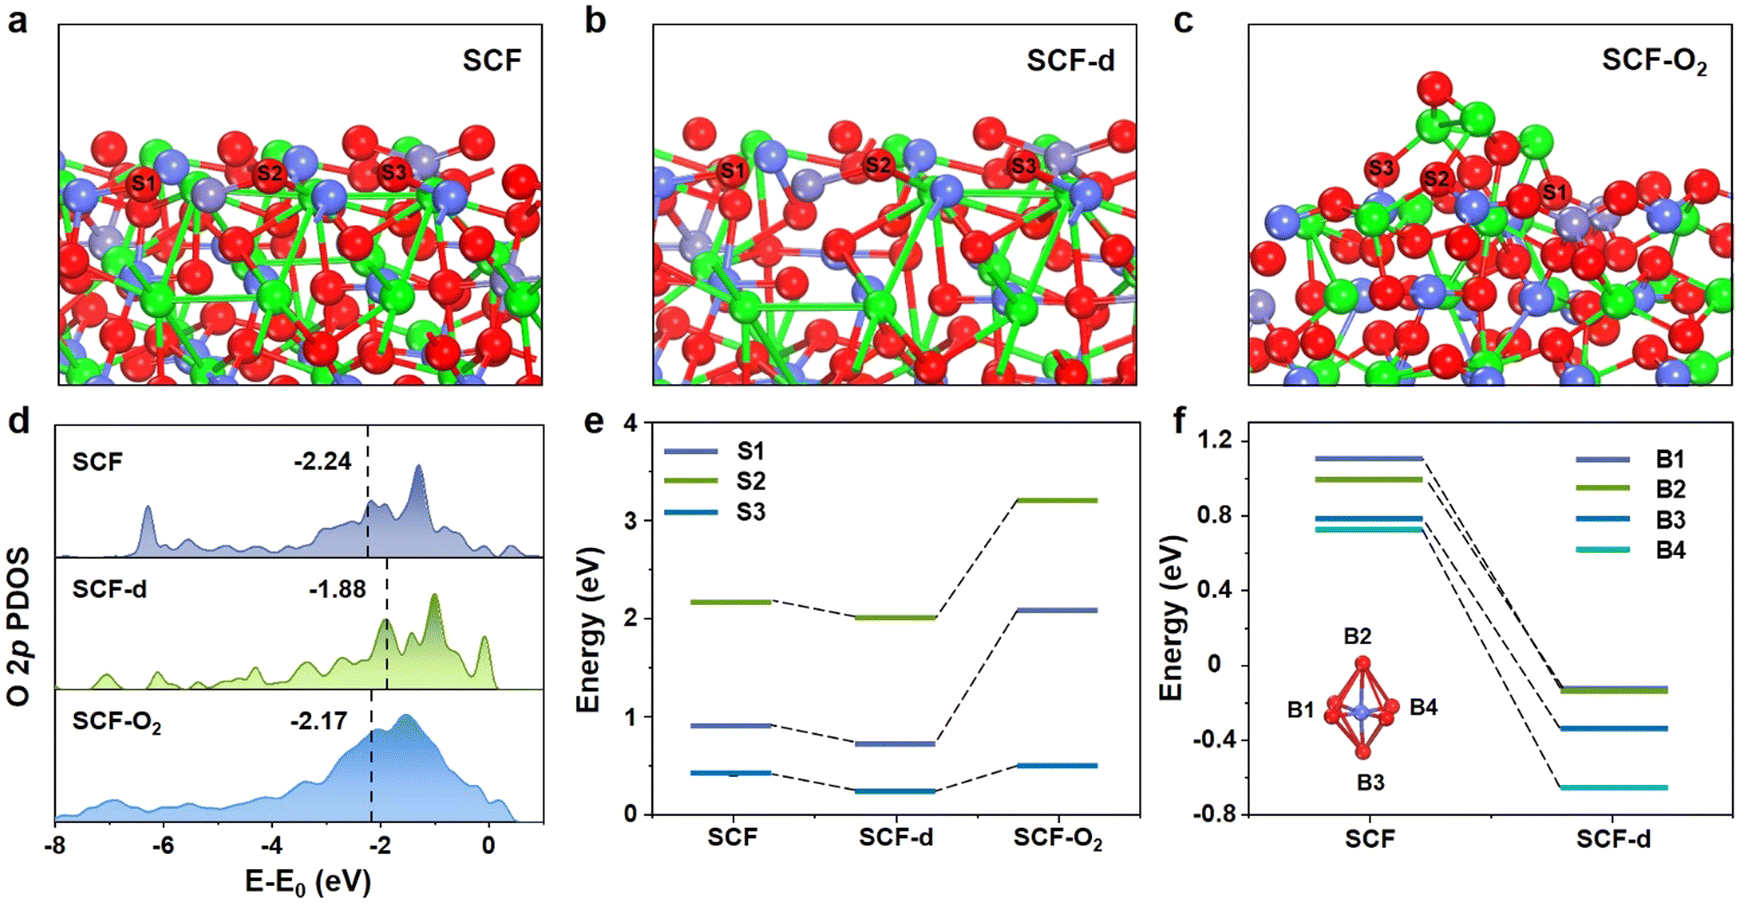 | ||
| Fig. 3 DFT calculation results. (a)–(c) Models used for the calculation of the O 2p band center and Evfs for the (222) facet of (a) SCF, (b) SCF-d and (c) SCF-O2. (d) PDOS diagrams of the O 2p band and the calculated band center relative to the Fermi level, (e) Evfs of different sites in SCF, SCF-d and SCF-O2 and (f) Evfb of different sites in SCF and SCF-d. Color code: O (red ball), Sr (green ball), Co (dark blue ball), and Fe (light blue ball). | ||
For SCF and SCF-d, three types of oxygen atoms bonded with Co/O (S1), Co/Sr (S2) and Fe/Sr (S3) atoms on the surfaces are removed, while for SCF-O2, three types of oxygen atoms bonded with Sr/Fe (S1), Sr/Sr (S2) and Sr/Co (S3) atoms at the SrO/SCF-d interface are removed (Fig. S5, ESI†), and the required energy is defined as the surface oxygen vacancy formation energy (Evfs). The calculation results, presented in Fig. 3e and Table S8 (ESI†), show that, compared with SCF, Evfs at each position of SCF-d is reduced, while Evfs at the SrO/SCF-d interface significantly increases. This indicates that Sr deficiencies promote the formation of oxygen vacancies, whereas surface Sr segregates suppress the generation of interface oxygen vacancies.
Similarly, oxygen atoms at four different sites (B1–B4) are removed from the bulk models of SCF and SCF-d, and the required energy is defined as the bulk oxygen vacancy formation energy (Evfb). As shown in Fig. 3f and Fig. S6 (ESI†), and listed in Table S9 (ESI†), all Evfb values at four positions significantly decrease from 1.10, 1.00, 0.78, and 0.73 eV in SCF to −0.12, −0.12, −0.66, and −0.33 eV in SCF-d, indicating that Sr deficiencies in SCF-d promote the formation of oxygen vacancies in the bulk phase.
2.5. Oxygen vacancy concentration and oxygen ion mobility
The results of DFT calculations can be further verified by the physicochemical characterization. In the O2-temperature programmed desorption (O2-TPD) profiles (Fig. 4a), the desorption peaks in the temperature range of 200–450 °C are attributed to the desorption of surface adsorbed oxygen species (Oads.), while the desorption peaks at 800 °C correspond to the desorption of lattice oxygen (Olat.).55,56 The onset desorption temperatures for surface adsorbed oxygen species are 206 °C, 198 °C, and 266 °C for SCF, SCF-d, and SCF-O2, respectively, indicating that Sr deficiencies lower the desorption energy for oxygen ions in SCF-d, whereas the formation of Sr-segregated species on the surface of SCF-O2 has the opposite effect. As Oads generally attaches to surface oxygen vacancies, its desorption peak intensity can reflect the surface oxygen vacancy concentration at high temperatures. Compared to SCF, the desorption peak intensities of both Oads. and Olat. increase in SCF-d but decrease in SCF-O2, indicating that the oxygen vacancy concentration increases due to the bulk Sr deficiencies but decreases due to surface Sr segregates. | ||
| Fig. 4 Physicochemical measurement results. (a) O2-TPD profiles and (b) and (c) 18O2 isotope exchange profiles of different samples, (d) and (e) 18O− signal intensity distribution of (d) SCF and (e) SCF-d and (f) normalized linear scan 18O− signals of SCF and SCF-d. (g) and (h) In situ XPS spectra of (g) SCF-SDC and (h) SCF-d–SDC anodes under different conditions and (i) values of Oads/O for the two anodes under different conditions. | ||
The oxygen surface exchange process is examined directly by 18O2 isotope exchange experiment, as shown in Fig. 4b and c and Fig. S7 (ESI†). It is widely acknowledged that the exchange between gaseous 18O2 molecules and lattice 16O ions in a perovskite oxide can be expressed as follows:57
| 18O2(g) + 16O(s) ↔ 18O(s) + 18O16O(g) | (1) |
| 18O2(g) + 16O–16O(s) ↔ 18O–18O(s) + 16O2(g) | (2) |
The exchange between one lattice 16O ion and an 18O2 molecule is reflected by the signal with m/z of 34, and the exchange of two lattice 16O ions with an 18O2 molecule is reflected by the signal with m/z of 32. The signal with m/z of 36 represents the consumption of 18O2 with increasing temperature. As shown in Fig. 4a–c, the desorption temperatures of the signals with m/z of 32 and 34 decrease from 327 °C and 340 °C for SCF to 271 °C and 286 °C for SCF-d with Sr deficiencies, but increase back to 304 °C and 320 °C for SCF-O2, while the total amount of 18O2 is simultaneously reduced (Fig. S6, ESI†). Therefore, it is reasonable to conclude that the Sr deficiencies induced in the bulk can enhance the transport and surface exchange of oxygen species. However, the enhancement is hindered by the accumulation of Sr-enriched phase on the surface. Moreover, electrical conductivity relaxation (ECR) profiles in Fig. S8 (ESI†) show that SCF-d reaches the equilibrium state faster than SCF at 800 °C as oxygen partial pressure is reduced from 0.21 to 0.05 atm.58–60 According to the fitting results of the ECR profiles, the oxygen chemical diffusion coefficient (Dchem) of SCF-d is 7.05 × 10⁻⁵ cm2 s−1, which is much higher than that of SCF (3.20 × 10⁻⁵ cm2 s−1), further confirming enhanced bulk oxygen ion mobility due to Sr deficiencies under typical SOEC operating conditions.
Furthermore, quasi in situ time-of-flight secondary ion mass spectrometry (TOF-SIMS) measurements are performed to investigate the effect of Sr deficiencies on the bulk oxygen ion mobility under the working conditions (Fig. S9, ESI†). The two-dimensional spectra of the 16O− and 18O− signals shown in Fig. 4d and e and Fig. S10 (ESI†) are obtained by bombarding the cross-section of the pretreated SOEC (see the Experimental section for details) with an ion beam and collecting the generated secondary ions. The 18O− signal intensity of the SCF anode is significantly higher than that of SCF-d. Since both cells are pretreated under the same conditions, equal amounts of 18O2− are transferred from the cathode to anode; therefore, the weaker intensity of the 18O− signal in the cross-section of the SCF-d anode indicates that more 18O2− in the SOEC with the SCF-d anode is transferred to the anode surface and evolves into a gas. Additionally, the two-dimensional spectra are integrated and normalized along the y-axis in Fig. 4f, and the 18O− signal at the cross-section of the SCF-d anode is significantly decreased compared with that of SCF, indicating that the bulk oxygen ion transport process in SCF-d is accelerated. Therefore, physicochemical measurements combined with DFT calculations above show that Sr deficiencies promote the formation of oxygen vacancies, resulting in enhanced oxygen ion mobility, while the surface Sr segregates do the opposite.
As the OER kinetics is closely related to the oxygen vacancy concentration and the oxygen ion mobility of the anode, high-temperature in situ electrochemical XPS measurements are performed to explore the impact of Sr deficiencies on the OER process. As shown in Fig. 4g–i, O 1s XPS spectra can be fitted into four peaks, corresponding to four different surface oxygen species.51,61–63 The peak with the lowest binding energy at approximately 528.40 eV belongs to Olat., and the other three oxygen species at 529.60, 531.00 and 532.50 eV represent highly active O− or O22−, adsorbed OH−, and adsorbed H2O, respectively; these three oxygen species are classified as Oads. species. With the temperature increasing to 1000 K, most Oads. species desorb from the anode surface, and the proportion of Oads. species is reduced by 60.17% in SCF-d–SDC and 57.83% in SCF-SDC, which indicates a higher oxygen vacancy concentration in the SCF-d–SDC anode and is consistent with the results of DFT calculations and O2-TPD. After applying a constant current of 1 mA to SOECs (Fig. 4i and Table S10, ESI†), the content of Oads increases by 23.26% in SCF-SDC and 40.05% in SCF-d–SDC because of the spillover processes of oxygen ions from the triple phase boundaries onto the anode surface under anodic polarization. The higher content of surface spillover oxygen species on SCF-d indicates that Sr deficiencies could accelerate the elementary process of the OER due to the enhanced oxygen ion mobility and surface diffusion capacity.
2.6. Electrochemical performance measurements
To investigate the overall effect of Sr segregation on OER activity of the SCF anode, a La0.8Sr0.2Ga0.8Mg0.2O3−δ (LSGM)-supported symmetrical cell with SCF-SDC electrodes is treated under an O2 atmosphere at 800 °C to induce the surface Sr segregation, and the EIS spectra were collected continuously to monitor the changes of ohmic and polarization resistances (Rp). As shown in Fig. 5a, along with the treatment duration up to 100 h, Rp under OCV at 800 °C in pure O2 decreases from 0.09 to 0.04 Ω cm2, while the ohmic resistance (RΩ) increases from 0.26 to 0.27 Ω cm2, and the total resistance decreases from 0.35 to 0.31 Ω cm2. Moreover, Ar ion etching-assisted quasi in situ electrochemical XPS measurements with an etching depth of 20–40 nm in Fig. S11–S12 (ESI†) demonstrate that RΩ also significantly decreases after the surface Sr segregates were etched by Ar ions. Therefore, the surface Sr segregates decelerate the electron transfer process, resulting in an increase in RΩ as shown in Fig. 5b. The decreased Rp is attributed to the increased oxygen vacancy concentration and enhanced oxygen ion mobility of the SCF bulk with Sr deficiencies. However, the opposite trends between RΩ and Rp with treatment time indicate that the formation of surface Sr segregates and the bulk Sr deficiencies exhibits a dual-impact mechanism on OER activity during the Sr segregation process. | ||
| Fig. 5 The electrochemical performances of SOECs with different anodes at 800 °C. (a) and (b) EIS spectra of an SCF-SDC symmetrical cell immersed in an O2 atmosphere at 800 °C for 100 hours. (c) EIS spectra of single cells with different anodes at 1.2 V and (d) the DRT fitting results. (e) Current density–voltage curves (J–V) at 800 °C. (f) A schematic illustration of Sr segregation. | ||
EIS spectra of the single cells with a LSCF-SDC cathode and different anodes are shown in Fig. 5c and Fig. S13 (ESI†). It is evident that the presence of Sr deficiencies could efficiently decrease RΩ from 0.32 Ω cm2 for the SCF-SDC anode to 0.28 Ω cm2 for the SCF-d–SDC anode with the concurrent decrease of Rp from 0.16 to 0.09 Ω cm2. However, after the formation of Sr segregates on the SCF-O2-SDC anode surface, Rp remains almost the same as that of the SCF-d–SDC anode, but RΩ increases from 0.28 to 0.33 Ω cm2, which are consistent with the EIS results of a symmetrical cell as shown in Fig. 5a and b.
DRT analysis of the impedance data is presented in Fig. 5d, providing more detailed information on the frequency dispersion of electrode processes.64 Three distinct peaks are identified in the DRT plots, corresponding to three electrode processes with different relaxation times. Typically, the process taking place at a high frequency range (P1) is attributed to the transportation of oxygen ions through the electrode/electrolyte, the process at an intermediate frequency range (P2) may be associated with electron transfer and surface reactions at the anode interface, and the process at a low frequency range (P3) may be related to the cathodic CO2 reduction processes, including CO2 adsorption, dissociation of carbonate species, and CO desorption.65–68 Moreover, the complex nonlinear least squares method (CNLS) fittings of EIS curves are performed based on the DRT results to further quantitatively analyze each elementary reaction process (Fig. 5a and Table S11, ESI†), and the equivalent circuit model used in the curve fitting is shown in Fig. S14 (ESI†). One resistor (RΩ) and three R–C parallel components (R1–C1 to R3–C3) are connected in series to simulate RΩ and the three electrode reaction processes corresponding to P1, P2, and P3. Among these three processes, P1 changes sensitively with anode materials. For example, the R1 value decreases by 44.33% as the anode is changed from SCF-SDC to SCF-d–SDC, due to the increased oxygen ion mobility and the accelerated rate of electron transport within the Sr-deficient SCF-d bulk phase. In contrast, the R1 value increases by 59.49% after the formation of surface Sr segregates, resulting from the blocking effect of the surface Sr-enriched oxide. The bulk electronic conductivity primarily determines the electron transport process within the material, corresponding to RΩ observed in the EIS. In contrast, the exchange and transport of oxygen ions at the interface significantly influence the anodic reaction processes, corresponding to the R1 process in the EIS and DRT. The electrochemical analysis results indicate a reduction in R1 for SCF-d, suggesting that Sr deficiencies enhance the performance of electrochemical reactions and promote overall kinetics by improving ion mobility and the interfacial charge transfer rate. Thus, the performance of the SOEC for CO2 electrolysis is enhanced (Fig. 5e) by the Sr deficiencies in the bulk phase but hindered by the Sr segregates on the surface (Fig. 5f).
3. Conclusions
In summary, the dual impacts of Sr segregation on the electrochemical performance are systematically investigated. Results clearly demonstrate that Sr deficiencies significantly enhance both electron and oxygen ion transport in the bulk phase while surface Sr segregates suppress the formation of oxygen vacancies, leading to a diminished rate of oxygen exchange and reduced surface electrical conductivity. Our study provides a comprehensive understanding of the Sr segregation processes, the roles of Sr deficiencies and surface accumulation of Sr-enriched phases, and their impacts on oxygen vacancy formation, oxygen ion mobility, and the rate of electrode reactions. These findings have implications for the knowledge-based design of new electrode materials with enhanced performance and stability.4. Experimental section
4.1. Electrode material preparation
SrCo0.7Fe0.3O3−δ (SCF), Sr0.9Co0.7Fe0.3O3−δ (SCF-d) and La0.6Sr0.4FeO3−δ (LSF) powders were synthesized as electrode materials by the sol–gel method. First, stoichiometric metallic nitrate (AR, Aladdin Industrial Corporation) was dissolved in deionized water, and then citric acid and EDTA (both 1.5 times the molar ratio of total metal ions) were added to the solution with stirring. The pH of the solutions was adjusted to approximately 8 by ammonium hydroxide, and then the solutions were heated at 80 °C until the water completely evaporated. After the self-propagating combustion, black powders were obtained. Finally, the powders were sintered in a muffle furnace at 1000 °C for 5 h in air. The Ce0.8Sm0.2O2−δ (SDC) powder was synthesized by a similar method. Typically, Ce(NO3)3·6H2O (Aladdin Industrial Corporation. AR) and Sm(NO3)3·6H2O (Aladdin Industrial Corporation, AR) were dissolved in deionized water in a stoichiometric ratio, and then CA was added to the solution with a ratio of CA to total metal ions of 125 g: 1 mol, followed by the addition of PVA of equal mass with CA under stirring and heating. Then, the solution was further heated and stirred at 80 °C until the water was evaporated to generate a yellow powder. Finally, the light-yellow powder was sintered in a muffle furnace at 800 °C for 3 h to obtain the target sample. SCF was treated in pure oxygen for 5 h and the sample was labelled as SCF-O2.4.2. Cell fabrication
La0.8Sr0.2Ga0.8Mg0.2O3−δ (LSGM, fuel cell materials) electrolyte powder mixed with polyvinyl pyrrolidone (PVP) at a weight ratio of 97![[thin space (1/6-em)]](https://www.rsc.org/images/entities/char_2009.gif) :3 was dry-pressed and sintered at 1450 °C for 10 h in air to form a pellet of ca. 500 μm in thickness. LSF powder (0.65 g) and SDC powder (0.35 g) were mixed by grinding, and then the powder was blended with 94% terpineol-6% ethylcellulose to form a LSF-SDC cathode slurry. SCF or SCF-d powders (0.70 g) were mixed with 0.30 g SDC powder and 94% terpineol-6% ethylcellulose to form the anode slurries. SCF or SCF-d powders (1.0 g) were mixed with 94% terpineol-6% ethylcellulose to form anode slurries for physicochemical measurements.
:3 was dry-pressed and sintered at 1450 °C for 10 h in air to form a pellet of ca. 500 μm in thickness. LSF powder (0.65 g) and SDC powder (0.35 g) were mixed by grinding, and then the powder was blended with 94% terpineol-6% ethylcellulose to form a LSF-SDC cathode slurry. SCF or SCF-d powders (0.70 g) were mixed with 0.30 g SDC powder and 94% terpineol-6% ethylcellulose to form the anode slurries. SCF or SCF-d powders (1.0 g) were mixed with 94% terpineol-6% ethylcellulose to form anode slurries for physicochemical measurements.
SOECs were fabricated by the screen-printing method. First, anode slurries were printed onto one side of the LSGM pellet and then sintered in a muffle furnace at 1200 °C in air for 2 h. Afterward, the cathode slurry was printed onto the other side of the LSGM pellet and then sintered in a muffle furnace at 1100 °C in air for 2 h. The anode slurry was printed onto both sides of the LSGM pellets and then sintered in air at 1200 °C for 2 h in a muffle furnace to obtain ready-to-use symmetrical cells. The areas of the anode and cathode used for electrochemical measurements and quasi in situ time of flight secondary ion mass spectrometry (TOF-SIMS) measurements were 0.50 and 0.78 cm2, respectively, which were 0.28 and 0.50 cm2 for those used for in situ X-ray photoelectron spectroscopy (XPS) measurements. The thickness of the anode is about 40 μm (Fig. S15, ESI†)
4.3. Physicochemical characterization
The cross-section and morphologies of the SOEC electrodes were obtained using a JSM-7900F field emission scanning electron microscope (SEM). Energy-dispersive X-ray spectroscopy (EDS) elemental maps of the electrodes were obtained using a JEOL JEM-ARM300F atomic resolution transmission electron microscope and a JEM-F200 field emission high-resolution scanning transmission electron microscope.Powder X-ray diffraction (XRD) experiments were carried out at different temperatures from RT to 800 °C in air using a PANalytical X’pert PPR diffractometer equipped with a Cu Kα radiation source (λ = 1.5418 Å) operating at 40 kV and 40 mA. The Rietveld refinement results were obtained using Highscore plus software.
X-ray photoelectron spectroscopy (XPS) measurements were conducted using an ESCALAB 250Xi spectrometer. Al Kα was used as the X-ray excitation source, and the vacuum in the analysis chamber was maintained at 7 × 10⁻⁵ Pa. The sample data were calibrated using the C 1s peak at a binding energy of 284.6 eV, and the data were analyzed and fitted using the XPS Peak software.
Positron annihilation tests were carried out at the Institute of High Energy Physics of the Chinese Academy of Sciences. The 22Na radioactive source was used as the positron source with a source intensity of approximately 13 μCi. Two identical samples with a thickness of 1 mm and a diameter of 13 mm were tightly sandwiched between the two sides of the 22Na source. A pair of BaF2 scintillator detectors were used to detect the gamma rays released after the positron annihilation, and the positron annihilation lifetime spectrum was measured by a fast-slow coincidence measurement technique with a total lifetime spectrum count of 2 million to ensure statistical accuracy. The time resolution of the positron annihilation lifetime spectrometer was approximately 210 ps, and the electronics of the measurement system were standard NIM modules from EG&G, USA.
Ex situ X-ray photoelectron spectroscopy (XPS) tests were performed using an ESCALAB 250Xi spectrometer. Al Kα was used as the X-ray excitation source, and the vacuum of the analytical chamber was 7 × 10⁻⁵ Pa. The C 1s peak with a binding energy of 284.6 eV was used to calibrate the energy, and the results were analyzed and fitted using XPSPeak software. In situ XPS spectra of all the samples were collected on an EnviroESCA-Near Ambient Pressure XPS. The O 1s signals were collected at RT and 800 °C, and then a constant current was applied to the SOECs, and the corresponding O 1s signal was collected.
Ar ion etching treatment was performed using a laboratory-built XPS equipped with a SPECS XR-50 X-ray gun and a SPECS PHOIBOS-100 energy analyzer. The vacuum of the analytical chamber during etching was 5 × 10⁻⁶ mbar, the etching voltage was 2.5 kV, and the etching depth was about 20–40 nm. XPS spectra of Sr 3d were collected after etching to observe the content of Sr species on the surface.
Mössbauer spectroscopy measurements were performed on a Topologic Systems MFD-500AV-02 Mössbauer spectrometer, and the results were analyzed and fitted by Mosswinn software.
O2-temperature programmed desorption (O2-TPD) experiments were performed using an Auto Chem II 2920 chemisorption instrument (Micromeritics Chemisorption Analyzer, USA). The samples were first pretreated at 800 °C in 5% O2–95% He flow for 1 h, and then the samples were cooled to room temperature and held for 30 min under He flow. After, the O2 desorption process was performed at a heating rate of 10 °C min−1 under He with a flow rate of 50 mL min−1 from 50 °C to 750 °C, the desorption products were detected using an OmniStar online quadrupole mass spectrometer, and the signal at m/z of 32 was detected for analysis. For the 18O2 isotope exchange tests, the samples were preheated at 800 °C in 20% O2–80% He for 1 h. Then, the sample was placed under He flow for 30 min. After that, the sample was cooled to room temperature in He flow. Then, 5% 18O2–95% He was introduced into the sample at a flow rate of 10 mL min−1 along with a heating rate of 10 °C min−1 from 50 to 750 °C. The signals at m/z of 32, 34 and 36 were detected for analysis.
TOF-SIMS measurements were carried out in TOF mode using SIMS 5-100 (IONTOF, Germany) at Ningbo Institute of Materials Technology & Engineering, Chinese Academy of Sciences. Typically, the cathode was fed with 5% 18O2–95% He, while a constant current of 200 mA was applied to the SOEC for 45 min. The cross-section of the treated SOEC was tested using a 30 kV Bi ion source to observe the imaging signals of 18O− and 16O− at the interface of the electrolyte and the anode.
57Fe Mössbauer spectrometry was carried out at 300 K for 24 hours. Data analysis and fitting were entrusted to the Mössbauer Spectroscopy Testing Center within the institute, using the MossWinn software.
Electrical conductivity relaxation (ECR) test was performed at temperatures of 600, 700, and 800 °C. The testing method involved introducing air into the test tube at a flow rate of 100 mL min−1 at constant temperature, while measuring the I–t curve at 1 mV. Once the curve stabilized, the atmosphere was rapidly switched to 5% O2–95% Ar at the same flow rate of 100 mL min−1. The test was concluded once the curve stabilized again.
The electrical conductivity test was conducted using a two-electrode four-terminal method. A constant voltage was applied using a PGSTAT302N Autolab electrochemical workstation, and the conductivity was calculated from the chronoamperometric curve. The test was performed in an air atmosphere at temperatures ranging from 300 to 800 °C.
4.4. Electrochemical measurements
Electrochemical performances of SOECs were evaluated in a lab-made tube furnace using a two-electrode, four-terminal method with both electrodes coated with gold paste. For CO2 electrolysis, the cathode was injected with carbon dioxide (95% CO2–5% N2) at a flow rate of 50 mL min−1, while the anode was exposed to static air. For O2 treatment, the cathode was exposed to static air, and the anode was fed with O2 at a flow rate of 50 mL min−1 at 800 °C. Electrochemical data were collected on an Autolab potentiostat (PGSTAT 302 N) at different temperatures from 800 to 700 °C. The current–voltage density (J–V) curves were scanned from 0 to 2.0 V at a rate of 10 mV s−1. Electrochemical impedance spectroscopy (EIS) plots at 1.2 V were collected over a frequency range of 0.1 Hz to 1 MHz. The results were further analyzed by distribution of relaxation time (DRT) analysis and equivalent circuit model fitting using RelaxIS 3 software (rhd instrument). The stability of the SOEC was tested by chronoamperometry at 800 °C and 1.2 V. Electrical conductivity and conductivity relaxation measurements were both carried out in a lab-made tube furnace. SCF and SCF-d powders were first dry-pressed under 1400 MPa using bar molds and then sintered in air at 1100 °C for 10 h to form dense bars. The Archimedes drainage method verified that the density of all bars exceeded 98%. Then, these bars were exposed to static air, attached to the potentiostat by a silver wire and fixed with silver paste. For the calculation of the electrical conductivity, a voltage of 0.01 V was applied to the bar as the temperature increased from 450 °C to 800 °C, and the electrical conductivities of all samples were calculated by measuring the chronoamperometric curve. For the conductivity relaxation measurements, a voltage of 0.01 V was applied to the bar at a constant temperature with an air flow of 100 mL min−1. When the current signal was stable, the atmosphere was switched to 5% O2–95% Ar with the same flow rate, and the current signals were collected and fitted using ECRTools software.4.5. DFT calculations
DFT calculations were performed through periodic, spin-polarized DFT as implemented in the Vienna ab initio simulation (VASP) package. The electron–ion interactions were described by the projector augmented wave (PAW) method. The Perdew–Burke–Ernzerhof function was used as an exchange–correlation functional approximation, and a plane wave basis set with an energy cutoff of 400 eV was used. A 2 × 2 × 1 Monkhorst–Pack k-point mesh was used to accomplish Brillouin zone integration.4 When the force residue was smaller than 0.01 eV Å−1, the structural optimization was terminated. An on-site Hubbard term U–J was added to the open-shell d-electrons to correct the significant self-interaction error inherent to the standard DFT in describing localized d-electrons with strong correlations, 4.0 eV for Fe and 4.0 eV for Co. For surface models, the four layers near the surface were relaxed, and the bottom five layers were fixed.The formation energy of oxygen vacancies was investigated by removing one of the four kinds of oxygen sites to simulate the oxygen vacancies, which are the two top sites and two of the four in-plane sites. For the calculations of oxygen vacancy formation energy (Evf), Evf was defined as follows:
| Evf = (Evac + 1/2EO2) − Eclean |
Data availability
The data that support the findings of this study are available from the corresponding author, Guoxiong Wang (wanggx@dicp.ac.cn), upon reasonable request.Conflicts of interest
There are no conflicts to declare.Acknowledgements
The authors gratefully acknowledge financial support from the National Key R&D Program of China (2021YFA1502400), the National Natural Science Foundation of China (22272176, 22125205, 22350710789, 92045302, 22072146, 22002158 and 22321002), the Strategic Priority Research Program of the Chinese Academy of Sciences (XDB0600200), the Joint Fund of the Yulin University and the Dalian National Laboratory for Clean Energy (YLU-DNL Fund 2022008), the Liaoning Binhai Laboratory (LBLF-2023-02), the Fundamental Research Funds for the Central Universities (20720220008), Dalian National Laboratory for Clean Energy (DNL202007, DNL201923), and the Photon Science Center for Carbon Neutrality. The authors are also grateful for the technical support from Nano-X at Suzhou Institute of Nano-Tech and Nano-Bionics (SINANO), Chinese Academy of Sciences. The authors thank Dr Wei Wei and Dr Rong Huang from SINANO for their help in the TOF-SIMS measurement. ML acknowledges the support of Hightower Endowed Chair and Georgia Tech Foundation.Notes and references
- A. Hauch, R. Kungas, P. Blennow, A. B. Hansen, J. B. Hansen, B. V. Mathiesen and M. B. Mogensen, Science, 2020, 370, eaba6118 CrossRef CAS PubMed
.
- Y. Zheng, J. C. Wang, B. Yu, W. Q. Zhang, J. Chen, J. L. Qiao and J. J. Zhang, Chem. Soc. Rev., 2017, 46, 1427–1463 RSC
- S. D. Ebbesen, S. H. Jensen, A. Hauch and M. B. Mogensen, Chem. Rev., 2014, 114, 10697–10734 CrossRef CAS PubMed
- Y. F. Song, X. M. Zhang, K. Xie, G. X. Wang and X. H. Bao, Adv. Mater., 2019, 31, e1902033 CrossRef PubMed
- J. Hwang, R. R. Rao, L. Giordano, Y. Katayama, Y. Yu and Y. Shao-Horn, Science, 2017, 358, 751–756 CrossRef CAS PubMed
- Y. F. Li, W. Q. Zhang, Y. Zheng, J. Chen, B. Yu, Y. Chen and M. L. Liu, Chem. Soc. Rev., 2017, 46, 6345–6378 RSC
- P. Kim-Lohsoontorn, D. J. L. Brett, N. Laosiripojana, Y.-M. Kim and J.-M. Bae, Int. J. Hydrogen Energy, 2010, 35, 3958–3966 CrossRef CAS
- M. Li, B. Hua, J. Chen, Y. M. Zhong and J. L. Luo, Nano Energy, 2019, 57, 186–194 CrossRef CAS
- Y. F. Zheng, H. G. Jiang, S. Wang, B. Qian, Q. S. Li, L. Ge and H. Chen, Ceram. Int., 2021, 47, 1208–1217 CrossRef CAS
- J. T. S. Irvine, D. Neagu, M. C. Verbraeken, C. Chatzichristodoulou, C. Graves and M. B. Mogensen, Nat. Energy, 2016, 1, 15014 CrossRef CAS
- P. Prasopchokkul, P. Seeharaj and P. Kim-Lohsoontorn, Int. J. Hydrogen Energy, 2021, 46, 7023–7036 CrossRef CAS
- Q. Liu, C. H. Yang, X. H. Dong and F. L. Chen, Int. J. Hydrogen Energy, 2010, 35, 10039–10044 CrossRef CAS
- J. Choi, S. Park, H. Han, M. Kim, M. Park, J. Han and W. B. Kim, J. Mater. Chem. A, 2021, 9, 8740–8748 RSC
- Z. P. Shao and S. M. Haile, Nature, 2004, 431, 170–173 CrossRef CAS PubMed
- W. C. Feng, Y. F. Song, T. F. Liu, J. W. Li, X. M. Zhang, J. H. Wang, G. X. Wang and X. H. Bao, Fundam. Res., 2021, 1, 439–447 CrossRef CAS
- W. C. Feng, T. F. Liu, R. T. Li, J. W. Li, X. M. Zhang, Q. X. Liu, J. H. Wang, M. R. Li, Q. Fu, Y. F. Song, G. X. Wang and X. H. Bao, Chem Catal., 2023, 3, 100504 CrossRef CAS
- B. Koo, K. Kim, J. K. Kim, H. Kwon, J. W. Han and W. Jung, Joule, 2018, 2, 1476–1499 CrossRef CAS
- Y. Chen, W. Jung, Z. H. Cai, J. J. Kim, H. L. Tuller and B. Yildiz, Energy Environ. Sci., 2012, 5, 7979–7988 RSC
- Z. H. Pan, Q. L. Liu, L. Zhang, X. W. Zhang and S. H. Chan, J. Electrochem. Soc., 2015, 162, F1316 CrossRef CAS
- W. Lee, J. W. Han, Y. Chen, Z. H. Cai and B. Yildiz, J. Am. Chem. Soc., 2013, 135, 7909–7925 CrossRef CAS PubMed
- G. M. Rupp, H. Téllez, J. Druce, A. Limbeck, T. Ishihara, J. Kilner and J. Fleig, J. Mater. Chem. A, 2015, 3, 22759–22769 RSC
- Y. F. Li, W. Q. Zhang, T. Wu, Y. Zheng, J. Chen, B. Yu, J. X. Zhu and M. L. Liu, Adv. Energy Mater., 2018, 8, 1801893 CrossRef
- G. Kaur, A. P. Kulkarni, D. Fini, S. Giddey and A. Seeber, J. CO2 Util., 2020, 41, 101271 CrossRef CAS
- Y. F. Tian, Y. Liu, L. C. Jia, A. Naden, J. Chen, B. Chi, J. Pu, J. T. S. Irvine and J. Li, J. Power Sources, 2020, 475, 228620 CrossRef CAS
- Y. H. Wan, Y. Yang, Y. L. Lu, R. R. Peng and C. R. Xia, ACS Appl. Energy Mater., 2022, 5, 2339–2348 CrossRef CAS
- D. M. Huan, L. Zhang, S. W. Zhang, N. Shi, X. Y. Li, K. Zhu, C. R. Xia, R. R. Peng and Y. L. Lu, J. Mater. Chem. A, 2021, 9, 2706–2713 RSC
- S. L. Zhang, H. Q. Wang, M. Y. Lu, A. P. Zhang, L. V. Mogni, Q. Y. Liu, C. X. Li, C. J. Li and S. A. Barnett, Energy Environ. Sci., 2018, 11, 1870–1879 RSC
- L. T. Ye and K. Xie, J. Energy Chem., 2021, 54, 736–745 CrossRef CAS
- T. H. Etsell and S. Flengas, Chem. Rev., 1970, 70, 339–376 CrossRef CAS
- M. Finsterbusch, A. Lussier, J. A. Schaefer and Y. U. Idzerda, Solid State Ionics, 2012, 212, 77–80 CrossRef CAS
- N. Porotnikova and D. Osinkin, J. Mater. Chem. A, 2024, 12, 2620–2646 RSC
- J. Kansy, Nucl. Instrum. Methods Phys. Res., Sect. A, 1996, 374, 235–244 CrossRef CAS
- S. R. Ede, C. N. Collins, C. D. Posada, G. George, H. Wu, W. D. Ratcliff, Y. L. Lin, J. G. Wen, S. B. Han and Z. P. Luo, ACS Catal., 2021, 11, 4327–4337 CrossRef CAS PubMed
- Z. B. Zhang, Y. L. Zhu, Y. J. Zhong, W. Zhou and Z. P. Shao, Adv. Energy Mater., 2017, 7, 1700242 CrossRef
- K. Zhao, Y. Shen, Z. Huang, F. He, G. Q. Wei, A. Q. Zheng, H. B. Li and Z. L. Zhao, J. Energy Chem., 2017, 26, 501–509 CrossRef
- D. Guo, M. Y. Zhang, Z. Chen and X. X. Liu, RSC Adv., 2018, 8, 33374–33382 RSC
- W. L. Xin, K. K. Lu, D. R. Zhu, H. B. Zeng, X. J. Zhang, R. S. Marks and D. Shan, Electrochim. Acta, 2019, 307, 375–384 CrossRef CAS
- A. I. Rykov, K. Nomura, T. Mitsui and M. Seto, Phys. Rev. B: Condens. Matter Mater. Phys., 2004, 350, 287–304 CrossRef CAS
- E. V. Tsipis, J. C. Waerenborgh and V. V. Kharton, Electrochem. Commun., 2011, 13, 685–688 CrossRef CAS
- A. L. Shaula, Y. V. Pivak, J. C. Waerenborgh, P. Gaczyñski, A. A. Yaremchenko and V. V. Kharton, Solid State Ionics, 2006, 177, 2923–2930 CrossRef CAS
- Z. C. Kuang, S. Liu, X. N. Li, M. Wang, X. Y. Ren, J. Ding, R. L. Ge, W. H. Zhou, A. I. Rykov, M. T. Sougrati, P.-E. Lippens, Y. Q. Huang and J. H. Wang, J. Energy Chem., 2021, 57, 212–218 CrossRef CAS
- A. Grimaud, J. M. Bassat, F. Mauvy, M. Pollet, A. Wattiaux, M. Marrony and J. C. Grenier, J. Mater. Chem. A, 2014, 2, 3594 RSC
- S. K. Jaiswal, R. Ranjan and J. Kumar, J. Alloys Compd., 2020, 844, 155832 CrossRef CAS
- J. Sunarso, S. S. Hashim, N. Zhu and W. Zhou, Prog. Energy Combust. Sci., 2017, 61, 57–77 CrossRef
- B. Wei, Z. Lü, X. Q. Huang, J. P. Miao, X. Q. Sha, X. S. Xin and W. H. Su, J. Eur. Ceram. Soc., 2006, 26, 2827–2832 CrossRef CAS
- E. Bucher, A. Egger, P. Ried, W. Sitte and P. Holtappels, Solid State Ionics, 2008, 179, 1032–1035 CrossRef CAS
- H. Ullmann, N. Trofimenko, F. Tietz, D. Stöver and A. Ahmad-Khanlou, Solid State Ionics, 2000, 138, 79–90 CrossRef CAS
- L. W. Tai, M. M. Nasrallah, H. U. Anderson, D. M. Sparlin and S. R. Sehlin, Solid State Ionics, 1995, 76, 259–271 CrossRef CAS
- S. P. Jiang, Solid State Ionics, 2002, 146, 1–22 CrossRef CAS
- C. Sun, R. Hui and J. Roller, J. Solid State Electrochem., 2010, 14, 1125–1144 CrossRef CAS
- Q. X. Luo, D. Lin, W. Q. Zhan, W. Q. Zhang, L. L. Tang, J. J. Luo, Z. Gao, P. Jiang, M. Wang, L. Y. Hao and K. B. Tang, ACS Appl. Energy Mater., 2020, 3, 7149–7158 CrossRef CAS
- J. Suntivich, W. T. Hong, Y.-L. Lee, J. M. Rondinelli, W. L. Yang, J. B. Goodenough, B. Dabrowski, J. W. Freeland and Y. Shao-Horn, J. Phys. Chem. C, 2014, 118, 1856–1863 CrossRef CAS
- A. Grimaud, O. Diaz-Morales, B. Han, W. T. Hong, Y. L. Lee, L. Giordano, K. A. Stoerzinger, M. T. M. Koper and Y. Shao-Horn, Nat. Chem., 2017, 9, 457–465 CrossRef CAS PubMed
- X. Xi, J. W. Liu, W. Z. Luo, Y. Fan, J. J. Zhang, J. L. Luo and X. Z. Fu, Adv. Energy Mater., 2021, 11, 2102845 CrossRef CAS
- X. M. Zhang, Y. F. Song, F. Guan, Y. J. Zhou, H. F. Lv, G. X. Wang and X. H. Bao, J. Catal., 2018, 359, 8–16 CrossRef CAS
- F. Guan, X. M. Zhang, Y. F. Song, Y. J. Zhou and X. H. Bao, Chin. J. Catal., 2018, 39, 1484–1492 CrossRef CAS
- P.-A. Répécaud, H. Kaper, M. Richard, F. Can and N. Bion, ChemCatChem, 2017, 9, 2095–2098 CrossRef
- Z. S. Zhu, M. Li, C. R. Xia and H. J. M. Bouwmeester, J. Mater. Chem. A, 2017, 5, 14012–14019 RSC
- C. C. Wang, K. F. Chen and S. P. Jiang, J. Electrochem. Soc., 2014, 161, F1133–F1139 CrossRef
- L. B. Lei, Z. T. Tao, T. Hong, X. M. Wang and F. L. Chen, J. Power Sources, 2018, 389, 1–7 CrossRef CAS
- Q. Li, J. B. Wu, T. Wu, H. R. Jin, N. Zhang, J. Li, W. X. Liang, M. L. Liu, L. Huang and J. Zhou, Adv. Funct. Mater., 2021, 31, 2102002 CrossRef CAS
- W. H. Wang, Y. Yang, D. M. Huan, L. K. Wang, N. Shi, Y. Xie, C. R. Xia, R. R. Peng and Y. L. Lu, J. Mater. Chem. A, 2019, 7, 12538–12546 RSC
- Y. F. Song, Z. W. Zhou, X. M. Zhang, Y. J. Zhou, H. M. Gong, H. F. Lv, Q. X. Liu, G. X. Wang and X. H. Bao, Angew. Chem., Int. Ed., 2019, 58, 4617–4621 CrossRef CAS PubMed
- M. Saccoccio, T. H. Wan, C. Chen and F. Ciucci, Electrochim. Acta, 2014, 147, 470–482 CrossRef CAS
- Y. H. Li, Y. Li, Y. H. Wan, Y. Xie, J. F. Zhu, H. B. Pan, X. S. Zheng and C. R. Xia, Adv. Energy Mater., 2019, 9, 1803156 CrossRef
- H. F. Lv, L. Lin, X. M. Zhang, Y. F. Song, H. Matsumoto, C. B. Zeng, N. Ta, W. Liu, D. F. Gao, G. X. Wang and X. H. Bao, Adv. Mater., 2020, 32, e1906193 CrossRef PubMed
- X. M. Zhang, Y. F. Song, F. Guan, Y. J. Zhou, H. F. Lv, Q. X. Liu, G. X. Wang and X. H. Bao, J. Power Sources, 2018, 400, 104–113 CrossRef CAS
- Y. F. Song, X. M. Zhang, Y. J. Zhou, H. F. Lv, Q. X. Liu, W. F. Feng, G. X. Wang and X. H. Bao, J. Energy Chem., 2019, 35, 181–187 CrossRef
Footnotes |
| † Electronic supplementary information (ESI) available. See DOI: https://doi.org/10.1039/d4ee05056h |
| ‡ These authors contributed equally to this work. |
| This journal is © The Royal Society of Chemistry 2025 |