 Open Access Article
Creative Commons Attribution 3.0 Unported Licence
On transient absorption and dual emission of the atomically precise, DNA-stabilized silver nanocluster Ag16Cl2†
Sami
Malola
a and
Hannu
Häkkinen
 *ab
*ab
aDepartment of Physics, Nanoscience Center, University of Jyväskylä, Jyväskylä FI-40014, Finland. E-mail: hannu.j.hakkinen@jyu.fi
bDepartment of Chemistry, Nanoscience Center, University of Jyväskylä, Jyväskylä FI-40014, Finland
First published on 26th February 2024
Abstract
DNA-stabilized silver nanoclusters with 10 to 30 silver atoms are interesting biocompatible nanomaterials with intriguing fluorescence properties. However, they are not well understood, since atom-scale high level theoretical calculations have not been possible due to a lack of firm experimental structural information. Here, by using density functional theory (DFT), we study the recently atomically resolved (DNA)2–Ag16Cl2 nanocluster in solvent under the lowest-lying singlet (S1) and triplet (T1) excited states, estimate the relative emission maxima for the allowed (S1 → S0) and dark (T1 → S0) transitions, and evaluate the transient absorption spectra. Our results offer a potential interpretation of the recently reported transient absorption and dual emission of similar DNA-stabilized silver nanoclusters, providing a mechanistic view on their photophysical properties that are attractive for applications in biomedical imaging and biophotonics.
In recent years, DNA-stabilized silver nanoclusters with size less than two nanometers have attracted significant interest because they are promising fluorophores for near-infrared (NIR) imaging. They are biocompatible by design, they are rather bright and stable emitters, and most intriguingly, their photophysical properties can be tuned by varying DNA's base sequence.1–7
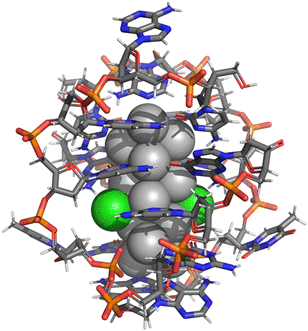
High-level theory on these interesting emitters has not been possible until very recently due to the lack of firm experimental information about their atomic structures. In 2019, two crystal structures were reported for Ag8 (ref. 8) and Ag16 (ref. 9) clusters. The Ag16 cluster is particularly interesting since it has a large Stokes shift making it a NIR-I emitter (>700 nm). It can also be purified before crystallization, enabling direct correlation of the solution state optical properties and crystal structure. Later work refined its structure after a discovery that it contains chloride ligands, giving a formulation of [(DNA)2–Ag16Cl2]q (q = −10) (Fig. 1).10 Our previous theory work has provided evidence of the chloride ligands and a first glimpse of the cluster's electronic structure and character of the optical absorption10 as well as benchmarks on how these systems should be treated in DFT calculations with respect to solvent effects, level of exchange–correlation interactions and the intrinsic charge of the system in solvent.11 In particular, we found in ref. 11 that the cluster charge has a clear effect on the energy gap between the highest occupied and lowest unoccupied molecular orbitals (HOMO–LUMO gap) as well as the computed UV-vis absorption spectrum, which could then be directly compared to the earlier published experimental data. A clear conclusion was that the charge q = −10e gives the absolutely best match to experimental data and the largest HOMO–LUMO gap in the electronic ground state, reflecting optimal stability. As discussed in ref. 11, considering the intrinsic charge distribution in the cluster (16 negatively charged phosphate groups), two negatively charged (deprotonated) guanines (G9−) and two chlorides (Cl−), the overall charge q = −10 means that the silver core is left with 6 “delocalized” electrons, which agrees with earlier experimental evaluations.10,11
 | ||
| Fig. 1 Atomic structure of the (DNA)2–Ag16Cl2 cluster, stabilized by two DNA strands of 9-base sequence 5′-CACCTAGCG-3′ (ref. 10 and 12). Ag: grey spheres, Cl: green spheres, C: grey sticks, N: blue sticks, P: orange sticks, O: red sticks. | ||
Here, we address the interesting recent experimental results on photophysics of the [(DNA)2–Ag16Cl2]q cluster that include dual emission with a delayed microsecond-scale component13 and transient absorption in the NIR-II (>1100 nm) range.14 We propose that the short and long time-scale emissions are due to the lowest spin-allowed (S1 → S0) and spin-forbidden (T1 → S0) transitions, respectively. In addition, we are able to reproduce the measured transient absorption (TA) spectra, which allows us to describe the changes in the electronic density involved in NIR-II absorption, giving an unprecedented “look inside a fluorophore” for this class of biocompatible emitters.
To be able to estimate fluorescence energies, one has to optimize the cluster atomic structure both in the electronic ground state and in the excited states of interest. We showed previously11 that the GLLB-SC DFT xc functional15 yields the best description of the ground state electronic structure and the UV-vis absorption spectrum as compared to experimental data. However, it is not possible to evaluate the analytical gradients (needed for atomic forces) from the GLLB-SC functional. Therefore, we first optimized the published crystal structure of the [(DNA)2–Ag16Cl2]q cluster10 (q = −10) with the PBE xc functional16 using the general-purpose GPAW17 DFT software (for more technical details, see ESI† text). We then created the lowest lying singlet (S1) and triplet (T1) states by transferring an electron from the alpha-HOMO in the ground state S0 configuration to the LUMO in alpha or beta spin channels, respectively, and re-optimized both systems under these fixed occupations. For that, we used the direct orbital optimization coupled with the maximum overlap method (MOM), as installed18 in the GPAW DFT code, since it performs numerically more efficiently as compared to optimization in the linear-response (lr) framework of time-dependent (TD) DFT for systems of this size. After optimization of the atomic structure in the ground or excited states, all further analysis of electronic orbitals and energies was done by using the GLLB-SC functional.
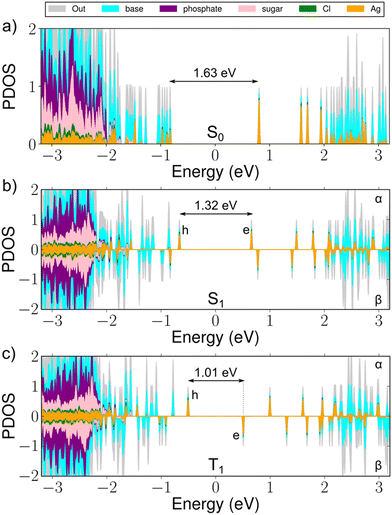
The structural optimization under the S1 and T1 states generally retains the overall geometry of the cluster and symmetry of the Ag16 metal core, but we find three interesting changes (Fig. S1, ESI†). First, the largest changes in Ag–Ag distance are significant, about 8%, and induce a general pattern where the Ag atoms are moving toward increased electron density. Second, the negatively charged guanines G9− move away by about 2.2% at the Ag-DNA interface. This is understandable, since as we described previously,11 the two G9− participate in the S0 HOMO state, which becomes the single-electron hole state for the S1/T1 configuration (Fig. 2). Thus, the electronic excitation weakens the Ag–G9− bond. Third, the length of the inorganic core expands by about 1%. For a more detailed discussion of the atom displacements, see the caption to Fig. S1 (ESI†).
The energy gaps between the hole (h) and electron (e) states in the alpha/beta manifolds are 1.32 eV for the alpha h–e gap and 1.01 eV for the beta h–e gap, as compared to the HOMO–LUMO energy gap of 1.63 eV in the optimized S0 state (Fig. 2). From the changes in the respective total energies of the cluster, we estimate that the emission energies (wavelengths) for the S1 → S0 and T1 → S0 processes are 1.57 eV (789 nm) and 1.36 eV (911 nm), respectively. This yields large Stokes shifts of 221 nm and 343 nm, corresponding to 0.61 eV and 0.82 eV, respectively (Table 1).
| Absorption nm (eV) | Em 1 nm (eV) | Em 2 nm (eV) | Stokes shift nm (eV) | ||||||||||||||||||||||||||||||||||||||||||||||||||||||||||||||||||||||||||||||||||||||||||||||||
|---|---|---|---|---|---|---|---|---|---|---|---|---|---|---|---|---|---|---|---|---|---|---|---|---|---|---|---|---|---|---|---|---|---|---|---|---|---|---|---|---|---|---|---|---|---|---|---|---|---|---|---|---|---|---|---|---|---|---|---|---|---|---|---|---|---|---|---|---|---|---|---|---|---|---|---|---|---|---|---|---|---|---|---|---|---|---|---|---|---|---|---|---|---|---|---|---|---|---|---|
| a Ref. 13. b Ref. 11, calculated by using the experimental structure and the GLLB-SC functional. c In this work the calculated emission energies and corresponding Stokes shifts are with respect to the calculated energy (wavelength) of the 1st absorption peak for a structure that has been optimized using the PBE xc functional and for which the UV-vis absorption spectrum has been calculated with the GLLB-SC functional. | |||||||||||||||||||||||||||||||||||||||||||||||||||||||||||||||||||||||||||||||||||||||||||||||||||
| Exp dataa | 525 (2.36) | 690 (1.80) | 850 (1.46) | 165/325 (0.56/0.90) | |||||||||||||||||||||||||||||||||||||||||||||||||||||||||||||||||||||||||||||||||||||||||||||||
| Exp structure/GLLB-SCb | 530 (2.34) | ||||||||||||||||||||||||||||||||||||||||||||||||||||||||||||||||||||||||||||||||||||||||||||||||||
| PBE structure/GLLB-SCc | 568 (2.18) | 789 (1.57) | 911 (1.36) | 221/343 (0.61/0.82) | |||||||||||||||||||||||||||||||||||||||||||||||||||||||||||||||||||||||||||||||||||||||||||||||
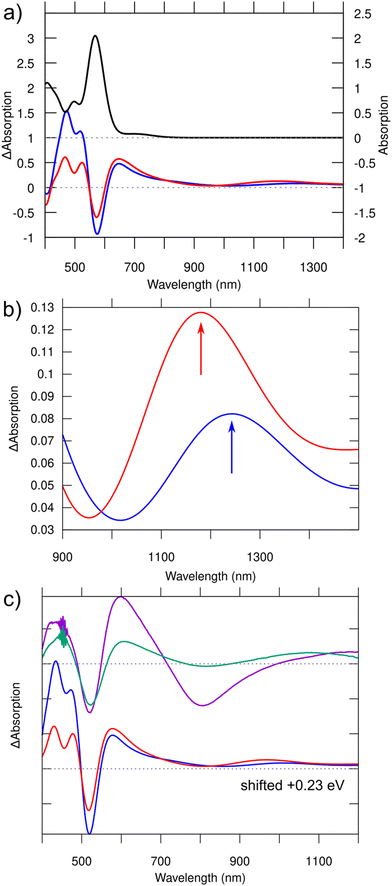
It is of interest to study the absorption in the S1 and T1 excited states, since it provides a way to approximate the transient absorption spectra that can be experimentally accessed. We simulated TA spectra by using linear-response time-dependent DFT (lr-TDDFT, for details, see ESI†). The spectra, shown in Fig. 3a, feature loss of intensity at the energy of ground-state absorption (ground state bleach), a broad antisymmetric peak right on the low-energy side of the ground-state absorption, and a weak broad peak around 1100–1400 nm in the NIR-II region. Zooming into that region one can see a small but definite shift between the absorption maxima under S1 (1244 nm) and T1 (1181 nm) transitions (Fig. 3b, arrows). The character of electronic density changes corresponding to these peaks is visualized in Fig. S2 (ESI†). Contrasted to the HOMO–LUMO transitions of the ground state, these NIR-II transitions involve a larger volume of bases and the Ag-base interface, where particularly the hole density is seen in the bases and electron density mostly in the silver core and in G9−.
 | ||
| Fig. 3 (a) Top: Computed normal absorption spectrum of the S0 ground state of [(DNA)2–Ag16Cl2]10− (scale on the right). Bottom: Computed transient absorption spectra for S1 (blue) and T1 (red) excited states (scale on the left). (b) Zoomed-in view of the curves in the NIR region shown in (a). Note the redshift (about 50 nm) of the absorption maximum in the triplet state with respect to the singlet state. The character of the transitions responsible for these peaks is visualized in Fig. S2 (ESI†). (c) Comparison of the measured TA spectra (top) at 1 ns (purple) and 8 ns (green) from ref. 14 to the computed TA spectra (bottom), which have been blueshifted in this case by 0.23 eV to match the experimental ground state bleaching. Note that the distinct minimum at 800 nm in the experimental TA spectrum measured at 1 ns is due to spontaneous emission, which is not included in our calculations. | ||
These results, combined with our previous work,11 may offer a simple scenario to interpret the recent interesting photophysical data on the DNA2–Ag16Cl2 cluster, published by the Vosch group.13,14 Cerretani et al.13 reported that this cluster has one broad emission band centered around 740 nm at room temperature independent of the solvent (H2O or D2O). However, this band splits into two emission peaks (690 nm and 850 nm, Table 1) at liquid nitrogen temperature and in D2O solvent, giving two Stokes shifts of 165 nm and 326 nm with respect to the strong absorption at 525 nm. Our calculated Stokes shifts match rather well with the experimental values (Table 1). Interestingly, the shorter and longer wavelength emissions were found to have drastically different lifetimes in the nanosecond- and microsecond-range, respectively. Chen et al.14 investigated the dynamics of the excited states in the nanosecond-range using 2D electron spectroscopy and transient absorption. The TA spectra were recorded after several time delays after the initial excitation by a <100 fs pulse centered around 520 nm. Fig. 3c shows two such spectra, recorded at about 1 ns and 8 ns after the excitation.
We have previously shown11 that the absorption detected at 525 nm in the experiment consists solely of a simple HOMO-to-LUMO molecular transition (S0 → S1*) which is strongly dipole-allowed. The involved orbitals resemble “particle-in-a-box” free electron states localized in the silver core, with two (HOMO) and three (LUMO) node planes perpendicular to the long axis.11 Our calculated peak position is in an excellent agreement with the experimental value when we consider the reported crystal structure and the GLLB-SC xc functional (Table 1). While we cannot address here the nature of the vibrational excitations (“hot electronic state” at the Franck–Condon point after initial excitation), we have shown that after electronic relaxation, the T1 state has a lower energy than the S1 state and the relative Stokes shifts to S0 agree quite well with the measured data (Table 1). We thus propose that the microsecond-range emission comes from this lowest spin-forbidden transition T1 → S0. Additional support comes from the comparison of the computed and measured TA spectra (Fig. 3). Chen et al. showed14 that the NIR-II TA peak has a small but definite blueshift between the data collected at 1 and 8 ns and proposed that this signature is due to decay of the short time-scale component and survival of the long time-scale component in the 8 ns data. Our computed TA peaks in that same energy region also show a small but definite blueshift for the T1 → S0 emission, which is consistent with our suggestion that this transition is responsible for the long time-scale TA.
In conclusion, we have proposed a mechanism for dual emission and transient absorption of DNA-stabilized silver nanoclusters having 16 Ag atoms and a crystallographically known atomic structure. We hope that this work will prove useful to understand better the interesting photophysics of DNA-stabilized silver nanocluster emitters that have potential as novel NIR fluorophores in biomedical applications.
The concept of this work was formulated by H. H. and S. M., who also performed the DFT calculations. The results were analysed and the manuscript was written by S. M. and H. H.
This work was supported by the Academy of Finland (grant 355083). The computations were made at the Finnish national supercomputing center CSC (computing grant 2002721). The research idea was conceived by H. H. and S. M., the DFT calculations and analysis of the results were performed by S. M., and the manuscript was co-edited by S. M. and H. H. We acknowledge helpful discussions with María Francisca Matus, Anna Gonzalez-Rosell, Stacy Copp and Tom Vosch on the chemical and photophysical properties of DNA-stabilized silver clusters. We also thank Tom Vosch for sharing numerical data from ref. 14, reproduced in Fig. 3c.
Conflicts of interest
There are no conflicts to declare.Notes and references
- J. T. Petty, J. Zheng, N. V. Hud and R. M. Dickson, J. Am. Chem. Soc., 2004, 126, 5207 CrossRef CAS PubMed.
- T. Vosch, Y. Antoku, J. C. Hsiang, C. I. Richards, J. I. Gonzalez and R. M. Dickson, Proc. Natl. Acad. Sci. U. S. A., 2007, 104, 12616 CrossRef CAS PubMed.
- J. T. Petty, C. Fan, S. P. Story, B. Sengupta, A. John Iyer, Z. Prudowsky and R. M. Dickson, J. Phys. Chem. Lett., 2010, 17, 2524 CrossRef PubMed.
- S. M. Copp, D. Schultz, S. Swasey and E. Gwinn, ACS Nano, 2015, 9, 2303 CrossRef CAS PubMed.
- V. A. Neacşu, C. Cerretani, M. B. Liisberg, S. M. Swasey, E. G. Gwinn, S. M. Copp and T. Vosch, Chem. Commun., 2020, 56, 6384 RSC.
- A. Gonzàlez-Rosell, C. Cerretani, P. Mastracco, T. Vosch and S. M. Copp, Nanoscale Adv., 2021, 3, 1230 RSC.
- P. Mastracco, A. Gonzàlez-Rosell, J. Evans, P. Bogdanov and S. M. Copp, ACS Nano, 2022, 16, 16322 CrossRef CAS PubMed.
- D. J. E. Huard, A. Demissie, D. Kim, D. Lewis, R. M. Dickson, J. T. Petty and R. L. Lieberman, J. Am. Chem. Soc., 2019, 141, 11465 CrossRef CAS PubMed.
- C. Cerretani, H. Kanazawa, T. Vosch and J. Kondo, Angew. Chem., Int. Ed., 2019, 58, 17153 CrossRef CAS PubMed.
- A. Gonzalez Rosell, S. Malola, R. Guha, N. R. Arevalos, M. Rafik, M. F. Matus, M. E. Goulet, E. Haapaniemi, B. B. Katz, T. Vosch, J. Kondo, H. Häkkinen and S. M. Copp, J. Am. Chem. Soc., 2023, 145, 10721 CrossRef CAS PubMed.
- S. Malola, M. F. Matus and H. Häkkinen, J. Phys. Chem. C, 2023, 127, 16553 CrossRef CAS.
- C. Cerretani, J. Kondo and T. Vosch, RSC Adv., 2020, 10, 23854 RSC.
- C. Cerretani, G. Palm-Henriksen, M. B. Liisberg and T. Vosch, Chem. Sci., 2021, 12, 16100 RSC.
- J. Chen, A. Kumar, C. Cerretani, T. Vosch, D. Zigmantas and E. Thyrhaug, J. Phys. Chem. Lett., 2023, 14, 4078 CrossRef CAS PubMed.
- M. Kuisma, J. Ojanen, J. Enkovaara and T. T. Rantala, Phys. Rev. B: Condens. Matter Mater. Phys., 2010, 82, 115106 CrossRef.
- J. P. Perdew, K. Burke and M. Ernzerhof, Phys. Rev. Lett., 1996, 77, 3865 CrossRef CAS PubMed.
- (a) J. Enkovaara, et al. , J. Phys.: Condens. Matter, 2010, 22, 253202 CrossRef CAS PubMed; (b) J. J. Mortensen, et al. , J. Chem. Phys., 2024, 160 DOI:10.1063/5.0182685.
- A. V. Ivanov, G. Levi, E. Ö. Jonsson and H. Jonsson, J. Chem. Theory Comput., 2021, 17, 5034 CrossRef CAS PubMed.
Footnote |
| † Electronic supplementary information (ESI) available: Details of the computational method, Fig. S1 and S2, and optimized atomic structures of the S0, S1 and T1 states. See DOI: https://doi.org/10.1039/d3cc06085c |
| This journal is © The Royal Society of Chemistry 2024 |

