 Open Access Article
Modeling-aided coupling of catalysts, conditions, membranes, and reactors for efficient hydrogen production from ammonia†
Natalia
Realpe
 a,
Shekhar R.
Kulkarni
 a,
Jose L.
Cerrillo
 a,
Natalia
Morlanés
 a,
Gontzal
Lezcano
 a,
Sai P.
Katikaneni
 b,
Stephen N.
Paglieri
b,
Mohammad
Rakib
b,
Bandar
Solami
b,
Jorge
Gascon
b,
Stephen N.
Paglieri
b,
Mohammad
Rakib
b,
Bandar
Solami
b,
Jorge
Gascon
 ac and
Pedro
Castaño
 *ac
*ac
aKAUST Catalysis Center (KCC), King Abdullah University of Science and Technology (KAUST), Thuwal 23955-6900, Saudi Arabia. E-mail: pedro.castano@kaust.edu.sa
bCarbon Management R&D Division, Research and Development Center, Saudi Aramco, Dhahran 31311, Saudi Arabia
cChemical Engineering Program, Physical Science and Engineering (PSE) Division, King Abdullah University of Science and Technology, Saudi Arabia
First published on 2nd February 2023
Abstract
The production of high-purity, pressurized hydrogen from ammonia decomposition in a membrane catalytic reactor is a feasible technology. However, because of the multiple coupled parameters involved in the design of this technology, there are extensive opportunities for its intensification. We investigated the coupling between the type of catalyst, process conditions, type of membrane, and reactor operation (isothermal and non-isothermal) in the catalytic decomposition of ammonia. First, we developed an agnostic dimensionless model and calculated the kinetic parameters for a set of lab-made Ru- and Co-based catalysts and the permeation parameters of a Pd–Au membrane. The non-isothermal model for the Pd–Au membrane reactor was validated with the experiments using Co-based catalysts. Finally, we analyzed the coupling conditions based on the model predictions, results obtained in the literature and our experimental results, including several case studies. The thorough analysis led us to identify optimized combinations of catalyst–conditions–membrane–reactor that yield similar or improved results compared to the ones of Ru-based catalyst in a non-membrane reactor. Our results indicate that optimizing a single factor, such as the catalyst, may not lead to the desired outcome and a more holistic approach is necessary to produce pressurized and pure hydrogen efficiently.
1. Introduction
Hydrogen is assuming a leading role in the upcoming energy-fuel scenario owing to its emission-free combustion.1 However, it suffers from inherent transportation and storage challenges that limit the potential benefits of its widespread, large-scale implementation as a fuel.2 Hydrogen vectors or carriers do not require the transport or storage of large quantities of on-site hydrogen.3 These hydrogen-containing vectors can be organic or inorganic molecules that can be easily converted to pure hydrogen with ease and exhibit a minimal carbon footprint.4 Ammonia stands out compared to multiple hydrogen vectors primarily owing to its high volumetric-energetic density, low liquefaction pressure of ca. 8 bar, and a global production and distribution network.5–7Ammonia decomposition is an endothermic reaction that is thermodynamically favored at low pressures.8 However, pressurized hydrogen production is desirable to decrease costs and derived emissions of its post-production compression for its storage and transportation9 (ca. 6.0 kW h kg−1 for compression of H2 to 70 MPa, which leads to approximately 1.3 kg of CO2 kg−1 of H2).10 The energy analysis in our previous work11 allowed us to prove that the efficiency of the whole process (including the post-compression stage up to 350 bar) would drop from 77.7% to ∼68–73%, when hydrogen in the permeate is produced at 1–20 bar, respectively, thus highlighting the significance of developing reliable kinetic models at high pressure.
Many active phase–support combinations have been studied in the literature with Ru-based catalysts as the benchmark with remarkable activities at low temperatures.12,13 In addition, multiple non-noble metals, such as Fe, Co, and Ni, have been tested for this reaction,14–17 albeit displaying lower activities at low temperatures in contrast to Ru-based catalysts. In addition to the development of new catalysts, the use of a catalytic packed bed membrane reactor (denoted hereafter as a membrane reactor) has been proposed as an intensification route facilitating the production of high-yield and high-purity hydrogen.18–20 For a given catalyst, the comparison of the membrane reactor against the catalytic packed bed reactor (denoted hereafter as a non-membrane reactor) typically leads to improvements in the conversion and a relatively pure hydrogen stream.21
The modeling of membrane reactors is tackled by solving fundamental equations of mass balance, transport phenomena, and chemical kinetics in a standard shell-tube geometry.22–24 Hydrogen permeation via the membrane, driven by the pressure difference between the retentate and permeate sides, has been represented either as a linear pressure difference dependence21 or as the Sieverts–Fick law considering the permeation to be proportional to the difference of the square root of retentate and permeate pressures.25 Moreover, hydrogen permeance through the membrane is considered to be temperature-dependent and thereby expressed in the form of Arrhenius law.26–28 Pd-based materials have been extensively studied as hydrogen selective layers,29–40 although other additional novel materials have been reported, some of which have remarkable hydrogen permeances and selectivities.41–57 Most modeling studies are performed for the benchmark Ru-based catalysts, and the kinetics are often represented with the Temkin–Pyzhev model or modifications thereof on account of its simplicity or to express the decomposition kinetics mathematically, thus resulting in an expression with a positive order ammonia and a negative order hydrogen dependence of varying magnitudes.58–66 The hydrogen reaction order significantly varies from catalyst to catalyst in the range of −2.5 to −0.25; it is commonly regarded as negative. Thus, maintaining a low partial pressure of hydrogen is beneficial for reaction kinetics in the membrane reactor.
Two dimensionless numbers are used to identify the underlying governing mechanisms in the operation of membrane reactors, namely, the Damköhler (Da) and Peclet (Pe) numbers. Using these numbers allows the operation to be separated into several zones, each of which is defined by the associated limiting factors: kinetics, convection, and permeation. The relatively high endothermicity of ammonia decomposition poses challenges to the isothermal operation, particularly for larger reactors.22,67 In this non-isothermal scenario, the Stanton (St) number is employed to create a dimensionless assessment of the energy balance68 and measures how far the reactor operates from the isothermal condition.
Gómez-García et al.69 modeled an Fe-catalyzed membrane reactor (high-pressure retentate stream, atmospheric pressure on the permeate side, and with a sweep-gas) and identified four operation zones that are either kinetically or permeation controlled. Furthermore, they compared the relative improvements to equilibrium conversions under various operating conditions. Li et al.21 performed ammonia decomposition in a membrane reactor using a sweep gas through a concerted experimental and dimensionless simulation approach. Using Da and the permeation number (the equivalent of Pe), they demonstrated how hydrogen yields and purity could be tuned for silica-based and Pd-based membranes. The former includes permeation selectivities αNH3/H2 and αN2/H2, accounting for the slip of NH3 and N2 across the membrane, thereby reducing the purity of separated H2 for membranes with low selectivity.
Our study focuses on developing an agnostic model in terms of the catalyst, process conditions (temperatures between 350 and 600 °C and pressures from 1 bar to 20 bar), membrane properties, and reactor operation (membrane and non-membrane, or isothermal and non-isothermal) for identify coupling and intensification possibilities between these parameters for the decomposition of ammonia in a catalytic membrane reactor. To validate the developed model, we performed a number of experimental tests in (i) an isothermal catalytic packed-bed reactor using Ru–K/CaO and Co–Ba/CeO2 catalysts, (ii) a Pd–Au/Al2O3 membrane module without a catalyst, and (iii) a non-isothermal catalytic packed-bed membrane reactor with the same Co-based catalyst and membrane. This builds on our recently published promising results11 and expands to other experimental conditions, catalysts, and non-isothermal reactors. The data were used to estimate our lab-scale configuration's kinetic and permeation parameters and embed them within the model. Finally, we use the model and data published in the literature to establish the areas of optimization, coupling, and intensification. Accordingly, we discuss how this holistic model can be used.
2. Methodology
2.1 Reactor model statement
We consider the geometry and conditions of a shell-tube catalytic packed bed membrane reactor (Fig. 1) to derive the numerical model. The porous tube inside is covered by a selective layer allowing H2 permeation. The catalyst is placed in the shell side, thus forming a packed bed in the annular space. The feed enters at the top of the reactor, and the generated H2 permeates through the selective layer towards its center across the reactor length. Assuming a co-current operation of the reactor, permeated H2 exits at the bottom. The remaining gases (N2 and unreacted NH3, if any) flow down the catalytic bed (retentate side).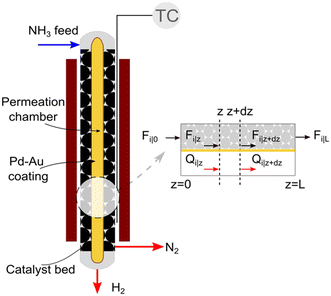 | ||
| Fig. 1 Schematic and sectional view of the catalytic packed bed membrane reactor used for ammonia decomposition. | ||
A pseudo-homogeneous one-dimensional mathematical model is chosen to describe the system, assuming that axial diffusion of mass and heat and radial concentration gradients on both sides are negligible. Based on the experimental observations, the kinetic control regime was proven due to the absence of external and internal mass and heat transfer limitations for all simulated operating conditions. The procedure used to prove that all experiments were obtained under kinetic control is described in the ESI† document of our previous work.70 Other assumptions of the model are: (i) steady-state operation, (ii) plug flow in both feed and permeate streams, (iii) co-current operation, (iv) no concentration polarization effect through the membrane, and (v) isothermal operation on the permeate side. Under these assumptions, the following material balance equations are obtained in the axial (z) direction for the three species involved:
 | (1) |
 | (2) |
 | (3) |
 | (4) |
 | (5) |
2.2 Kinetics of ammonia decomposition
In the literature, the Temkin–Pyzhev equation (eqn (6)) has been used to describe the ammonia decomposition reaction rate.58–65 This rate law represents a modification of a power law considering the effects of proximity to the equilibrium where nitrogen desorption is assumed as the rate-determining step. Note that the temperature dependence is expressed via the two-term Arrhenius equation. | (6) |
 | (7) |
 is estimated with the correlation in eqn (9), valid for the 673–1273 K range.73
 | (8) |
 | (9) |
2.3 Dimensionless model
To evaluate the reactor performance in a wide range of operational conditions unconstrained by the reactor dimensions, a non-dimensional analysis of the mass, energy, and momentum balances was performed. This dimensional model is used to assess the system behavior via dimensionless variables and numbers summarized in Table 1.Four dimensionless numbers are defined: the (i) Damköhler number (Da), comparing the rate of reaction with the rate of convective mass transfer. Da can be increased by increasing the space–time via either a high catalyst load or a low NH3 feed flow; (ii) third Damköhler number (DaIII), defined as the ratio of the heat absorbed in the reaction to the convective rate of heat supplied by the feed; (iii) Peclet number (Pe), indicating the correlation between the convective and diffusive mass transports in the catalytic bed. A low Pe represents faster H2 permeation across the membrane, achieved by decreasing NH3 molar flow or increasing the driving force or the membrane area; and (iv) Stanton number (St) defined as the ratio between the heat externally transferred to the gaseous reaction medium and the energy content of the reaction medium. Higher St values indicate closeness to the isothermal operation. Dimensionless forms of eqn (1)–(5) are obtained incorporating eqn (10)–(21).
Equations reported in Table 2 were simultaneously solved using inbuilt MATLAB solvers. Stiffness while integrating the initial reaction rates at small lengths arises from the negative H2 reaction order (absent in the feed). Therefore, an infinitesimal concentration of H2 (ca. 10−16) was defined in the feed for the simulation studies.21 The same approach was followed in determining the initial conditions for the permeate side wherein a small amount of an external inert component was assumed. Fractional NH3 conversion and H2 recovery are defined as follows:
 | (30) |
 | (31) |
2.4 Experiments and fitting
In our previous studies, we investigated the ammonia decomposition reaction with two catalysts, Ru–K/CaO and Co–Ba/CeO2.11,70,74 The Co-based catalyst with 80/20 molar Co/Ce ratio was synthesized by the co-precipitation method, followed by the addition of Ba (0.5 wt% Ba) as a promoter using the incipient wetness impregnation method. Ru–K/CaO was prepared using the impregnation method, followed by a pyrolysis step and final incorporation of potassium using the same method (10 wt% K). More details about synthesis, optimization and characterization of both catalysts can be found in our previous studies.70,74 Herein, we expanded the experimental database of both catalysts with additional experiments classified into three sets:i. In an isothermal catalytic packed-bed reactor (Fig. S1 and S2†) using Ru–K/CaO or Co–Ba/CeO2 catalysts, to obtain a dataset of 95 experimental data points for each catalyst under the following conditions: temperatures from 250 to 550 °C, pressures from 1 to 40 bar, space times from 0.2 to 6 gcat h mol−1, partial pressures of NH3 from 0.05 to 1 bar, and partial pressures of H2 from 0 to 0.75 bar. The aim is to use the obtained XNH3 to estimate k0, Ea, a, and b for each catalyst.
ii. In an isothermal membrane reactor module (Fig. S3†) using a Pd–Au/Al2O3 membrane, without a catalyst, to obtain a dataset of 55 experimental data points for different operating temperatures (350–500 °C), inlet flow rates (100–4000 N mL min−1), and feed pressures (4–9 bar). The aim is to use RH2 to estimate J0 and Ea,J.
iii. In a non-isothermal catalytic packed-bed membrane reactor (Fig. S4†) using the Co–Ba/CeO2 catalyst, to obtain a dataset of 56 experimental data points under the following conditions: temperatures from 250 to 500 °C, space times from 2.6 to 40 gcat h mol−1, and feed pressures from 4 to 16 bar.
Parameters estimated with sets (i) and (ii) were incorporated in the mass balances (eqn (22) and (23)) and solved together with the energy balance to match experimental XNH3 and RH2, thus estimating the empirical heat transfer coefficient U of the lab-scale setup (set (iii)). Tw measurements were obtained at five points along the reactor for each experiment (Fig. S5†). A parabolic correlation (eqn (32)) was reported to determine the temperature profile along the reactor wall, in addition to a correlation (eqn (33)) to predict the inlet reactor temperature from the setpoint value (TwSP). Hence, unless the T0/Tw ratio is specified, eqn (32) and (33) determine T0 and Tw from TwSP.
| Tw = −100.57z2 + 95.77z + TwSP − 22 | (32) |
| T0 = 0.9TwSP + 28 | (33) |
Insights into the characteristics of experimental reactors used for new data acquisition of each set are available in the ESI.† Parameter estimation for each fitting set was achieved with the fminsearch function of MATLAB, employed to determine the minimum of unconstrained multivariable systems using a derivative-free method. The sum of the squared residuals (SSR) of the experimental data and predicted values (i.e., target variables like XNH3 and RH2) was set as the objective function to minimize (eqn (34)). The 95% confidence intervals for nonlinear least squares parameter estimates were reported using the nlparci MATLAB function given the residuals and the Jacobian matrix at the solution. Error variance was computed from the SSR as per eqn (35).
 | (34) |
 | (35) |
3. Results and discussion
3.1 Agnostic model results
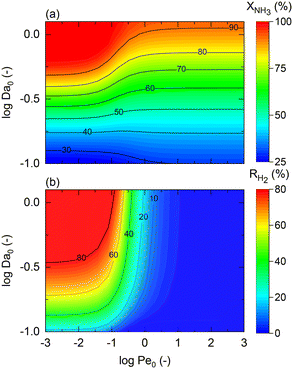
The model developed up to section 2.3, which is agnostic in terms of catalyst, conditions, and membrane, is used to identify the regimes of potential coupling possibilities based on the understanding of which phenomena governs different operation regions. For this purpose, we investigate the influence of dimensionless numbers (Da, Pe, St) on the process performance, determined by XNH3 and RH2.Fig. 2 shows contour plots of NH3 conversion and H2 recovery for a representative catalyst, a = 0.5 and b = −0.75, using different Da and Pe values assuming a highly selective membrane to H2 (αH2/NH3 = 105; αH2/N2 = 105) operating at isothermal conditions. Fig. 2(a) can be divided into three regions: (i) the region comprising high Pe values (Pe > 100) where NH3 conversion is independent of Pe, and the maximum conversion achieved is slightly >90%; (ii) the region bounded by 10−2 < Pe < 100 where the effect of the Pe is most noticeable and conversion of 100% is possible; and (iii) the region with Pe < 10−2 where conversion is practically unaffected by the Pe and Da values. For all regions identified in Fig. 2, the Da value positively affects the NH3 conversion. Based on its definition, the Da number (Table 1) can be increased in many ways, e.g., by increasing the catalyst activity (temperature, pressure, and type of catalyst) or amount of catalyst (or space–time). The primary difference between region (i) and the other two is that the convective flow is higher than the permeation term. This region is not affected by Pe numbers because of the high convective flow, poor performance of the membrane, or its absence, thus approaching the behavior of a conventional packed bed (non-membrane) reactor. Therefore, maximum conversion in this region is limited by thermodynamic equilibrium. In region (iii), the effect of Pe on NH3 conversion is insignificant because of the limited membrane performance enhancement restricted by the maximum achievable driving force (i.e., H2 partial pressure in the catalytic bed) for permeation. In this region, the reactor performance is strictly controlled by reaction kinetics over permeation. Unlike other regions, in region (ii), conversion can be effectively tuned by modifying Da or Pe, the latter by increasing operating temperature, feed pressure, membrane area, or working with a more permeable material. For this study, this region represents an intensified area of interest. Therefore, these values of Pe and Da are used as a reference for upcoming simulations. The same regions are observed in Fig. 2(b). H2 recovery is null for region (i) as it is only significant for cases where the H2 diffusive flux is significantly higher than the convective one. As for region (ii), H2 recovery is considerably influenced by a change in Pe, thus representing a regime controlled by the membrane characteristics. Region (iii) is affected only by the kinetics. These remarks agree with the previous observations.
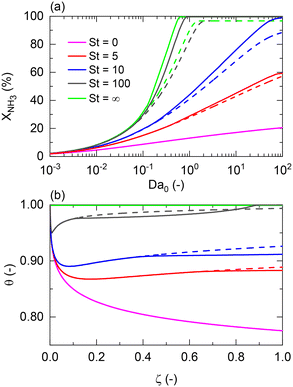
For non-isothermal conditions, we examined the effects of different degrees of isothermal character on the reactor by assuming different values of St for Pe0 = 0.05 (membrane reactor) and Pe0 = 500 (non-membrane reactor), Tw/T0 = 1, and activation energies of 100 and 25 kJ mol−1 for a representative catalyst and membrane, respectively. Because certain dimensionless numbers vary along the reactor (e.g., Da with non-isothermal operation), the subscript 0 (e.g., Da0) is used to indicate its values at the reactor inlet. Fig. 3(a) shows that there is a maximum difference of 87% between the membrane reactor conversion at St = 0 (adiabatic) and St = ∞ (isothermal) at Da0 ≈ 1. This Da value is the minimum value required to achieve complete conversion in an isothermal membrane reactor. At extremely low Da values (Da0 < 10−2), conversions are limited, thus making the effect of St negligible. Fig. 3 shows that St = 100 is close to isothermal operation for the entire Da range. At a sufficiently high Da, the closer the operation is to an isothermal reaction, the larger the difference is between the conversion achieved in both reactors.
Furthermore, Fig. 3(a) shows that a membrane reactor not only can go beyond the intrinsic thermodynamic limitations of the reaction, but it also performs better than the non-membrane reactor under less isothermal scenarios (low-St operation). For values of St < 100, the Da requirements for achieving high NH3 conversion exponentially increase. At Da0 < 0.1, all curves demonstrate the same conversion for the membrane reactor and the packed bed reactor. Fig. 3(b) shows dimensionless temperature profiles for Da0 = 1 and shows the similarity between St = 100 and the isothermal operation, where the feed temperature can be restored after the initial drop characteristic of endothermicity in this reaction. However, the initial temperature drop at lower St is more significant and cannot be neglected. Higher temperature drops in the membrane reactor compared to the non-membrane reactor are explained by higher heat consumption of the reaction (higher conversion) and heat loss of hydrogen permeating to the other side of the membrane.
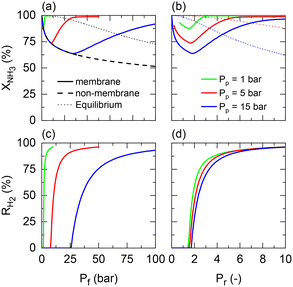
Returning to the isothermal membrane reactor conditions, pressurized H2 production is explored by comparing the performance of a membrane reactor at different permeate pressures as a function of the feed and pressure ratio (Fig. 4). Fig. 4(a) shows the expected adverse effect of pressure for both the non-membrane reactor (dashed line) and equilibrium (dotted line) conversions. Feed pressure negatively affects the thermodynamic equilibrium and kinetics. These effects are superposed by the positive impact on H2 permeation by increasing the driving force across the membrane, enhancing the net ammonia decomposition rate. However, there is a tradeoff between the desired permeate pressure and feed pressure required to obtain complete NH3 conversion (Fig. 4(a)). For example, a 3 bar feed pressure is required to completely convert NH3 to yield pure H2 at 1 bar on the permeate side, whereas if an H2 product pressure of 15 bar is desired, all of the feedstock cannot be converted even at 100 bar.
When representing the former in terms of the pressure ratio rather than feed pressure (Fig. 4(b)), we observe that the pressure ratio required to reach 100% conversion becomes increasingly higher with the permeate pressure. Therefore, as per the model, high-pressure H2 production with complete feedstock conversion becomes asymptotically more pressure demanding as the desired product pressure increases up to the point where 15 bar H2 production would require a feed pressure of >150 bar. However, this seems not to be the case with the pressure ratio (ca. Pr = 1.5–2) required to overcome the non-membrane reactor performance, which is approximately Pr = 2 irrespective of the permeate pressure, and therefore setting the minimum pressure ratio for a membrane reactor. Fig. 4(c) and (d) show the same effect on H2 recovery. The similarity between the impact of different permeate pressures on H2 recovery determines that the minimum pressure ratio to achieve maximum recovery is ∼Pr = 6, virtually independent of permeate pressure. These observations agree with the experimental results reported in our previous study.11 The potential areas for the performance improvement are summarized in Table 3. Note that the values identified for Da correspond to the entire evaluated range in Fig. 2, indicating that tunning Da allows achieving any target conversion for a specific membrane reactor configuration.
| Dimensionless number/parameter | Criterion | Value |
|---|---|---|
| Pe | Potential area for coupling | 10−2 < Pe < 100 |
| Da | Tune reactor performance under specific conditions | 10−1 < Da < 100 |
| St | Avoid severe axial temperature gradients | St > 100 |
| P r | Overcome non-membrane reactor performance | P r > 2 |
In all previous simulations, the dimensionless form of the momentum balance (eqn (25)) was used to compute the pressure drop along the catalytic bed. None of the simulated conditions exhibited significant pressure drop values (<1%). Hence, the pressure drop can be considered negligible for all operating Da, Pe, and St ranges addressed in this study. Hence, additional references to the pressure drop are omitted when discussing these operating conditions. To support this observation, pressure drop estimations are shown in Fig. S6,† even for the most severe scenarios (i.e., 1000 N mL min−1 NH3 in the feed).
3.2 Parameter estimation
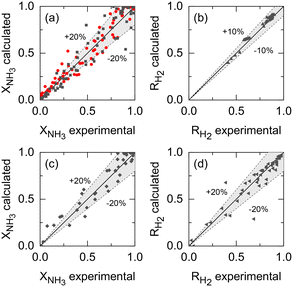
Kinetic parameters of Ru–K/CaO and Co–Ba/CeO2 catalysts (set i), Pd–Au/Al2O3 membrane parameters (set ii), and the membrane reactor heat transfer coefficient (set iii) were estimated based on the previously described extended experimental sets. Fig. 5 shows the parity plots comparing the experimental and calculated target variables for all experimental conditions and parameter sets: (a) the kinetic model for the Ru–K/CaO and Co–Ba/CeO2 catalysts developed with experimental set (i), using NH3 conversion as a fitting parameter; (b) the permeation model of the Pd–Au/Al2O3 membrane using experimental data from set (ii) with H2 recovery as a fitting parameter; and (c) and (d) the non-isothermal membrane reactor model, experimental set (iii), using both NH3 conversion and H2 recovery, respectively. Because of the relatively good fitting of all models, we claim that the set of assumptions is adequate for this system, i.e., eqn (7) is a reliable kinetic model for the ammonia decomposition kinetics in the evaluated ranges of operational conditions for both catalysts and eqn (3) is adequate for modeling the H2 permeation and the diabatic thermal regime is well represented by a curved wall temperature profile. The statistics for the estimated parameters in Table 4 likewise demonstrate the reliability of the fitting procedure.| Parameter set i | ||
|---|---|---|
| Catalyst | Ru–K/CaO | Co–Ba/CeO2 |
| k 0 (mol g−1 h−1) | (6.27 ± 0.01) × 1011 | (3.33 ± 0.29) × 1010 |
| E a (kJ mol−1) | 166.4 ± 0.1 | 154.1 ± 3.2 |
| a | 0.47 ± 0.00 | 0.37 ± 0.02 |
| b | −1.42 ± 0.00 | −1.04 ± 0.02 |
| r 2 | 0.968 | 0.984 |
| σ 2 | 0.096 | 0.070 |
| Parameter set ii | |
|---|---|
| J 0 (mol m−2 s−1 Pa−n) | (7.85 ± 0.11) × 10−5 |
| E a,J (kJ mol−1) | 6.7 ± 1.6 |
| n | 0.5 |
| α H2/N2 | ∞ |
| α H2/NH3 | ∞ |
| r 2 | 0.991 |
| σ 2 | 0.040 |
| Parameter set iii | |
|---|---|
| U (W m−2 K−1) | 244 ± 53 |
| r 2 | 0.945 |
| σ 2 | 0.057 |
Table 4 summarizes the estimated parameters for different experimental datasets. The modified Temkin–Pyzhev parameters obtained for Ru–K/CaO and Co–Ba/CeO2 catalysts show substantial differences, with the former showing faster overall kinetics with larger NH3 and smaller H2 reaction orders. The lower Ea value estimated for the Co–Ba/CeO2 catalyst indicates that the kinetic constant is less affected by the temperature than the Ru–K/CaO catalyst. However, the fact that the pre-exponential factor of Ru–K/CaO is one order of magnitude larger than that of Co–Ba/CeO2 agrees with the a priori expected higher activity of the former. The following section provides a full assessment of the estimated reaction orders and activation energies in the context of the previously reported values.
As per the membrane parameters, the fitted JH2,0 and Ea,J values lie within the range expected for H2 selective Pd membranes, as shown in section 3.3. The estimated H2 permeation order is in the lower limit of the acceptable values (n = 0.5). Because only H2 was detected at the permeate side in permeation-exclusive experiments (set (ii)) and membrane reactor experiments (set (iii)), αH2/N2 and αH2/NH3 were set to ∞. Furthermore, experimental Pe0 (0.03–0.61) and Da0 (0–20) are within the ranges defined in Table 3, indicating that the fitted parameters are suitable for the reactor–catalyst coupling study presented in the following sections. The value of the overall heat transfer coefficient at the wall, along with the dimensions of the reactor, corresponds to experimental values of 300 < St0 < 1600, which based on our previous discussion, are sufficiently high values (St > 100) to rule out significant heat-related limitations. These high values of St arise not only from the estimated value of U, which is within the expected range based on the literature,75–77 but also due to the annular geometry of the reactor.
3.3 Effect of model parameters
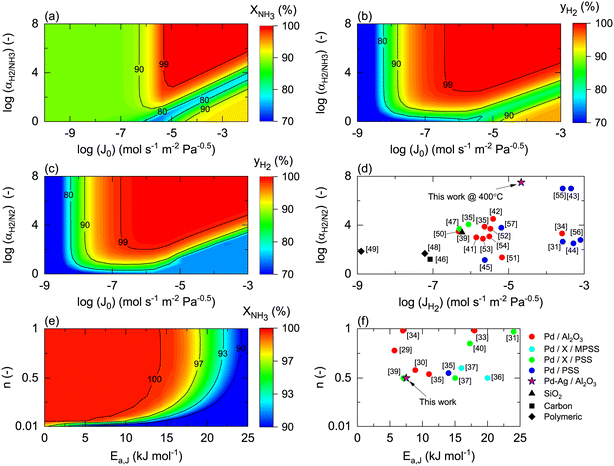
Once the model is fitted to our experimental results, it can be used (along with other experimental results available in the literature) to confirm the realistic coupling regions of the membrane reactor. Considering the effect of membrane properties, in Fig. 6(a) and (b), the impact of H2/NH3 membrane selectivity is shown for a wide range of H2 permeances, representing a region 5 × 10⁻³ < Pe < 5 × 10³. Herein, the results show that NH3 conversion for JH2 < 10−7 mol s−1 m2 Pa0.5 is <90% and independent of αH2/NH3, which for the FNH3,0/Am ratio and selected Pr represents Pe > 100, indicating that the H2 permeation flux is not sufficient to overcome non-membrane reactor performance. For higher JH2 values and low H2/NH3 selectivity (αH2/NH3 < 102), NH3 conversion (based on eqn (30)) can be lower than that obtained in a non-membrane reactor because of NH3 permeation. With the values of JH2 > 10−5 mol s−1 m−2 Pa−0.5 and αH2/NH3 > 103, the complete conversion of ammonia can be achieved in the reactor. Minimum αH2/NH3 requirements to achieve H2 purity higher than 99.9% are very similar. For most lab-scale studies reported for ammonia decomposition in a Pd-coated membrane reactor, αH2/NH3 is not reported because no NH3 is detected in the permeate side,22,24,25,78 indicating that although there is a minimum requirement of αH2/NH3 on the order of 103, in most of the reported cases this value is easily achieved for common H2 permselective materials. This is the case of the membrane studied in this work, for which pure H2 is obtained in the permeate in all experiments.Fig. 6(c) shows the effect of H2/N2 membrane selectivity on H2 purity. The most significant difference between Fig. 6(b) and (c) is the area bounded by JH2 > 105 mol s−1 m−2 Pa−0.5 and αH2/N2 < 102, where H2/N2 membrane selectivity has a more significant impact on H2 purity. In this region, permeance for NH3 and N2 is the same; however, as NH3 is converted along the axial position of the reactor, the partial pressure of the former decreases as opposed to the latter, directly affecting the permeation flux. Because of the N2 flux increases with NH3 conversion, H2/N2 membrane selectivity has a more significant effect on H2 purity than αH2/NH3. Fig. 6(d) shows the reported values of JH2 and αH2/N2 for H2 selective materials tested in membranes. As per the model, most Pd/Al2O3 membranes are expected to yield a pure permeate. However, when using supports for Pd that endow extremely high H2 permeation rates (e.g., PSS), the selectivity is compromised, and consequently so is H2 purity. The latter highlights the benefits of selecting membranes like Pd/Al2O3 that exhibit an excellent JH2–αH2/N2 balance. The estimated value of JH2 at 400 °C for the Pd–Au/Al2O3 membrane used in this study (Table 4) is coherent with the values obtained for most Pd/Al2O3 membranes and others that are exclusively selective to H2. Furthermore, considering values of αH2/NH3 and αH2/N2 on the order of 103, for a JH2 on the order of 10−5 as representative of an acceptable membrane performance for the simulation conditions, only Pd-based membranes meet the requirements. In the simulations, the effect of αH2/N2 on NH3 conversion was reported to be negligible and is not shown in Fig. 6.
Fig. 6(e) and (f) show the effects of the membrane permeation order, activation energy, and experimental values. Several reported H2 selective materials follow Sieverts–Fick's law (n = 0.5), indicating that the limiting step of H2 transport across the membrane is the diffusion in the film. However, other studies report deviations from this law (n > 0.5), indicating that the limiting step is the dissociation in the film or the transport across the porous support.79 Based on the experimental data gathered in Fig. 6(f), a direct correlation between the membrane support and value of n seems to be missing, highlighting that other factors in addition to the layer material and support (e.g., preparation method) certainly play a role. Under the simulated conditions, n does significantly contribute to the final performance. The activation energy has a more significant impact with a reduction of NH3 conversion of 10% when Ea,J increases from 10 to 25 kJ mol−1. However, the Ea,J value estimated in this work (6.7 kJ mol−1) is similar to the Pd/Al2O3 membranes in Fig. 6(f), which indicates that their performance is not highly influenced by the temperature. When the pre-exponential factor for permeance is sufficiently high, low activation energy membranes are preferred over higher ones as cold spot formation cannot be avoided nearby the reactor inlet where the reaction rates are the highest.
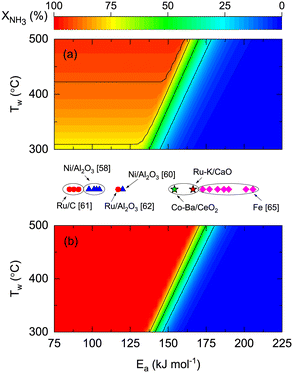
To explore the effect of catalyst kinetics on both reactor performances, the effects of activation energy (Fig. 7) and reaction orders (Fig. 8) were analyzed. In this simulation, we assumed the same pre-exponential constant (k0 = 1011 mol h−1 gcat−1) provided that a one-to-one comparison of the values reported in the literature is challenging because different authors define the rate constant based on other terms. However, considering our results of Ru- and Co-based catalysts, there is one order of magnitude difference between them (Table 4). This indicates that the effect of the pre-exponential constant must not be decoupled from the analysis in Fig. 7. The theoretical impact of k0 and Ea shown in Fig. S7† is as expected, namely, higher k0 values allow complete conversions even if Ea is high. Despite the latter, the simulations and experimental results in Fig. 7 enable the comparison between different catalytic systems on the same basis and assess the impact of catalyst activity (Ea) on the reactor performance and wall temperature. In this manner, Fig. 7 shows that NH3 conversion is less dependent on reactor wall temperature for a membrane reactor than for a non-membrane reactor. The activation energy band dividing the reactive zone from the inactive area for a non-membrane reactor (125 < Ea < 175 kJ mol−1) is narrower and displaced to the right for the membrane reactor (137 < Ea < 185 kJ mol−1), similar to what is observed in Fig. S7.† The simulations predict that for the assumed k0, Co–Ba/CeO2 catalysts with Ea = 154 kJ mol−1 (Table 4) achieve complete NH3 conversion at Tw > 420 °C in a membrane reactor; however, conversion in a non-membrane reactor using the same catalyst will not achieve complete conversion even at Tw = 500 °C. The role of Ea is highlighted with Fe-based catalysts, known to require higher temperatures along with higher Ea values.
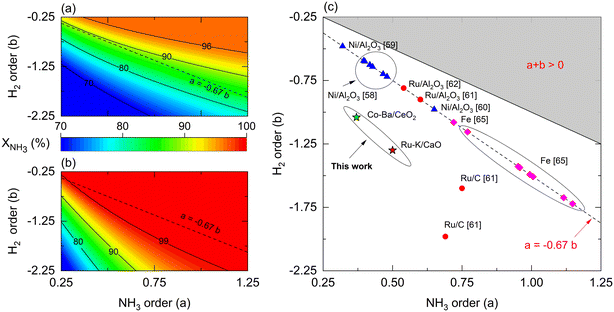
Reaction orders play a central role in the selection of coupling strategies. In Fig. 8, we explore the effect of parameters a and b on the performance of a non-membrane and membrane reactor assuming Ea = 100 kJ mol−1. Using a membrane reactor decreases the effect of b on NH3 conversion, thus allowing catalysts with lower H2 reaction orders to reach higher conversion. In Fig. 8(a), the slope of the contour lines is similar to the one formed by the reported parameters (Fig. 8(c)), indicating a correlation between the a/b ratios and performance. However, this effect changes in a membrane reactor where catalysts with the same a/b ratios belong to a broader spectrum of interpretations. These observations, in addition to the remarks made in Fig. 7, highlight the impact of kinetic parameters on membrane reactor performances, indicating that the intrinsic activity of the catalyst is less significant. For most catalysts shown in Fig. 8(c), β values in the Temkin–Pyzhev model (eqn (6)) are represented by the a = −0.67·b line. Fe-based catalysts possess higher NH3 and lower H2 reaction orders than the Ni-based catalysts. The reaction orders previously estimated in Table 4 do not fall in the line, a = −0.67·b, as the parameters were obtained independently according to eqn (7). Furthermore, according to the values of a and b reported in the literature, the choice of a rate law that independently treats both orders yield lower values compared to the Temkin–Pyzhev law.
However, a and b must not be understood as sole indicators of intrinsic catalyst activity, as the estimation order affects the pre-exponential factor estimation. The latter is exemplified with Ru- and Co-based catalysts of this study, where Co–Ba/CeO2 has higher reaction orders. Nevertheless, its estimated pre-exponential factor value is an order of magnitude lower than that of Ru–K/CaO.
3.4 Assessment of coupling opportunities
Previous studies discussed the benefits of using membrane reactors over packed bed reactors for ammonia decomposition due to the enhanced reaction rates and thermodynamics resulting from the selective removal of H2 from the catalytic bed.22,25,80 In this section, the developed and validated model is used as a tool to harness other less-common effects in non-isothermal membrane reactors. This approach enables defining high-performance opportunity windows for catalysts that are moderately active for ammonia decomposition. This is the case of the Co–Ba/CeO2 catalyst in this study, compared to the benchmark Ru–K/CaO. To explore the potential applicability of the Co–Ba/CeO2 catalyst, NH3 conversions for four catalyst/reactor combinations (Table 5) are compared based on the catalysts and reactors used in the experimentation. This analysis is performed for specific operating conditions (temperature, space–time) based on the parameters estimated in section 2.4.| Pair no. | Reactor | Catalyst |
|---|---|---|
| 1 | Non-membrane | Ru–K/CaO |
| 2 | Non-membrane | Co–Ba/CeO2 |
| 3 | Membrane | Ru–K/CaO |
| 4 | Membrane | Co–Ba/CeO2 |
When comparing the performance of the catalyst/reactor couples listed in Table 5, the improvement in NH3 conversion (ΔXNH3) is the largest when comparing case 3 vs. 1 in Fig. 9(a). This observation was not only expected due to the higher intrinsic activity (expressed as higher k0) of the catalyst, but also for the buffering role of the membrane reactor on the H2 reaction order in the rate law, in line with the conclusion drawn from Fig. 8. The same reasons apply to the enhancement behavior provided by a couple of cases 4 vs. 2, to a lesser extent expressed as a narrower maximum enhancement window in Fig. 9(b), explained by the more reduced activity followed by a higher H2 reaction order. Nonetheless, it must be noted that a 50% enhancement can be achieved in both comparisons (and hence due to the membrane reactor). The temperature dependence of the NH3 conversion improvement in both analyses similarly can be directly related to the estimated Ea values for each catalyst. When assessing the effect of the catalyst in a membrane reactor (Fig. 9(c)), similar conversions can be obtained (ΔXNH3 ∼ 0) over a wide range of W/F0 and Tw values, and overall, under more severe conditions with higher NH3 conversions.
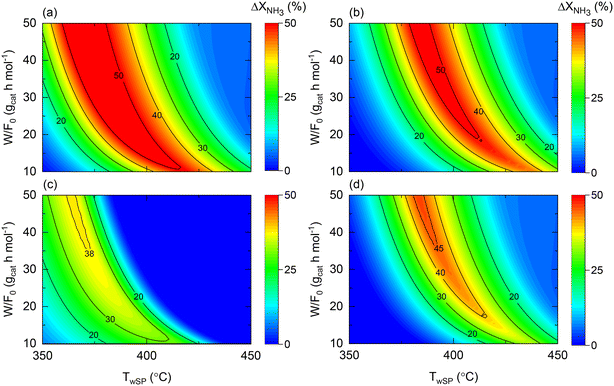 | ||
| Fig. 9 Contour plots comparing NH3 conversion enhancement as a function of space–time (W/F0) and wall setpoint temperature (TwSP) for cases (a) 3 vs. 1; (b) 4 vs. 2; (c) 3 vs. 4; and (d) 4 vs. 1. Simulation conditions: estimated kinetic, membrane, and heat transfer parameters (Table 4) and W = 20 gcat; Pr = 10; Pp = 1 bar. | ||
Nonetheless, compared to the performance of both catalysts in a non-membrane reactor (e.g., Fig. S1(b) and S2(b)†), the utilization of a membrane reactor has a shrinking effect on the conditions requiring exact conversions, suggesting that catalyst activity plays a less crucial role when working with a membrane reactor. This argument is explicitly exemplified in Fig. 9(d), wherein remarkable conversion enhancements up to ca. 45% can be attained with a Co-based catalyst in a membrane reactor, if careful tuning of the operating conditions is performed. Previous observations reveal that the reactor type can change the catalyst comparison criteria and background. Notably, Fig. 9 results correspond to the following dimensionless number ranges: 0.01 < Da0 < 0.5; 0.03 < Pe0 < 0.15; 130 < St0 < 700.
The role of the wall temperature gradient on the membrane and non-membrane reactor performance is illustrated in Fig. 10, which shows the conversion difference between a constant wall temperature and the experimentally observed profile for both reactors. The wall temperature profile experimentally observed for the membrane reactor is assumed for the non-membrane counterpart as reactors with comparable dimensions and furnaces are considered. In the case of the non-membrane reactor (Fig. 10(a)), NH3 conversion can decrease up to 8% due to the wall-temperature effect, whereas for the membrane reactor, this effect results in a maximal 4% performance drop. This observation is in agreement with the previous insights provided by the model, suggesting that the membrane reactor can buffer temperature-related deviations from ideality. Although other important aspects related to heat transfer are not included in the model (e.g., radial gradients), the model proposed in the present study successfully identifies and quantifies the effect of heat-transfer limitations. This is the case of the experimentally observed wall temperature profile, where process variables and the impact of the perturbations are measurable with confidence. In a larger-scale reactor, the role of such effects will be significantly more pronounced, calling for more detailed heterogeneous models that can account for them. Fig. 10 results correspond to the following dimensionless number ranges: 0 < Da0 < 7; 0.05 < Pe0 < 0.08; 240 < St0 < 260.
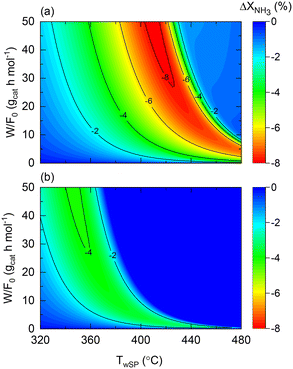 | ||
| Fig. 10 Contour plots of NH3 conversion loss using Co–Ba/CeO2 with variable wall temperature compared to constant wall temperature (T0/Tw = 1) in terms of wall temperature setpoint and space–time for (a) non-membrane reactor and (b) membrane reactor. Simulation conditions: estimated kinetics, membrane reactor, heat transfer parameters (Table 4), and FNH3,0 = 1 N mL min−1; Pr = 10; Pp = 1 bar. | ||
As shown in Fig. 4, the theoretical pressure ratio defines the required pressure feed to achieve complete NH3 conversion at high permeate pressures. However, in practice, regardless of the scale of operation, membrane reactors can encounter restrictions that constrain the required pressured ratios for the production of pressurized H2 from NH3. That is the case of the maximum allowed transmembrane differential pressure, which in the case of the commercial Pd–Au/Al2O3 membrane used in this study is set to Pf − Pp < 30 bar by the manufacturer. For example, when targeting a permeate pressure of 15 bar, the maximum allowable operating pressure ratio is three. This active restriction induces change in other operating conditions to obtain the desired NH3 conversion. Fig. 11 shows predictions for (a) NH3 conversion and (b) H2 recovery considering the transmembrane differential pressure constraint. The maximum achievable NH3 conversion decreases as the permeate pressure increases due to the maximum applied driving force limitation.
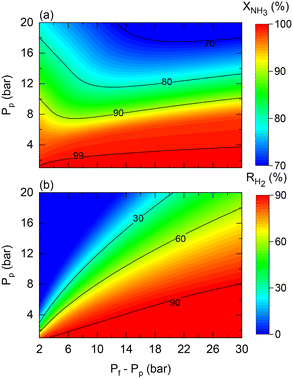 | ||
| Fig. 11 Contour plots of membrane reactor performance using Co–Ba/CeO2 as a function of permeate (Pp) and transmembrane differential pressure (Pf − Pp) in terms of (a) NH3 conversion and (b) H2 recovery. Simulation conditions: estimated kinetic, membrane, and heat transfer parameters (Table 4) and TwSP = 450 °C; W = 20 gcat; W/F0 = 22 gcat h mol−1. | ||
The fact that the pressure difference is limited (hence, working with pressure ratios to a greater extent) implies that obtaining complete NH3 conversion at higher permeate pressures becomes increasingly complex under high permeate pressure, thus requiring tuning of other operating conditions such as the temperature or space–time. For example, the reaction temperature must be increased if the resulting H2 has to be pressurized. In this case, for a target H2 pressure of 15 bar using the Co–Ba/CeO2 catalyst under the conditions shown in Fig. 11, by raising the reaction temperature from 450 to 500 °C, NH3 conversion and H2 recovery are predicted to increase from 76% to 97% and 70% to 82%, respectively. Fig. 11 shows the results corresponding to the following dimensionless number ranges: 0.07 < Da0 < 0.9; 0.02 < Pe0 < 0.2; St0 = 300.
4. Conclusions
We identified coupling opportunities for ammonia decomposition in a membrane reactor using modeling, experimental, and literature-review approaches. First, we developed a dimensionless model to explore the effects of different operating conditions, the impact of the reactor's isothermal or non-isothermal condition on the overall performance, and the implications of aiming for a high pressure and pure hydrogen product. Second, we fit the kinetic parameters for the in-house produced Ru–K/CaO and Co–Ba/CeO2 catalysts and the permeance parameters of our commercial Pd–Au/Al2O3 membrane module. Finally, the developed model enables us to identify opportunities for different catalysts, membranes, and operation condition combinations where the reactor can lead to similar or improved results.With the agnostic model, a representative catalyst (a = 0.5, b = −0.75, Ea = kJ mol−1), and a highly H2 selective membrane (αH2/NH3 = 105; αH2/N2 = 105), we found that NH3 conversion enhancements can be achieved at the region bounded by 10−2 < Pe < 100; 10−1 < Da < 100 with St > 100 and Pr > 2. Under these operating conditions, experiments for fitting and parameter estimation were performed, and the values obtained agree with ammonia decomposition kinetics in the literature. Using a thorough parametric study of the kinetics, the buffering role of the membrane reactor in the influence of specific kinetic variables (e.g., reaction orders and activation energy) on the final performance could be identified. In this context, the catalyst with higher intrinsic activity (Ru–K/CaO), expressed as higher k0, has the highest ammonia conversion enhancement between a non-membrane and a membrane reactor. Nonetheless, model predictions for the Co–Ba/CeO2 catalyst, which has lower intrinsic activity but is cost-effective, led to operating areas where enhancements of up to 50% were achievable with a membrane reactor (compared to a non-membrane). The latter reveals that using a membrane reactor alters the paradigm of catalyst design, as enhancements up to ca. 40% can be achieved with the Co-based catalyst compared to the Ru-based catalyst in a non-membrane reactor.
Our study provides solid arguments for employing the single-step ammonia decomposition process in a membrane reactor using a moderate activity catalyst, while making further strides towards scaling up the technology and obtaining high pressure, high-purity COx-free H2.
Nomenclature
| a | Reaction order for NH3, dimensionless |
| A c | Cross-sectional area of the annular space, m2 |
| A m | Superficial area of the membrane, m2 |
| A s | Reactor-oven contact surface, m2 |
| b | Reaction order for H2, dimensionless |
| C p,i | Heat capacity of component i, J mol−1 k−1 |
| Ĉ p,i | Dimensionless heat capacity of component i |
| C p,NH3,0 | Heat capacity of NH3 in the feed, J mol−1 k−1 |
| Da | Damköhler number |
| DaIII | Third Damköhler number |
| d p | Average catalyst particle diameter, μm |
| E a | Activation energy for ammonia decomposition reaction, kJ mol−1 |
| E a,J | Activation energy for H2 permeance, kJ mol−1 |
| f H2,L | Dimensionless molar flow rate of H2 at the outlet of the catalytic bed |
| f i | Dimensionless molar flow rate in the catalytic bed of component i |
| F i | Molar flow rate in the catalytic bed of component i, mol s−1 |
| f NH3,0 | Dimensionless molar flow rate of NH3 in the feed |
| F NH3,0 | Molar flow rate of NH3 in the feed, mol s−1 |
| f NH3,L | Dimensionless molar flow rate of NH3 at the outlet of the catalytic bed |
| G | Superficial mass velocity of the gas, kg m−2 s−1 |
| J i | Permeance of component i, mol s−1 m−2 Pa−n |
| J i,0 | Pre-exponential factor for permeance of component i, mol s−1 m−2 Pa−n |
| k 0 | Pre-exponential factor for ammonia decomposition reaction, mol gcat−1 s−1 bar−(a+b) |
| K eq | Thermodynamic equilibrium constant, dimensionless |
| L | Total reactor length, m |
| n | Permeation order, dimensionless |
| N | Total number of experiments |
| N s | Total number of species |
| P | Total pressure in the catalytic bed, bar |
![[P with combining circumflex]](https://www.rsc.org/images/entities/i_char_0050_0302.gif)
| Dimensionless total pressure in the catalytic bed |
| P° | Standard pressure, bar |
| Pe | Peclet number |
| P f | Total pressure in the feed, bar |
| p i | Partial pressure of component i, bar |
| P p | Total pressure in the permeate side, bar |
| P r | Pressure ratio, dimensionless |
| q H2,L | Dimensionless molar flow rate of H2 at the outlet of the permeate side |
| q i | Dimensionless molar flow rate of component i in the permeate side |
| Q i | Molar flow rate of component i in the permeate side, mol s−1 |
| q NH3,L | Dimensionless molar flow rate of NH3 at the outlet of the permeate side |
| R | Universal gas constant, kJ mol−1 K−1 |
| R H2 | Hydrogen recovery, % or fractional |
| r rxn | Rate of ammonia decomposition reaction, mol gcat−1 s−1 |
| St | Stanton number |
| T | Temperature of the catalytic bed, K |
| T 0 | Temperature of the feed, K |
| T w | Reactor wall temperature, K |
| T wSP | Reactor wall setpoint temperature, K |
| U | Overall heat transfer coefficient between the catalytic bed and the reactor wall, kW m−2 K−1 |
| V | Volume of the annular space, m3 |
| W cat | Total catalyst mass, g |
| x i | Molar fraction of component i in the catalytic bed |
| X NH3 | Conversion of NH3, % or fractional |
| y i | Molar fraction of component i in the permeate side |
| z | Axial length of the reactor, m |
Abbreviations
| SSR | Sum of square residuals |
Greek symbols
Subscripts
| H2 | Hydrogen |
| N2 | Nitrogen |
| NH3 | Ammonia |
| 0 | At the reactor inlet |
Superscripts
| cal | Calculated |
| exp | Experimental |
Author contributions
Natalia Realpe: investigation; data curation; software; formal analysis; visualization; writing – original draft. Shekhar R. Kulkarni: methodology; software; formal analysis; visualization; writing – original draft. Jose L. Cerrillo: investigation; validation; formal analysis; writing – original draft. Natalia Morlanes: investigation; validation; formal analysis; writing – review & editing. Gontzal Lezcano: conceptualization and formal analysis. Sai P. Katikaneni: conceptualization; formal analysis; resources; supervision. Stephen N. Paglieri: conceptualization; resources. Mohammad Rakib: resources; supervision. Bandar Solami: resources; supervision. Jorge Gascon: conceptualization; funding acquisition; supervision; writing – review and editing. Pedro Castaño: conceptualization; methodology; funding acquisition; supervision; project administration; writing – review and editing.Conflicts of interest
There are no conflicts to declare.Acknowledgements
The authors gratefully acknowledge the financial support provided by Saudi Aramco and the resources and facilities provided by King Abdullah University of Science and Technology (KAUST).References
- K. Oshiro and S. Fujimori, Appl. Energy, 2022, 313, 118803 CrossRef CAS.
- A. Sánchez, E. Castellano, M. Martín and P. Vega, Appl. Energy, 2021, 293, 116956 CrossRef.
- R. Lan, J. T. S. Irvine and S. Tao, Int. J. Hydrogen Energy, 2012, 37, 1482–1494 CrossRef CAS.
- G. Garcia, E. Arriola, W.-H. Chen and M. D. De Luna, Energy, 2021, 217, 119384 CrossRef CAS.
- N. Morlanés, S. P. Katikaneni, S. N. Paglieri, A. Harale, B. Solami, S. M. Sarathy and J. Gascon, Chem. Eng. J., 2021, 408, 127310 CrossRef.
- D. Wen and M. Aziz, Appl. Energy, 2022, 319, 119272 CrossRef CAS.
- J. Cha, Y. S. Jo, H. Jeong, J. Han, S. W. Nam, K. H. Song and C. W. Yoon, Appl. Energy, 2018, 224, 194–204 CrossRef CAS.
- O. A. Ojelade and S. F. Zaman, Chem. Pap., 2021, 75, 57–65 CrossRef CAS.
- G. Sdanghi, G. Maranzana, A. Celzard and V. Fierro, Renewable Sustainable Energy Rev., 2019, 102, 150–170 CrossRef CAS.
- J. Bellosta von Colbe, J. R. Ares, J. Barale, M. Baricco, C. Buckley, G. Capurso, N. Gallandat, D. M. Grant, M. N. Guzik, I. Jacob, E. H. Jensen, T. Jensen, J. Jepsen, T. Klassen, M. V. Lototskyy, K. Manickam, A. Montone, J. Puszkiel, S. Sartori, D. A. Sheppard, A. Stuart, G. Walker, C. J. Webb, H. Yang, V. Yartys, A. Züttel and M. Dornheim, Int. J. Hydrogen Energy, 2019, 44, 7780–7808 CrossRef CAS.
- J. L. Cerrillo, N. Morlanés, S. R. Kulkarni, N. Realpe, A. Ramírez, S. P. Katikaneni, S. N. Paglieri, K. Lee, A. Harale, B. Solami, A. Jamal, S. Mani Sarathy, P. Castaño and J. Gascon, Chem. Eng. J., 2022, 431, 134310 CrossRef CAS.
- C. Chen, K. Wu, H. Ren, C. Zhou, Y. Luo, L. Lin, C. Au and L. Jiang, Energy Fuels, 2021, 35, 11693–11706 CrossRef CAS.
- I. Lucentini, A. Casanovas and J. Llorca, Int. J. Hydrogen Energy, 2019, 44, 12693–12707 CrossRef CAS.
- S. Mukherjee, S. V. Devaguptapu, A. Sviripa, C. R. F. Lund and G. Wu, Appl. Catal., B, 2018, 226, 162–181 CrossRef CAS.
- Y. Luo, S. Liao, S. Chen, H. Fang, F. Zhong, L. Lin, C. Zhou, C. Chen, G. Cai, C. T. Au and L. Jiang, Appl. Energy, 2022, 307, 118158 CrossRef CAS.
- L. A. Jolaoso, S. F. Zaman, S. Podila, H. Driss, A. A. Al-Zahrani, M. A. Daous and L. Petrov, Int. J. Hydrogen Energy, 2018, 43, 4839–4844 CrossRef CAS.
- S. Podila, H. Driss, S. F. Zaman, Y. A. Alhamed, A. A. Alzahrani, M. A. Daous and L. A. Petrov, J. Mol. Catal. A: Chem., 2016, 414, 130–139 CrossRef CAS.
- V. Cechetto, L. Di Felice, J. A. Medrano, C. Makhloufi, J. Zuniga and F. Gallucci, Fuel Process. Technol., 2021, 216, 7–10 CrossRef.
- N. Itoh, A. Oshima, E. Suga and T. Sato, Catal. Today, 2014, 236, 70–76 CrossRef CAS.
- N. Lu and D. Xie, Int. J. Chem. React. Eng., 2016, 14, 1–31 CrossRef CAS.
- G. Li, M. Kanezashi, T. Yoshioka and T. Tsuru, AIChE J., 2013, 59, 168–179 CrossRef CAS.
- F. R. García-García, Y. H. Ma, I. Rodríguez-Ramos and A. Guerrero-Ruiz, Catal. Commun., 2008, 9, 482–486 CrossRef.
- A. Di Carlo, A. Dell'Era and Z. Del Prete, Int. J. Hydrogen Energy, 2011, 36, 11815–11824 CrossRef CAS.
- E. Rizzuto, P. Palange and Z. Del Prete, Int. J. Hydrogen Energy, 2014, 39, 11403–11410 CrossRef CAS.
- M. E. E. Abashar, J. King Saud Univ., Eng. Sci., 2018, 30, 2–11 Search PubMed.
- M. E. E. Abashar, Int. J. Hydrogen Energy, 2019, 4, 82–90 CrossRef.
- R. Y. Chein, Y. C. Chen, C. S. Chang and J. N. Chung, Int. J. Hydrogen Energy, 2010, 35, 589–597 CrossRef CAS.
- S. H. Israni, B. K. R. Nair and M. P. Harold, Catal. Today, 2009, 139, 299–311 CrossRef CAS.
- S. Ilias, N. Su, U. I. Udo-Aka and F. G. King, Sep. Sci. Technol., 1997, 32, 487–504 CrossRef CAS.
- J. P. Collins and J. Douglas Way, Ind. Eng. Chem. Res., 1993, 32, 3006–3013 CrossRef CAS.
- C. Su, T. Jin, K. Kuraoka, Y. Matsumura and T. Yazawa, Ind. Eng. Chem. Res., 2005, 44, 3053–3058 CrossRef CAS.
- J. Liu, X. Ju, C. Tang, L. Liu, H. Li and P. Chen, Chem. Eng. J., 2020, 388, 124245 CrossRef CAS.
- H. Chen, C. Chu and T. Huang, Sep. Sci. Technol., 2005, 39, 1461–1483 CrossRef.
- X. Zhang, G. Xiong and W. Yang, J. Membr. Sci., 2008, 314, 226–237 CrossRef CAS.
- S. Liguori, A. Iulianelli, F. Dalena, P. Pinacci, F. Drago, M. Broglia, Y. Huang and A. Basile, Membranes, 2014, 4, 143–162 CrossRef PubMed.
- A. Li, J. R. Grace and C. J. Lim, J. Membr. Sci., 2007, 306, 159–165 CrossRef CAS.
- I. P. Mardilovich, E. Engwall and Y. H. Ma, Desalination, 2002, 144, 85–89 CrossRef CAS.
- M. Zahedi, B. Afra, M. Dehghani-Mobarake and M. Bahmani, J. Membr. Sci., 2009, 333, 45–49 CrossRef CAS.
- D. Wang, J. Tong, H. Xu and Y. Matsumura, Catal. Today, 2004, 93–95, 689–693 CrossRef CAS.
- J. Tong, Y. Matsumura, H. Suda and K. Haraya, Sep. Purif. Technol., 2005, 46, 1–10 CrossRef CAS.
- D. A. Pacheco Tanaka, M. A. Llosa Tanco, T. Nagase, J. Okazaki, Y. Wakui, F. Mizukami and T. M. Suzuki, Adv. Mater., 2006, 18, 630–632 CrossRef.
- H. Li, A. Goldbach, W. Li and H. Xu, J. Membr. Sci., 2007, 299, 130–137 CrossRef CAS.
- R. Sanz, J. A. Calles, D. Alique, L. Furones, S. Ordóñez, P. Marín, P. Corengia and E. Fernandez, Int. J. Hydrogen Energy, 2011, 36, 15783–15793 CrossRef CAS.
- Y. Huang and R. Dittmeyer, J. Membr. Sci., 2007, 302, 160–170 CrossRef CAS.
- J. Tong, C. Su, K. Kuraoka, H. Suda and Y. Matsumura, J. Membr. Sci., 2006, 269, 101–108 CrossRef CAS.
- J. A. Lie and M. B. Hägg, Carbon, 2005, 43, 2600–2607 CrossRef CAS.
- S. Gopalakrishnan, Y. Yoshino, M. Nomura, B. N. Nair and S. I. Nakao, J. Membr. Sci., 2007, 297, 5–9 CrossRef CAS.
- D. Wang, K. Li and W. K. Teo, J. Membr. Sci., 1995, 105, 89–101 CrossRef CAS.
- I. Pinnau and L. G. Toy, J. Membr. Sci., 1996, 109, 125–133 CrossRef CAS.
- B. K. R. Nair, J. Choi and M. P. Harold, J. Membr. Sci., 2007, 288, 67–84 CrossRef CAS.
- H. B. Zhao, K. Pflanz, J. H. Gu, A. W. Li, N. Stroh, H. Brunner and G. X. Xiong, J. Membr. Sci., 1998, 142, 147–157 CrossRef CAS.
- N. Itoh, T. Akiha and T. Sato, Catal. Today, 2005, 104, 231–237 CrossRef CAS.
- C. S. Jun and K. H. Lee, J. Membr. Sci., 2000, 176, 121–130 CrossRef CAS.
- S. Yun, J. H. Ko and S. T. Oyama, J. Membr. Sci., 2011, 369, 482–489 CrossRef CAS.
- K. S. Rothenberger, A. V. Cugini, B. H. Howard, R. P. Killmeyer, M. V. Ciocco, B. D. Morreale, R. M. Enick, F. Bustamante, I. P. Mardilovich and Y. H. Ma, J. Membr. Sci., 2004, 244, 55–68 CrossRef CAS.
- M. L. Bosko, F. Ojeda, E. A. Lombardo and L. M. Cornaglia, J. Membr. Sci., 2009, 331, 57–65 CrossRef CAS.
- D. W. Lee, Y. G. Lee, S. E. Nam, S. K. Ihm and K. H. Lee, J. Membr. Sci., 2003, 220, 137–153 CrossRef CAS.
- J. Zhang, H. Xu and W. Li, Appl. Catal., A, 2005, 296, 257–267 CrossRef CAS.
- Z. Zhang, S. Liguori, T. F. Fuerst, J. D. Way and C. A. Wolden, ACS Sustainable Chem. Eng., 2019, 7, 5975–5985 CrossRef CAS.
- M. R. Rahimpour and A. Asgari, J. Hazard. Mater., 2008, 153, 557–565 CrossRef CAS PubMed.
- M. C. J. Bradford, P. E. Fanning and M. A. Vannice, J. Catal., 1997, 172, 479–484 CrossRef CAS.
- A. Di Carlo, L. Vecchione and Z. Del Prete, Int. J. Hydrogen Energy, 2014, 39, 808–814 CrossRef CAS.
- V. Prasad, A. M. Karim, A. Arya and D. G. Vlachos, Ind. Eng. Chem. Res., 2009, 48, 5255–5265 CrossRef CAS.
- A. Nielsen, J. Kjaer and B. Hansen, J. Catal., 1964, 3, 68–79 CrossRef CAS.
- U. Guacci, F. Traina, G. Buzzi Ferrarla and R. Barisone, Ind. Eng. Chem. Process Des. Dev., 1977, 16, 166–176 CrossRef CAS.
- H. Maleki, M. Fulton and V. Bertola, Chem. Eng. J., 2021, 411, 128595 CrossRef CAS.
- J. P. Collins and J. D. Way, J. Membr. Sci., 1994, 96, 259–274 CrossRef CAS.
- S. Dzuryk and E. Rezaei, Chem. Eng. Sci., 2022, 250, 117377 CrossRef CAS.
- M. Á. Gómez-García, I. Dobrosz-Gómez, J. Fontalvo and J. M. Rynkowski, Catal. Today, 2012, 191, 165–168 CrossRef.
- S. Sayas, N. Morlanés, S. P. Katikaneni, A. Harale, B. Solami and J. Gascon, Catal. Sci. Technol., 2020, 10, 5027–5035 RSC.
- J. C. Ganley, F. S. Thomas, E. G. Seebauer and R. I. Masel, Catal. Lett., 2004, 96, 117–122 CrossRef CAS.
- L. Wang, Y. Zhao, C. Liu, W. Gong and H. Guo, Chem. Commun., 2013, 49, 3787–3789 RSC.
- S. Armenise, E. García-Bordejé, J. L. Valverde, E. Romeo and A. Monzón, Phys. Chem. Chem. Phys., 2013, 15, 12104–12117 RSC.
- N. Morlanés, S. Sayas, G. Shterk, S. P. Katikaneni, A. Harale, B. Solami and J. Gascon, Catal. Sci. Technol., 2021, 11, 3014–3024 RSC.
- V. Specchia, G. Baldi and S. Sicardi, Chem. Eng. Commun., 1980, 4, 361–380 CrossRef CAS.
- D. L. Cresswell, in Chemical Reactor Design and Technology, ed. H. I. de Lasa, Springer Netherlands, Dordrecht, 1986, pp. 687–728 Search PubMed.
- A. Karim, J. Bravo and A. Datye, Appl. Catal., A, 2005, 282, 101–109 CrossRef CAS.
- J. Zhang, H. Xu and W. Li, J. Membr. Sci., 2006, 277, 85–93 CrossRef CAS.
- D. Zambrano, J. Soler, J. Herguido and M. Menéndez, Chem. Eng. J., 2020, 393, 124775 CrossRef CAS.
- G. Li, M. Kanezashi and T. Tsuru, Catal. Commun., 2011, 15, 60–63 CrossRef CAS.
Footnote |
| † Electronic supplementary information (ESI) available. See DOI: https://doi.org/10.1039/d2re00408a |
| This journal is © The Royal Society of Chemistry 2023 |


