
Optimization of key factors affecting biohydrogen production from microcrystalline cellulose by the co-culture of Clostridium acetobutylicum X9 + Ethanoigenens harbinense B2
Hongxu Bao*ab,
Chunxiao Chena,
Lei Jianga,
Yichen Liua,
Manli Shena,
Wenzong Liuc and
Aijie Wang*bc
aSchool of Environmental Science, Liaoning University, Shenyang 110036, China. E-mail: baohongxu555@163.com; Fax: +86 024 62204818; Tel: +86 024 62202248
bState Key Laboratory of Urban Water Resources and Environments, Harbin Institute of Technology, Harbin 150090, China. E-mail: waj0578@hit.edu; Fax: +86 451 86282195; Tel: +86 451 86282195
cKey Laboratory of Environmental Biotechnology, Research Center for Eco-Environmental Sciences, Chinese Academy of Sciences, Beijing 100085, China
First published on 17th December 2015
Abstract
The key factors (initial pH value, substrate concentration, incubation time, C/N and L-cysteine concentration) that affect biohydrogen production from microcrystalline cellulose in batch fermentation by the co-culture of isolated strains (Clostridium acetobutylicum X9 + Ethanoigenens harbinense B2) were optimized using an orthogonal experiment. The isolated strain, Clostridium acetobutylicum X9, had high hydrogen yield from microcrystalline cellulose (MCC), and Ethanoigenens harbinense B2 could produce hydrogen efficiently from monosaccharides directly from microcrystalline cellulose. The optimal parameters were as follows: initial pH value of 6.0, 12 g L−1 substrate concentration, 40 h incubation time, 0.7 g L−1 L-cysteine concentration and a 4![[thin space (1/6-em)]](https://www.rsc.org/images/entities/char_2009.gif) :1 ratio of C/N. Under the optimum culture conditions, a maximum hydrogen yield rate of 10.4 mmol g-MCC−1 was obtained. This yield is approximately 2.2-fold greater than that of mono-culture Clostridium acetobutylicum X9. It suggests that the optimal conditions achieved can be applied to the production of hydrogen from microcrystalline cellulose using the co-culture of isolated strains, Clostridium acetobutylicum X9 + Ethanoigenens harbinense B2.
:1 ratio of C/N. Under the optimum culture conditions, a maximum hydrogen yield rate of 10.4 mmol g-MCC−1 was obtained. This yield is approximately 2.2-fold greater than that of mono-culture Clostridium acetobutylicum X9. It suggests that the optimal conditions achieved can be applied to the production of hydrogen from microcrystalline cellulose using the co-culture of isolated strains, Clostridium acetobutylicum X9 + Ethanoigenens harbinense B2.
1 Introduction
Energy is an essential commodity for increasing productivity in both agriculture and industry. The worldwide energy demand has been increasing rapidly and this energy crisis has serious negative effects on the environment such as global warming.1,2 As a renewable energy, biomass power has had a rapid growth in the past decade in China.3,4 Biomass will play an important role in the global energy infrastructure in the future for the generation of power and heat, along with the production of chemicals and fuels.5 In recent years, many researchers have already studied biomass conversion to energy such as hydrogen, ethanol and methane.6–10Currently, hydrogen is produced, exclusively, by the electrolysis of water or by the steam reformation of methane. Hydrogen production via biological technologies provides a wide range of approaches to generate hydrogen,11 for example biological hydrogen production from renewable lignocellulosic waste has attracted significant attention.12 The study of Alibardi and Cossu indicated that the bread–pasta fraction in organic wastes has a marked effect on hydrogen potential production.13 Ren et al. presented a comprehensive review on the bioconversion of lignocellulosic biomass to hydrogen, which sheds light on the perspectives on lignocellulosic biomass conversion to hydrogen.14 To generate hydrogen directly from lignocellulose materials using dark fermentation requires expensive pretreatment processes for release of the underlying monomeric sugars such as delignification and hydrolysis.15–17 Therefore, prior to DF, these biomasses are often subjected to physical, chemical and biological pre-treatment to increase their digestibility.18 Favaro et al. reported that a properly pre-treated inoculum could be used to improve the hydrogen yield from organic waste.19 Microcrystalline cellulose (MCC) is a cellulose derived from high quality wood pulp by acid hydrolysis, which is used to remove the amorphous regions.20 It is a purified partially depolymerized non-fibrous form of cellulose that occurs as a white, odorless, tasteless, crystalline powder composed of porous particles.21 Therefore, microcrystalline cellulose (MCC) can be effectively utilized as a model substrate to produce hydrogen.
The co-culture of cellulolytic and hydrogen-producing strains, which takes advantage of their specific metabolic capacities, offers a promising new way to enhance the conversion efficiency of cellulose to hydrogen.22 Many studies on co-cultures have been investigated for the enhancement of hydrogen production.12,23,24 To improve the hydrogen production efficiency, two aspects can be considered: the characterization of the key factors that affect biohydrogen production by co-culture strains and identification of the ecological relationship among the organisms.
Based on this background, the aim of this study is to explore the optimal conditions of the key factors that affect biohydrogen production by the co-culture of isolated strains Clostridium acetobutylicum X9 + Ethanoigenens harbinense B2. In order to determine the optimal combination of factor levels, single-factor experiments and orthogonal experiments were used in this experimental design, and a series of experiments were conducted.25
2 Materials and methods
2.1. Hydrogen-producing strains
The strains Clostridium acetobutylicum X9 (NCBI: EU434651) and Ethanoigenens harbinense B2 (NCBI: EU639425) were isolated from activated sludge in a pilot-scale continuous fermentative hydrogen production reactor (working volume: 1.48 m3, substrate: molasses). The procedure was conducted using organic loading rates of 3.11–85.8 kg COD m−3 d−1 for over 200 days.26 The strain Clostridium acetobutylicum X9 has a typical butyrate-type fermentation metabolism with high hydrogen yield and cellulose degradation, whereas Ethanoigenens harbinense B2, which has a 98% similarity to B49, undergoes the so-called ethanol-type fermentation metabolism with high hydrogen yield.272.2. Batch experiments
Batch experiments were carried out anaerobically in 100 mL or 250 mL serum bottles, at 37–40 °C, on an orbital shaker at a rotation speed of 90–130 rpm. The fermentation broth composition was (g L−1): microcrystalline cellulose: 12, peptone: 4.0, beef extract: 2.0, yeast extract: 1.0, NaCl: 4.0, K2HPO4: 1.0, MgCl2: 0.1, FeSO4: 0.1, and L-cysteine: 0.5. Moreover, 10 mL L−1 medium of vitamins (cyanocobalamin: 0.01 g L−1, ascorbic acid: 0.025 g L−1, riboflavin: 0.025 g L−1, citric acid: 0.02 g L−1, pyridoxine: 0.05 g L−1, folic acid: 0.01 g L−1, 4-aminobenzoic acid: 0.01 g L−1, and creatine: 0.025 g L−1) and micronutrients (MnSO4·7H2O: 0.01 g L−1, ZnSO4·7H2O: 0.05 g L−1, H3BO3: 0.01 g L−1, N(CH2COOH)3: 4.5 g L−1, CaCl2·2H2O: 0.01 g L−1, Na2MoO4: 0.01 g L−1, CoCl2·6H2O: 0.2 g L−1, and AlK(SO4)2: 0.01 g L−1) were added. Moreover, 1 mL of resazurin (0.2%) was added to verify whether the reaction system was in the anaerobic condition. The microcrystalline cellulose had a cellulose content of 97.2% (v/v, dry basis) and water solubility of 0.1% (w/v).In the co-culture experiments, the two strains, Clostridium acetobutylicum X9 + Ethanoigenens harbinense B2, were mixed in the same volumes at a total biomass quantity of 6 mL (6%). All experiments were repeated three times.
2.3. Analytical methods
In the fermentation experiments, hydrogen production, end liquid products, cellulose degradation, and quantities of reductive saccharides were measured.Gas chromatography (SCII, Shanghai Analytical Apparatus, China) was used to determine the hydrogen content in the gas phase using a thermal conductivity detector (TCD) and nitrogen as the carrier gas (70 mL min−1). A 2.0 m stainless column was packed with TDS-01 (60–80 mesh). The column and detector were both kept at 150 °C.
Another gas chromatograph (GC122, Beijing Oriental Fine Hua Yuan Co., China) was employed to detect the volatile fatty acids (VFAs) and alcohol contents in the centrifuged (4000 rpm) fermenting liquor using nitrogen as the carrier gas (flow rate of 60 mL min−1). A hydrogen flame-ionization detector (FID) was employed using hydrogen and air flow rates of 50 and 490 mL min−1, respectively, and a 2.0 m GDX-103 (60–80 mesh) column. The column and all cells were maintained at 190 °C.
Microcrystalline cellulose concentration was determined via the phenol–H2SO4 method after removal of cell mass, as described by Minato et al.28 The amount of reducing sugar was determined via the DNS method using xylose (Sigma) as a standard. One unit (U) of xylanase activity was expressed as 1 μmol of reducing sugar (xylose equivalent) released in 1 min.29
Based on the cumulative H2 production data and MCC substrate content in the batch experiment, the H2 yield and cellulose degradation were calculated as follows:
| H2 yield = nH2/(M1 − M2) | (1) |
 | (2) |
3 Results and discussion
3.1. Single-factor experiment
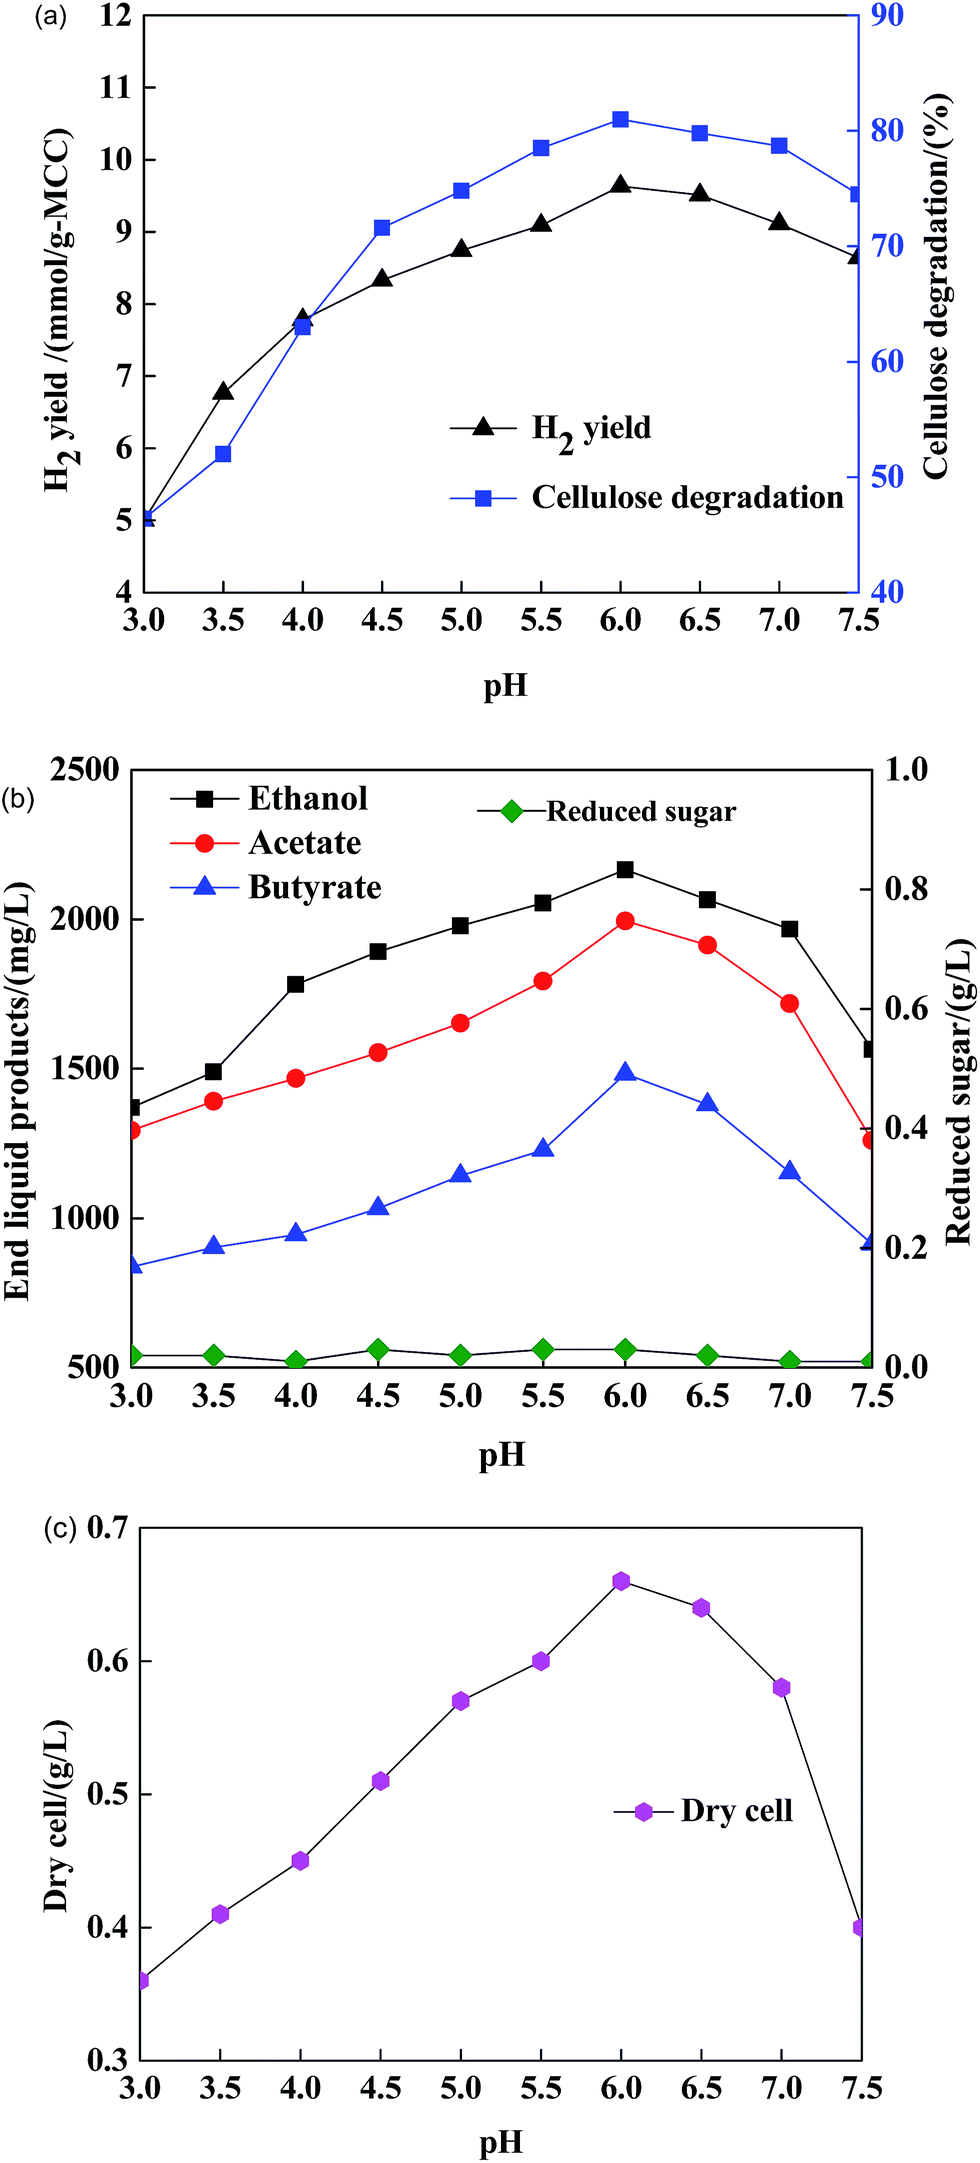 | ||
| Fig. 1 (a) Effects of initial pH on H2 yield/cellulose degradation; (b) effect of initial pH on end liquid products/reduced sugar of X9 + B2; (c) effects of pH on cell dry weight. | ||
At initial pH 6.0, the molar ratio (ethanol/butyrate/acetate) of the end liquid products was almost 1.5:1.0:1.5. In other words, the co-cultured strains underwent the ethanol-type fermentation researched by Ren et al.32 The high content of ethanol in the end liquid products could buffer the ferment-end pH and reduce the inhibition of end products from MCC, which is beneficial for maintaining the stability of microbial growth and hydrogen formation.
 | ||
| Fig. 2 (a) Effects of substrate concentration on H2 yield/cellulose degradation; (b) effects of substrate concentration on end liquid products/reduced sugar of X9 + B2; (c) effects of substrate concentration on cell dry weight. | ||
Understanding the dependence of substrate concentration on fermentative hydrogen production is a critical step towards optimal control. Whether substrate concentration is moderate or not, it will directly affect the state of the growth and the activation of hydrogen-producing bacteria. In particular, too high or too low substrate concentration will affect the related enzyme secretion and metabolic pathways of bacteria hydrogen production.
 | ||
| Fig. 3 (a) Effects of incubation time on H2 yield/cellulose degradation; (b) effects of incubation time on end liquid products/reduced sugar of X9 + B2; (c) effects of incubation time on cell dry weight. | ||
:1:1) was used as the complex nitrogen source.Fig. 4(a–c) illustrate that the hydrogen yield, cellulose degradation, end liquid products and cell dry weight increased with an increase in C/N ratio, which ranged from 0 to 4.0. At a C/N ratio of 4.0, the maximum H2 yield rate of Clostridium sp. X9 + Ethanoigenens harbinense B2 reached 10.26 mmol g-MCC−1, cellulose degradation of 86%, dry cell of 0.72 g L−1, and the maximum concentrations of ethanol, butyrate and acetate were 2412 mg L−1, 1470 mg L−1 and 2015 mg L−1, respectively, in the end liquid products. Moreover, the reducing sugar also did not accumulate to a detectable quantity in the fermenting liquid.
 | ||
| Fig. 4 (a) Effects of C/N on H2 yield/cellulose degradation; (b) effects of C/N on end liquid products/reduced sugar of X9 + B2; (c) effects of C/N on cell dry weight. | ||
As shown in Fig. 5(a) and (b), the hydrogen yield, cellulose degradation and end liquid products increased with an increase in L-cysteine concentration, which ranged from 0 to 0.7 g L−1. The H2 yield of Clostridium acetobutylicum X9 + Ethanoigenens harbinense B2 and cellulose degradation reached a peak of 10.3 mmol g-MCC−1 and 85%, respectively, at the L-cysteine concentration of 0.7 g L−1. Moreover, the maximum concentrations of ethanol, butyrate and acetate in the end liquid products were 2386 mg L−1, 1500 mg L−1 and 2032 mg L−1, respectively. As shown in Fig. 5(c) , the cell dry weight increased with an increase in L-cysteine concentration. Similarly, in the fermenting liquid, the reducing sugar did not accumulate to a detectable quantity.
 | ||
| Fig. 5 (a) Effects of L-cysteine concentration on H2 yield/cellulose degradation; (b) effects of L-cysteine concentration on end liquid products/reduced sugar of X9 + B2; (c) effects of L-cysteine concentration on cell dry weight. | ||
3.2. Orthogonal experiment
Based on single-factor experiments, the factors that influence hydrogen yield were examined through an orthogonal experiment. The design and results of the orthogonal experiment L16 (45) are presented in Tables 1 and 2. The parameter, K, is the statistical average of hydrogen yield at one level (for one factor). The parameter, R, is the statistical range of K1–K4 for one factor. The different values of K show the effects of the four levels on hydrogen yield, whereas the different values of R suggest the effects of the five factors on hydrogen yield.41| Experiment no. | Parameters | RH2c (mmol g−1) | ||||
|---|---|---|---|---|---|---|
| SCa (g L−1) | Initial pH | C/N | Incubation time (h) | LCb (g L−1) | ||
| a SC represents substrate concentration.b LC represents L-cysteine concentration.c RH2 represents hydrogen yield. | ||||||
| 1 | 10 | 5.0 | 2.5 | 36 | 0.3 | 8.5 |
| 2 | 10 | 5.5 | 3.3 | 38 | 0.5 | 9.6 |
| 3 | 10 | 6.0 | 4.0 | 40 | 0.7 | 10.1 |
| 4 | 10 | 6.5 | 5.0 | 42 | 1.0 | 9.7 |
| 5 | 12 | 5.0 | 3.3 | 40 | 1.0 | 9.1 |
| 6 | 12 | 5.5 | 2.5 | 42 | 0.7 | 9.9 |
| 7 | 12 | 6.0 | 5.0 | 38 | 0.5 | 10.3 |
| 8 | 12 | 6.5 | 4.0 | 36 | 0.3 | 9.4 |
| 9 | 15 | 5.0 | 4.0 | 42 | 0.5 | 8.7 |
| 10 | 15 | 5.5 | 5.0 | 40 | 0.3 | 9.7 |
| 11 | 15 | 6.0 | 2.5 | 38 | 1.0 | 9.8 |
| 12 | 15 | 6.5 | 3.3 | 36 | 0.7 | 9.2 |
| 13 | 18 | 5.0 | 5.0 | 38 | 0.7 | 8.3 |
| 14 | 18 | 5.5 | 4.0 | 36 | 1.0 | 8.6 |
| 15 | 18 | 6.0 | 3.3 | 42 | 0.3 | 9.0 |
| 16 | 18 | 6.5 | 2.5 | 40 | 0.5 | 9.3 |
| Hydrogen yield | |||||
|---|---|---|---|---|---|
| SC (g L−1) | Initial pH | C/N | Incubation time (h) | LC (g L−1) | |
| a K represents the average of hydrogen yield of four experiments at one level (for one factor).b R represents the range of K1–K4 for one factor. | |||||
| K1a | 9.475 | 8.650 | 9.375 | 9.150 | 9.150 |
| K2 | 9.675 | 9.450 | 9.225 | 9.275 | 9.375 |
| K3 | 9.350 | 9.800 | 9.500 | 9.550 | 9.475 |
| K4 | 8.800 | 9.400 | 9.200 | 9.325 | 9.300 |
| Rb | 0.875 | 1.150 | 0.300 | 0.400 | 0.325 |
| Optimal result | SC2 | pH3 | C/N3 | Time3 | LC3 |
According to data analysis in Table 2, the order of influence strength is initial pH > substrate concentration > incubation time > L-cysteine concentration > C/N. The optimum hydrogen yield condition was initial pH 6.0, substrate concentration 12 g L−1, incubation time 40 h, L-cysteine concentration 0.7 g L−1 and C/N 4.0. A verification experiment was carried out under the optimal condition, and the hydrogen yield was 10.4 mmol g-MCC−1.
The stain B2 and X9 have different abilities for bio-hydrogen production from cellulose. In the mono-culture test, X9 achieved a much higher hydrogen yield than of B2.42 In the B2 and X9 co-culture test, a maximum hydrogen yield of 10.4 mmol g-MCC−1 was obtained under the optimum condition, which was approximately 2.2-fold greater than the mono-culture Clostridium acetobutylicum X9.40 This reveals that the co-culture of strain B2 and X9 can achieve bioaugmentation effects for hydrogen production from cellulose.
Moreover, the efficiency of the X9 + B2 co-culture cellulosic H2 production system is comparable to that reported in the other studies (Table 3). The results indicate that co-culture of Clostridium acetobutylicum X9 + Ethanoigenens harbinense B2 presents a potential approach to converting cellulose into hydrogen energy.
| Microbe | Substrate | Temperature (°C) | H2 yield (mmol g−1) | Reference |
|---|---|---|---|---|
| a MC microcrystalline cellulose, CMC carboxymethyl cellulose. | ||||
| X9 | Stream-exploded corn stover (15 g L−1) | 37 | 3.4 | Wang et al.43 |
| X9 + B49 | MCC (10 g L−1) | 38 | 8.1 | Wang et al.43 |
| JN4 + GD17 | MCC, filter paper or cellobiose (5 g L−1) | 60 | 18 | Liu et al.44 |
| G1 + B49 | MCC (5 g L−1) | 37 | 2.97 | Wang et al.45 |
| Sludge & Clostridium pasteurianum | CMC (10 g L−1) | 35 | 1.09 | Lo et al.46 |
| X9 + B9 | MCC (12 g L−1) | 37 | 10.4 | This study |
4 Conclusions
This study explores the optimization of the key factors that affect biohydrogen production from microcrystalline cellulose by the co-culture of isolated strains Clostridium acetobutylicum X9 + Ethanoigenens harbinense B2. In single-factor experiments, hydrogen production, end liquid products, cellulose degradation, and quantities of reductive saccharides were measured versus initial pH, substrate concentration, incubation time, C/N, and L-cysteine concentration. Based on these single-factor experiments, the factors that influence the hydrogen yield were examined through an orthogonal experiment. The influence strength sequence of the factors is initial pH > substrate concentration > incubation time > L-cysteine concentration > C/N. The determined optimal conditions were initial pH 6.0, substrate concentration 12 g L−1, incubation time 40 h, L-cysteine concentration 0.7 g L−1 and C/N 4.0. Under the optimum condition, a maximum hydrogen yield of 10.4 mmol g-MCC−1 was obtained, which was approximately 2.2-fold greater than the mono-culture Clostridium acetobutylicum X9 in our previous study.42 The two strains were isolated from the same habitat and there exists an ecological niche complementarity between them. The corresponding end liquid products were acetate, ethanol, and butyrate. In the stable hydrogen production phase, the ethanol content was 2400 mg L−1, which was 1.6-fold greater than butyrate. The increasing neutral ethanol content and component could avoid the effect of acid products on the microbial metabolic processes. In this stage, the pH range of variation, high cellulose degradation, hydrogen production and microbe activity would be maintained, and the hydrogen production cycle would be prolonged. Hence, the co-culture of the strain Ethanoigenens harbinense B2 and Clostridium acetobutylicum X9 can achieve bioaugmentation effects for hydrogen production from cellulose and is more competitive than the mono-culture in cellulose conversion. Our research results indicate that the dark fermentation of cellulosic biomass by the co-culture of Clostridium acetobutylicum X9 + Ethanoigenens harbinense B2 should be further developed. It has the potential use for converting cellulose and hemicellulose into hydrogen energy.Acknowledgements
This study was supported by the National Natural Science Foundation (30470054), the Scientific and Technological Project of Liaoning Province (2001304024), the natural science foundation of Liaoning Province (No. 20120132), the Liaoning province science and the cause of Public Research Fund (No. 20111012), the Bureau of Shenyang city science and Technology Research Foundation (No. F12-277-1-39) and the City State Key Laboratory of water resources and water environment of open fund (No. HC201214).References
- I. K. Kapdan and F. Kargi, Enzyme Microb. Technol., 2006, 38, 569–582 CrossRef CAS.
- A. Midilli, M. Ay, I. Dincer and M. A. Rosen, Renewable Sustainable Energy Rev., 2005, 9, 255–271 CrossRef CAS.
- Z. y. Zhao and H. Yan, Renewable Energy, 2012, 37, 53–60 CrossRef.
- J. Li and J. Ge, Procedia Environ. Sci., 2011, 10, 2153–2158 CrossRef CAS.
- E. Kırtay, Energy Convers. Manage., 2011, 52, 1778–1789 CrossRef.
- K. Zhang, N. Ren, C. Guo, A. Wang and G. Cao, J. Environ. Sci., 2011, 23, 1929–1936 CrossRef CAS.
- F. Xu, K. Theerarattananoon, X. Wu, L. Pena, Y. C. Shi, S. Staggenborg and D. Wang, Ind. Crops Prod., 2011, 34, 1212–1218 CrossRef CAS.
- M. Asgher, Z. Ahmad and H. M. N. Iqbal, Ind. Crops Prod., 2013, 44, 488–495 CrossRef CAS.
- Q. Zhang, L. Tang, J. Zhang, Z. Mao and L. Jiang, Bioresour. Technol., 2011, 102, 3958–3965 CrossRef CAS PubMed.
- X. Y. Cheng, Q. Li and C. Z. Liu, Bioresour. Technol., 2012, 114, 327–333 CrossRef CAS PubMed.
- D. Levin, Int. J. Hydrogen Energy, 2004, 29, 173–185 CrossRef CAS.
- Q. Li and C.-Z. Liu, Int. J. Hydrogen Energy, 2012, 37, 10648–10654 CrossRef CAS.
- L. Alibardi and R. Cossu, Waste Manag., 2015, 36, 147–155 CrossRef CAS PubMed.
- N. Ren, A. Wang, G. Cao, J. Xu and L. Gao, Biotechnol. Adv., 2009, 27, 1051–1060 CrossRef CAS PubMed.
- M. Cui, Z. Yuan, X. Zhi, L. Wei and J. Shen, Int. J. Hydrogen Energy, 2010, 35, 4041–4047 CrossRef CAS.
- R. Datar, J. Huang, P. Maness, A. Mohagheghi, S. Czernik and E. Chornet, Int. J. Hydrogen Energy, 2007, 32, 932–939 CrossRef CAS.
- I. A. Panagiotopoulos, R. R. Bakker, T. de Vrije, E. G. Koukios and P. A. M. Claassen, Int. J. Hydrogen Energy, 2010, 35, 7738–7747 CrossRef CAS.
- A. Ghimire, L. Frunzo, F. Pirozzi, E. Trably and R. Escudie, Appl. Energy, 2015, 144, 73–95 CrossRef CAS.
- L. Favaro, et al., Int. J. Hydrogen Energy, 2013, 38, 11774–11779 CrossRef CAS.
- A. M. Adel, Z. H. Abd El-Wahab, A. A. Ibrahim and M. T. Al-Shemy, Carbohydr. Polym., 2011, 83, 676–687 CrossRef CAS.
- P. Mathew, K. Oksman and M. Sain, J. Appl. Polym. Sci., 2005, 97(5), 2014–2025 CrossRef.
- A. Geng, Y. He, C. Qian, X. Yan and Z. Zhou, Bioresour. Technol., 2010, 101, 4029–4033 CrossRef CAS PubMed.
- C. H. Chou, C.-L. Han, J.-J. Chang and J.-J. Lay, Int. J. Hydrogen Energy, 2011, 36, 13972–13983 CrossRef CAS.
- S. Wu, X. Li, J. Yu and Q. Wang, Bioresour. Technol., 2012, 123, 184–188 CrossRef CAS PubMed.
- S. Ma, H. Wang, Y. Wang, H. Bu and J. Bai, Renewable Energy, 2011, 36, 709–713 CrossRef CAS.
- A. Wang, Int. J. Hydrogen Energy, 2008, 33, 912–917 CrossRef CAS.
- N. Q. Ren, X. Q. Wang, W. S. Xiang, M. Lin, J. Z. Li and W. Q. Guo, High Technol. Lett., 2002, 8, 21–25 CAS.
- H. Minato, A. Endo, H. Kouriyama and T. Uemura, Nippon Nogeikagaku Kaishi, 1962, 36, 101–106 CrossRef CAS.
- G. L. Miller, J. Anal. Chem., 1959, 31, 426–428 CAS.
- Y. C. Lo, M. D. Bai, W. M. Chen and J. S. Chang, Bioresour. Technol., 2008, 99, 8299–8303 CrossRef CAS PubMed.
- Y. Fan, Bioresour. Technol., 2004, 91, 189–193 CrossRef CAS PubMed.
- N. Q. Ren, B. Z. Wang and J. C. Huang, Biotechnol. Bioeng., 1997, 54, 428–433 CrossRef CAS PubMed.
- S. V. Ginkel, S. Sung and J.-J. Lay, Environ. Sci. Technol., 2001, 35, 4726–4730 CrossRef CAS PubMed.
- C. Sreela-or, T. Imai, P. Plangklang and A. Reungsang, Int. J. Hydrogen Energy, 2011, 36, 14120–14133 CrossRef CAS.
- Y. C. Lo, Y. C. Su, C. Y. Chen, W. M. Chen, K. S. Lee and J. S. Chang, Bioresour. Technol., 2009, 100, 5802–5807 CrossRef CAS PubMed.
- C. Lin, Int. J. Hydrogen Energy, 2004, 29, 41–45 CrossRef CAS.
- Q. Li, D. Xing, N. Ren, L. Zhao and Y. Song, J. Environ. Sci., 2006, 27, 810–814 CAS.
- R. a. Doong and B. Schink, Environ. Sci. Technol., 2002, 36, 2939–2945 CrossRef CAS PubMed.
- Y. Song and B. E. Logan, Water Res., 2004, 38, 1626–1632 CrossRef CAS PubMed.
- Z. Yuan, H. Yang, X. Zhi and J. Shen, Int. J. Hydrogen Energy, 2008, 33, 6535–6540 CrossRef CAS.
- H. Su, J. Cheng, J. Zhou, W. Song and K. Cen, Int. J. Hydrogen Energy, 2009, 34, 8846–8853 CrossRef CAS.
- H. X. Bao, W. W. Cai, X. P. Ma, Y. T. Song, M. L. Shen, Z. L. Chen, L. D. Li and N. Q. Ren, Adv. Mater. Res., 2012, 512–515, 1446–1449 CrossRef CAS.
- A. Wang, N. Ren and Y. Shi, et al., Int. J. Hydrogen Energy, 2008, 33, 912–917 CrossRef CAS.
- Y. Liu, P. Yu and X. Song, et al., Int. J. Hydrogen Energy, 2008, 33, 2927–2933 CrossRef CAS.
- A. Wang, L. Gao and N. Ren, et al., Biotechnol. Lett., 2009, 31, 1321–1326 CrossRef CAS PubMed.
- Y. C. Lo, M. D. Bai, W. M. Chen and J. S. Chang, Bioresour. Technol., 2008, 99, 8299–8303 CrossRef CAS PubMed.
| This journal is © The Royal Society of Chemistry 2016 |