 Open Access Article
Stabilisation of metastable polymorphs: the case of paracetamol form III†
Richard
Telford
a,
Colin C.
Seaton
a,
Alexander
Clout
b,
Asma
Buanz
b,
Simon
Gaisford
b,
Gareth R.
Williams
 b,
Timothy J.
Prior
c,
Chidera H.
Okoye
d,
Tasnim
Munshi
d and
Ian J.
Scowen
*d
aSchool of Chemistry and Forensic Sciences, University of Bradford, Richmond Road, Bradford, BD7 1DP, UK
bUCL School of Pharmacy, University College London, 29-39 Brunswick Square, London WC1N 1AX, UK
cDepartment of Chemistry, University of Hull, Cottingham Road, Hull, HU6 7RX, UK
dSchool of Chemistry, University of Lincoln, Lincoln LN6 7DL, UK. E-mail: iscowen@lincoln.ac.uk
First published on 5th August 2016
Abstract
The design of a melt synthesis of the first air-stable formulation of the metastable form III of paracetamol is derived from thermo-spectroscopic and thermo-diffraction experiments. Melt crystallisation in the presence of β-1,4-saccharides produces form III selectively and the excipients appear to act as stabilising ‘active’ templates of the metastable polymorph.
Accessing and stabilising metastable polymorphic forms of active pharmaceutical ingredients remains a major challenge in pharmaceutical product innovation.1,2 While systemic approaches to polymorphic diversity in organic solids remain elusive, we report here studies into the polymorphism of paracetamol that indicates a promising role for the ‘excipient’ matrix to direct and stabilise metastable forms and the importance of in situ characterisation of polymorphism for formulation design.
Paracetamol exists in three polymorphic forms; a stable phase (I) and two metastable phases (II, III). Form I packs with a herringbone motif, while forms II and III display layered structures.3,4 The structure of form I results in poor compactibility, leading to poor tablet quality.3 However, difficulties in producing suitable quantities of either form II or III have limited research into their physical properties. While form III has been reported as highly unstable in air, even being referred to as ‘elusive’,4 recent reports indicate that surfaces such as glass5 and silica6 can promote its growth, and careful control of heating and cooling rates during melt crystallisation have also been demonstrated to lead to form III.7,8 Additionally, inclusion of hydroxypropyl methylcellulose (HPMC) into the paracetamol melts can alter the kinetics of the crystallisation of the two metastable phases, which provides an initial insight into the use of polysaccharides as templating agents.9,10
We report here the first air-stable formulations of paracetamol form III based on an apparently active interaction with an excipient matrix derived from saccharides. In situ spectroscopic and diffraction studies have offered unique insight into the melt synthesis. Furthermore, this approach is shown to be amenable to scale up.
The addition of molecular additives to alter the kinetics of the crystallisation process to obtain metastable polymorphs has been a frequent topic of study.11,12 The inhibition of the stable phase through preferential interactions between the additive and the surface available functional groups of the crystal may lead to slowing of crystal growth,13–17 while preferential interaction of the additive with the unstable phase may lead to stabilisation of the phase or alter the balance of the kinetic rates of the two phases.17 Design or selection of a suitable additive may then be used to control the crystallisation processes and tailor the creation of a desired polymorph.
Melt synthesis of air-stable form III utilises the sugar-based excipients lactose monohydrate and HPMC. The crystallisation process has been followed with simultaneous Raman-DSC and time-resolved X-ray diffraction-DSC experiments. Critically, computational modelling of the interfacial interactions at the predicted major faces of the respective paracetamol crystals and the excipient indicate significant drivers to the stabilisation of form III through hydrogen bonding.
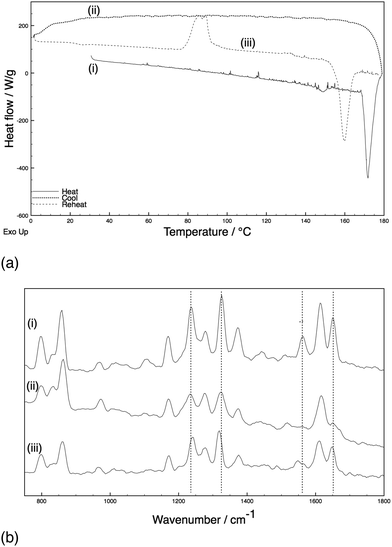
Samples of paracetamol and an excipient (10% w/w) were subjected to heating and cooling cycles with the phase of the crystal established with in situ Raman spectroscopy throughout the heating cycles.‡ A standardised heating cycle was implemented: (i) ambient to 180 °C at 10 °C min−1 and held for 2 minutes to melt the paracetamol and excipient mixture; (ii) quench cooling to 0 °C to generate an amorphous phase; (iii) reheating to 180 °C at 10 °C min−1. This last cycle caused three major thermal events: an exotherm at ca. 90 °C corresponding to crystallisation [identified as form III with indicative Raman shifts of phenyl C–C (ca. 1620 cm−1), amide II (ca. 1560 cm−1), and phenyl ring deformations (ca. 1320 and 1230 cm−1) bands],8,18 a second exotherm at 133 °C (conversion to form II), followed by an endotherm at 160 °C (melt of form II) (Fig. 1). The system with HPMC shows essentially identical behaviour (ESI,† Fig. S1 cf. Fig. S2). By comparison, an excipient free sample (ESI,† Fig. S3) melts on heating and cools to an amorphous phase. Upon reheating, recrystallisation to form II occurs at ca. 83 °C before the system melts at ca. 159 °C – importantly, no exotherm is apparent at 133 °C.
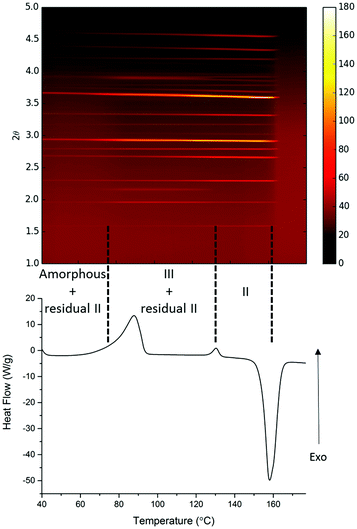
A parallel study of the melt synthesis of form III with lactose was undertaken using hyphenated in situ X-ray diffraction/DSC, using similar protocols to those in DSC-Raman studies.§ Due to a difference in the quenching rate, this sample results in a mixture of amorphous/form II paracetamol at room temperature as shown by the presence of Bragg reflections in the sample (Fig. 2, top). Upon reheating of this sample, the DSC shows a broad exotherm with a maximum at ca. 85 °C, followed by a second exotherm at 130 °C and an endotherm at just below 160 °C. The latter corresponds to the melt of form II, and XRD patterns collected above this temperature show no diffraction features. The two exotherms correspond to distinct changes in the XRD patterns. The first exotherm coincident with the crystallisation of form III from the amorphous material present. The second exotherm corresponds to the conversion of form III present into form II, resulting in a pure form II above 130 °C which persists until the mixture melts. Each pattern was analysed using the Rietveld method (selected datasets are given in the ESI,† Fig. S4 and Table S1). The presence of form II throughout the experiment up to the melting point is clear, as is the fact that form III grows in during the first exotherm and is converted to form II at the second. The area under the diffraction pattern from each phase was calculated (ESI,† Fig. S5). It is clear that the amount of form III present is largely constant between the two exotherms, despite the fact that form II crystals are also present. The amount of form II present increases throughout the experiment until the second exotherm, presumably a result of seeding of crystallisation from the amorphous material (in contrast to the pure phase III inferred from the Raman-DSC experiment in this region of the thermogram). Thus the lactose additive is still able to stabilise form III even in the presence of form II crystals.
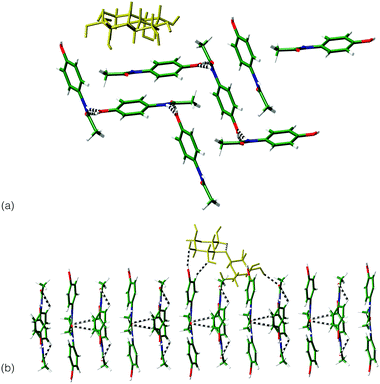
Interactions between the sugar excipients (modelled as lactose) and paracetamol were investigated computationally,¶ through the minimisation of the intermolecular interactions between crystal surfaces of the differing paracetamol polymorphs and a lactose molecule. For forms I and III, the dominant crystal faces of each phase, as indicated by several morphology prediction methods|| were investigated. For a single lactose molecule, significantly stronger interactions are indicated with the surfaces of form III compared to form I (Table 1). Visualisation of the strongest interactions for both systems (Fig. 3) shows that the match between hydrogen bond groups on each system is greater for form III compared to form I. It appears that the repeat of the location of the OH groups on this surface matches the lactose molecule ensuring a number of hydrogen bonds can be formed between the two systems. This matching of system size and orientation of hydrogen bonding functional groups may be the source of the stabilisation of form III and points to an active role for the excipient in stabilising the metastable form.
| System | Energy (kJ mol−1) |
|---|---|
| Form I (001 surface) | −42.748 |
| Form I (011 surface) | −51.321 |
| Form III (001 surface) | −55.693 |
| Form III (010 surface) | −57.735 |
 | ||
| Fig. 3 Comparison of the interaction between lactose molecule (yellow) and: (a) (011) surface of form I; (b) the (010) surface of form III. | ||
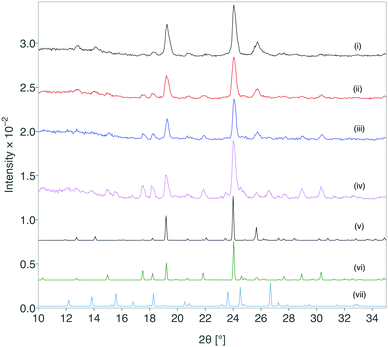
The creation of form III was successfully scaled up using this approach and 100 mg quantities have been reproducibly obtained with the lactose monohydrate system.** The stability of the obtained formulation was characterised by XRD immediately after formation and at periods throughout storage under standard ambient conditions for greater than 12 months (Fig. 4). After 12 months, form III shows partial transformation to other forms, but remarkably there was retention of form III over this time scale.
The design of an air-stable formulation for paracetamol form III has been developed with hyphenated thermo-spectroscopic and thermo-diffraction experiments. Scale-up of the process yields material that shows long-term stability for form III and is obtainable reproducibly, albeit in a mixture with other forms (for example, form II). Crucially, a match between the size of the sugar excipient molecule and functional group types of the surfaces of the form III crystals appears to be a major contribution to this stability. Therefore, an ‘active’ excipient template that stabilises solid state forms inaccessible under ambient conditions underpins this work. We aim to extend this approach and further develop predictive computational tools that offer a new approach in designing formulations of metastable forms in the future.
We thank Diamond Light Source for access to beamline I12 (EE-12735) the results from which contributed to the results presented.
Notes and references
- A. Llinas and J. M. Goodman, Drug Discovery Today, 2008, 13, 198–210 CrossRef PubMed
.
- D. Mangin, F. Puel and S. Veesler, Org. Process Res. Dev., 2009, 13, 1241–1253 CrossRef CAS
.
- G. Nichols and C. S. Frampton, J. Pharm. Sci., 1998, 87, 684–693 CrossRef CAS PubMed
.
- M.-A. Perrin, M. A. Neumann, H. Elmaleh and L. Zaske, Chem. Commun., 2009, 3181–3183 RSC
.
- P. Di Martino, P. Conflant, M. Drache, J. P. Huvenne and A. M. Guyot-Hermann, J. Therm. Anal., 1997, 48, 447–458 CrossRef CAS
.
- H. M. A. Ehmann and O. Werzer, Cryst. Growth Des., 2014, 14, 3680–3684 CAS
.
- J. C. Burley, M. J. Duera, R. S. Steina and R. M. Vrcelj, Eur. J. Pharm. Sci., 2007, 31, 271–276 CrossRef CAS PubMed
.
- J. B. Nanubolu and J. C. Burley, Mol. Pharmaceutics, 2012, 9, 1544–1558 CrossRef CAS PubMed
.
- A. Rossi, A. Savioli, M. Bini, D. Capsoni, V. Massarotti, R. Bettini, A. Gazzaniga, M. E. Sangalli and F. Giordano, Thermochim. Acta, 2003, 406, 55–67 CrossRef CAS
.
- S. Gaisford, A. B. M. Buanz and N. Jethwa, J. Pharm. Biomed. Anal., 2010, 53, 366–370 CrossRef CAS PubMed
.
- R. J. Davey, K. Allen, N. Blagden, W. I. Cross, H. Lieberman, M. J. Quayle, S. Righini, L. Seton and G. J. T. Tiddy, CrystEngComm, 2002, 257–264 RSC
.
-
J. Bernstein, Polymorphism in Molecular Crystals, Oxford University Press, 2007 Search PubMed
.
- E. Staab, L. Addadi, L. Leiserowitz and M. Lahav, Adv. Mater., 1990, 2, 40–43 CrossRef CAS
.
- R. Hiremath, S. Varney and J. Swift, Chem. Commun., 2004, 2676–2677 RSC
.
- E. H. Lee, S. R. Byrn and M. T. Carvajal, Pharm. Res., 2006, 23, 2375–2380 CrossRef CAS PubMed
.
- A. D. Gift, P. E. Luner, L. Luedeman and L. S. Taylor, J. Pharm. Sci., 2008, 97, 5198–5211 CrossRef CAS PubMed
.
- R. Dowling, R. J. Davey, R. A. Curtis, G. Han, S. K. Poornachary, P. S. Chow and R. B. H. Tan, Chem. Commun., 2010, 46, 5924 RSC
.
- J. F. Kauffman, L. M. Batykefer and D. D. Tuschel, J. Pharm. Biomed. Anal., 2008, 48, 1310–1315 CrossRef CAS PubMed
.
- A. Clout, A. B. M. Buanz, T. J. Prior, C. Reinhard, Y. Wu, D. O'Hare, G. R. Williams and S. Gaisford, Anal. Chem., 2016 Search PubMed
, submitted.
- A.C. Larson and R.B. Von Dreele, “General Structure Analysis System (GSAS)”, Los Alamos National Laboratory Report LAUR 86-748, 1994.
- C. C. Seaton and N. Blagden, ACA Trans., 2004, 39, 90–102 CAS
.
- A. Munroe, D. M. Croker, B. K. Hodnett and C. C. Seaton, CrystEngComm, 2011, 13, 5903–5907 RSC
.
- R. J. Davey, G. Sadiq, C. C. Seaton, R. G. Pritchard, G. Coquerel and C. Rougeot, CrystEngComm, 2014, 16, 4377–4381 RSC
.
- Y. V. Nelyubina, I. V. Glukhov, M. Yu. Antipin and K. Lyssenko, Chem. Commun., 2010, 46, 3469 RSC
.
- C. R. Groom, I. J. Bruno, M. P. Lightfoot and S. C. Ward, Acta Crystallogr., Sect. B: Struct. Sci., Cryst. Eng. Mater., 2016, 72, 171–179 CrossRef CAS PubMed
; F. H. Allen, Acta Crystallogr., Sect. B: Struct. Sci., 2002, 58, 380–388 CrossRef
.
- K. T. No, O. Y. Kwon, S. Y. Kim, K. H. Cho, C. N. Yoon, Y. K. Kang, K. D. Gibson, M. S. Jhon and H. A. Scheraga, J. Phys. Chem., 1995, 99, 13019–13027 CrossRef CAS
.
- D. Rappoport and F. Furche, J. Chem. Phys., 2010, 133, 134105 CrossRef PubMed
.
- S. Grimme, S. Ehrlich and L. Goerigk, J. Comput. Chem., 2011, 32, 1456–1465 CrossRef CAS PubMed
.
- S. Grimme, J. Antony, S. Ehrlich and H. Krieg, J. Chem. Phys., 2010, 132, 154104 CrossRef PubMed
.
- R. Storn and K. V. Price, J. Global Optim., 1997, 11, 341–359 CrossRef
.
-
K. V. Price, R. Storn and J. Lampinen, Differential Evolution: A Practical Approach to Global Optimization, Springer, London, UK, 2006 Search PubMed
.
Footnotes |
| † Electronic supplementary information (ESI) available: DSC and Raman spectra for all systems. Predicted morphologies for form I and III. See DOI: 10.1039/c6cc05006a |
| ‡ DSC data were collected using TA Instruments Q2000 DSC with a RCS 90 cooling system with the samples run in open Tzero aluminium pans. Approximately 6 mg of sample was used and each experiment was run in duplicate. This was coupled with a Renishaw Portable Raman Analyzer RX210 (785 nm laser, 100% laser power, 1 accumulation, 3 seconds exposure time) for the in situ DSC-Raman analysis. The optical probe of the system was held approximately 3 cm from the sample and a photo calorimetry accessory was used in place of the DSC lid to allow access to the sample but retaining accurate temperature control. During each DSC cycle, Raman spectra were collected every 3 °C. Powder X-ray diffraction data were collected using a Bruker D8 diffractometer in Bragg–Brentano θ−θ geometry with Cu Kα radiation (1.5418 Å) with a scintillation counter. Data were collected in the 2θ range 5 to 40° in steps of 0.05° with a 6 second count time. |
| § In situ XRD-DSC was undertaken using Beamline I12 of the Diamond Light Source. Full details of the apparatus will be reported elsewhere.19 In brief, a TA Instruments Q20 calorimeter was modified by drilling two holes in the furnace head to permit the X-ray beam to penetrate it. Samples of paracetamol/lactose (90/10 w/w, total mass ca. 20 mg) were then heated at 10 °C min−1 as for DSC-Raman work and 4 s diffraction patterns collected on a Thales Pixium RF4343 detector every 6 s. DSC data were analysed using the TA Instruments Universal Analysis software, and XRD data using in house routines. Rietveld refinements were performed using the GSAS and Topas Academic programmes.20 |
| ¶ The molecular modelling was carried out using the in-house program DEX.21–23 The crystal structures of paracetamol polymorphs (form I (HXACAN30),24 form II (HXACAN31)24 and form III (HXACAN29),4) were extracted from the CSD,25 energy minimised using the downhill simplex routine with in-house code using the potential described by No et al.26 using atomic point charges fitted to the electrostatic potential calculated for the isolated molecules in the program orca (mPW2PLYP-D3/def2-TZVPPD).27–29 The interaction energy between the crystal surface and a probe molecule was calculated in the same way and minimised using the differential evolution (DE) optimisation algorithm30,31 by alteration of the position and orientation of the probe molecule on the selected crystal surface. The parameters were constrained to lie in the range −5 to 5 Å for translations and −180 to 180° for the rotations. The control parameters for the DE algorithm (K, F, Gmax, Np) were set to 0.75, 0.75, 2000, 60. The underlying crystal surface was generated by slicing a 3 × 3 × 3 crystal block through the selected surface removing a 3 × 3 layer. |
| || Morphology predictions were carried out using BFDH and attachment energy methods. Dreiding and COMPASSII force fields were used with the relevant optimised crystal structure. Atomic point charges for the Dreiding force field were taken from the electrostatic fit carried out for the subsequent modelling. Resulting morphologies are presented in ESI.† |
| ** Production of form III at 100 mg scale was achieved by preparing a physical mix of form I paracetamol and lactose monohydrate (10% w/w) on a glass coverslip. This was subjected to a standard heating cycle (ambient to 180 °C at 10 °C min−1 (2 minute isotherm), followed by quench cooling to 0 °C and reheating to 110 °C at 10 °C min−1) in the cell in DSC. |
| This journal is © The Royal Society of Chemistry 2016 |


