Charge-reversal polymeric nanomodulators for ferroptosis-enhanced photodynamic therapy†
Xuelong
Yang
a,
Maomao
He
*a,
Yinghua
Li
a,
Tian
Qiu
a,
Jiexuan
Zuo
a,
Yixiao
Jin
a,
Jiangli
Fan
 ab,
Wen
Sun
 *ab and
Xiaojun
Peng
 a
a
aState Key Laboratory of Fine Chemicals, Frontiers Science Center for Smart Materials Oriented Chemical Engineering, Dalian University of Technology, Dalian 116024, China
bNingbo Institute of Dalian University of Technology, Ningbo 315016, China
First published on 11th June 2024
Abstract
The clinical application of photodynamic therapy (PDT) has some limitations including poor tumor targeting properties, a high reductive tumor microenvironment, and inefficient activation of single cell death machinery. We herein report pH-sensitive polymeric nanomodulators (NBS-PDMC NPs) for ferroptosis-enhanced photodynamic therapy. NBS-PDMC NPs were constructed using a positively charged type-I photosensitizer (NBS) coordinated with a demethylcantharidin (DMC)-decorated block copolymer via electrostatic interactions. NBS-PDMC NPs had a negative surface charge, which ensures their high stability in bloodstream circulation, while exposure to lysosomal acidic environments reverses their surface charge to positive for tumor penetration and the release of DMC and NBS. Under NIR light irradiation, NBS generated ROS to induce cell damage; in the meantime, DMC inhibited the expression of the GPX4 protein in tumor cells and promoted ferroptosis of tumor cells. This polymer design concept provides some novel insights into smart drug delivery and combinational action to amplify the antitumor effect.
Introduction
Photodynamic therapy (PDT) is an effective therapeutic modality for various cancer types, wherein photosensitizers (PSs) are administered to generate reactive oxygen species (ROS) under specific irradiation, destroying the tumor.1–3 Compared with traditional therapies, PDT demonstrates the advantages of less trauma, low toxicity, and high temporal and spatial selectivities.4–6 Despite having already reached clinical trials, there are still several issues to be focussed on including hypoxic and reductive tumor microenvironments (TMEs) and the poor tumor enrichment effect of small-molecule PSs in the implementation of tumor photodynamic therapy.7,8 Firstly, the hypoxic tumor microenvironment is an important reason for the limited PDT efficacy because of the oxygen requirement of the therapeutic process.9 In addition, tumor cells have strong antioxidant defense systems, including antioxidant enzymes that produce antioxidant proteins and substances.10,11 Among others, glutathione peroxidase 4 (GPX4), an antioxidant enzyme with reduced glutathione as a cofactor, is an important protectant against ferroptosis, which could eliminate oxidized phospholipids in cell membranes.12,13 The PDT efficiency is inherently weakened because the reductive TME can scavenge therapeutically generated ROS.14–16 Therefore, the limitations might be overcome through the development of high-performance PDT agents that effectively produce ROS and deplete GPX4 simultaneously.The hypoxic microenvironment of solid tumors significantly impedes ROS production through the type-II PDT process.17,18 In contrast, the O2˙− generated by type-I PDT can generate a hydroxyl radical with higher cytotoxicity through intracellular superoxide dismutase and Fe2+-mediated cascade catalytic reactions to enhance the PDT effect, while at the same time releasing oxygen, which can realize partial recycling of oxygen.19–22 Therefore, type-I PDT could lead to effective ROS generation and powerful PDT in solid tumors. To enhance the water solubility and tumor-targeting capabilities of small molecule photosensitizers, researchers have developed polymeric nanoparticles with superior biocompatibility and drug-loading capacity.23–26 The polymeric nanoparticle formulation of photosensitizers demonstrates an extended period of circulation in the bloodstream, potentially enabling their delivery to tumors through the mechanism of enhanced permeability and retention (EPR).27–30 Furthermore, polymer delivery systems that exhibit responsiveness to specific stimuli can be designed to precisely release agents that modulate tumor microenvironments, downregulate specific protein expression, mitigate undesirable side effects, and improve the efficacy of photodynamic therapy.
Herein, we report novel pH-sensitive polymeric nanomodulators (NBS-PDMC NPs) for multi-therapeutic agent delivery and enhanced photodynamic therapy (Scheme 1). In this polymer, the hydrophilic segment is polyethylene glycol (PEG) while the hydrophobic segment is polycarbonate decorated with demethylcantharidin (DMC). The DMC is an inhibitor of serine/threonine protein phosphatase 2A (PP2A) and GPX4 expression, which have great potential to achieve reductive TME regulation and enhance PDT effects.31–33 Importantly, the positively charged Nile blue with S-substitution (NBS), as the type-I photosensitizer, was coordinated with the amphiphilic block copolymer to form NBS-PDMC NPs via electrostatic interactions. Since NBS-PDMC NPs have a negative surface charge, it ensures their high stability in bloodstream circulation. Furthermore, the nanoparticles could be hydrolyzed under acid conditions, reversing their surface charge to positive and achieving optimal tumor penetration and the release of NBS and DMC. Under near-infrared (NIR) photoirradiation, NBS generated ROS to induce photodynamic damage in tumor cells. In the meantime, DMC inhibited the expression of the GPX4 protein to increase the LPO level, reversing the tumor suppressive microenvironment, and finally promoting ferroptosis in tumor cells. Such a combinational action amplified the antitumor effect of the NBS; therefore, the NBS-PDMC NPs could inhibit and ablate the tumors in mice more effectively than single PDT treatment. The polymeric nanomodulators provide a novel platform to facilitate tumor-specific drug delivery and enhanced photodynamic therapy.
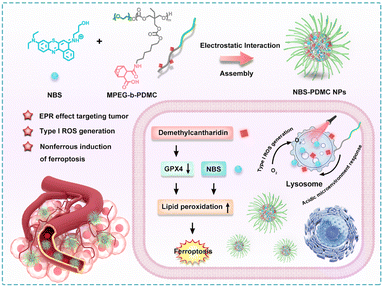 | ||
| Scheme 1 Schematic illustration of the design of NBS-PDMC NPs and the mechanism of ferroptosis-enhanced photodynamic therapy. | ||
Results and discussion
Preparation and characterization of NBS-PDMC NPs
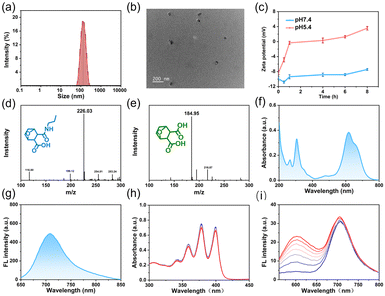
NBS-PDMC NPs were prepared via (i) the construction of DMC-functionalized PEGylated-polycarbonate (MPEG-b-PDMC) and (ii) the coordination of NBS to MPEG-b-PDMC (Scheme S1, ESI†). Firstly, the Boc-containing carbonate monomer (TMC-Boc) was synthesized via transesterification with 6-(Boc-amino)-1-hexanol and TMPIC. Using MPEG as the macroinitiator, MPEG-b-PTMC-Boc was synthesized by ring-opening polymerization (ROP) of TMC-Boc.34 After deprotection with TFA, the proton peak corresponding to the tert-butyl unit of the Boc group (1.43 ppm) completely disappeared, indicating that free amine groups were activated (Fig. S7, ESI†). Finally, the pH-responsive polymer was obtained through a one-step ring-opening reaction between the amine group and norcantharidin. As control, MPEG-b-PTMC was reacted with succinic anhydride (SA) to form MPEG-b-PSA. The NBS was also synthesized based on previously reported methods.19,28 All target compounds and intermediates underwent comprehensive characterization through mass spectrometry (MS) and nuclear magnetic resonance (NMR) spectroscopy (Fig. S1–S12, ESI†). Using the 1H NMR spectrum, the calculated molecular weight of MPEG-b-PDMC was 12 kg mol−1, and the drug loading content of DMC was 23.1% (Fig. S8, ESI†). The high-content DMC in MPEG-b-PDMC is expected to enhance therapeutic efficiency. The carboxyl groups in the side chain make the MPEG-b-PDMC negatively charged. Therefore, the positively charged NBS and MPEG-b-PDMC could be assembled into NBS-PDMC NPs through electrostatic interactions.35,36 To optimize the nanoparticle formulation, NBS-PDMC NPs with different polymer-to-NBS weight ratios were evaluated. When this ratio was 10, the particle size and the morphology of NBS-PDMC NPs were relatively uniform. The control nanoparticles (NBS-PSA NPs) were also prepared using similar processes.The dynamic light scattering (DLS) measurements revealed that the hydrodynamic diameter of the NBS-PDMC NPs was 160 nm (Fig. 1a). The NBS-PDMC NPs exhibited spherical morphologies under TEM observation (Fig. 1b). Moreover, the size of nanoparticles did not change after a week in PBS, confirming the excellent colloidal stability of NBS-PDMC NPs (Fig. S13, ESI†). The nanoparticles also showed good stability in blood circulation since their zeta potentials were around −10.8 mV (Fig. 1c). To investigate the pH response of NBS-PDMC NPs, we measured the zeta potential under physiological conditions (pH 7.4) and acidic phosphate buffers (pH 5.4). After 8 h of incubation at pH 7.4, NBS-PDMC NPs retained zeta potential almost unchanged at −7.6 mV. In contrast, the zeta potential increased and transformed into positively charged within 4 h and finally became +3.5 mV after 8 h at pH 5.4 (Fig. 1c). The acid-triggered hydrolysis of β-carboxylic acid amides in MPEG-b-PDMC was tracked using 1H NMR spectra at pH 5.4, in which the CH2NHCO peak at δ 2.99 ppm gradually decreased and the CH2NH2 peak at δ 2.84 ppm increased, indicating the hydrolysis of the amide linker and release of DMC (Fig. S14, ESI†). Subsequently, we also investigated the structural changes of the carbonate block copolymer at pH 5.4 using 1H NMR spectra recorded at different times. The polymer did not change, indicating that the carbonate bonds had good stability under acidic conditions (Fig. S15, ESI†), which is in agreement with the results from previous studies.37 At the same time, we developed a hydrolysis model of DMC-linked propylamine.38 The mass peak of this model moved from 226.03 to 184.95 after 12 h at pH 5.4 (Fig. 1d and e). However, there were no changes in the mass peak of the control SA-linked propylamine (Fig. S16, ESI†). These results suggest that the hydrolysis of amide bonds resulted in protonation of the remaining amines on the surface of NBS-PDMC NPs and the release of DMC under acidic conditions (Fig. 1d and e).
The NBS-PDMC NPs had an absorption peak at 660 nm and an emission peak at 710 nm (Fig. 1f and g), which lies in the “therapeutic window” (600–900 nm), suggesting their great potential for application in in vivo diagnosis and PDT.39 The generation of ROS by NBS-PDMC NPs under 660 nm light irradiation was monitored using 9, 10-anthracenyl-bis(methylene) dimalonic acid (ABDA) and dihydroethidium (DHE) as indicators. Along with the irradiation time, the absorption of ABDA decreased slowly, and the DHE fluorescent probe at 510 nm displayed remarkable fluorescence enhancement (Fig. 1h and i), indicating that NBS-PDMC NPs had good ability to produce O2˙− as effective type-I nanophotosensitizers.
Cellular uptake and cytotoxicity of NBS-PDMC NPs
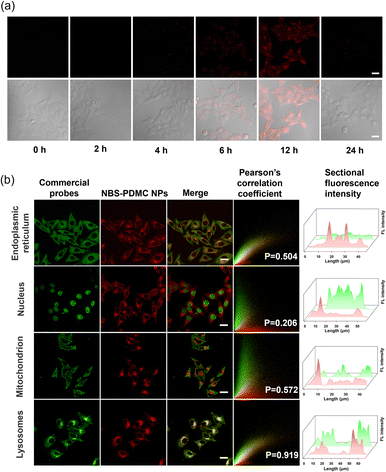
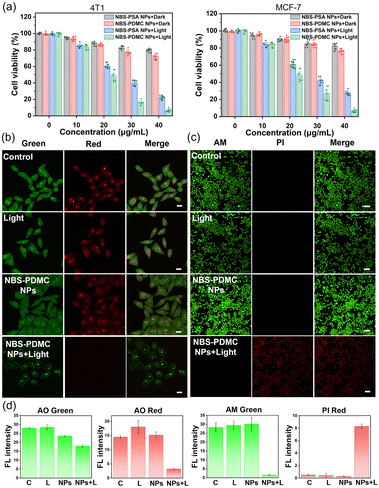
The uptake of NBS-PDMC NPs by MCF-7 cells was analyzed using CLSM. With the extension of the incubation time, the intracellular red fluorescence gradually enhanced, and became strongest after 12 h of incubation (Fig. 2a), indicating that nanoparticles were efficiently internalized by the tumor cells. To track the subcellular distribution of nanoparticles, MCF-7 cells were incubated with NBS-PDMC NPs for some time and then co-incubated with commercial organelle positioning dyes after PBS cleaning. According to the fluorescence cross-section analysis and Pearson's coefficient for subcellular localization imaging, the Pearson's coefficient of the nanoparticles overlapped with that of the lysosomal Tracker (Pearson's coefficient = 0.919), which is much higher than those of the Mito Tracker in mitochondria (Pearson's coefficient = 0.572), the ER Tracker in the endoplasmic reticulum (Pearson's coefficient = 0.504), and Hoechst in the nucleus (Pearson's coefficient = 0.206) (Fig. 2b), indicating that the nanoparticles mainly enter the lysosomes. The NBS-PDMC NPs entering into cells via nanoparticle-mediated endocytosis end up in lysosomes, which would be activated to release therapeutic agents by the lysosomal acidic environment.Next, the in vitro antitumor potency of NBS-PDMC NPs against different cell lines (4T1, MCF-7, and HepG2 cells) was investigated through the MTT assay (Fig. 3a and Fig. S17, ESI†). Under dark conditions, no significant cytotoxicity was observed after treatment with NBS-PDMC NPs, as the cell viability of 4T1 cells remained at about 80% even at nanoparticle concentrations as high as 40 μg mL−1, indicating that NBS-PDMC NPs show excellent biological safety. Furthermore, the cell viability cultured with NBS-PDMC NPs was significantly reduced in a concentration-dependent manner under light irradiation (660 nm, 10 mW cm−2, 4 min). Under light irradiation, the NBS-PDMC NPs demonstrated half-maximal inhibitory concentrations (IC50) of 19.08 and 18.97 μg mL−1 on 4T1 and MCF-7 cells, respectively, which had better inhibition than single PDT (Table S1, ESI†). However, the effect was not particularly obvious for the human liver cancer (HepG2) cells with intrinsic drug resistance (Fig. S17, ESI†). MPEG-b-PDMC shows synergistic effects with NBS against breast cancer cells, as the calculated CI values of NBS-PDMC NPs under light irradiation were 0.83 and 0.81 (Fa = 0.5) against 4T1 and MCF-7, suggesting that NBS-PDMC NPs had great potential in breast cancer treatment.
Furthermore, the acridine orange (AO) was used to demonstrate that NBS-PDMC NPs caused lysosome destruction. As can be seen from fluorescence images, the lysosome integrity was severely diminished after being treated with NBS-PDMC NPs and 660 nm light irradiation (Fig. 3b). There was also significant shrinkage of the nucleus volume. Furthermore, the cytotoxicity of NBS-PDMC NPs was visually evaluated through live and dead cell staining. There was only green fluorescence in all sole groups, demonstrating that NBS-PDMC NPs and 660 nm light irradiation did not cause notable cytotoxicity. Nonetheless, the presence of red fluorescence in MCF-7 cells treated with NBS-PDMC NPs and 660 nm light irradiation indicated the complete eradication of the tumor cells (Fig. 3c and d). Thus, the combination of consecutive pH-triggered drug release and enhanced PDT demonstrated a significantly improved therapeutic effect.
The mechanism of cell death caused by NBS-PDMC NPs
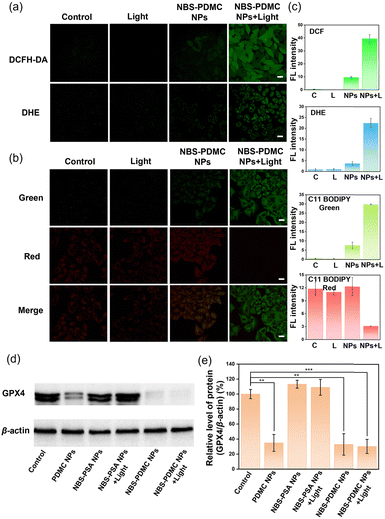
Initially, we examined the production of ROS in cells of NBS-PDMC NPs to determine the mechanism of cell death. 2′,7′-Dichlorodihydrofluorescein diacetate (DCFH-DA) is a commercially available fluorescent probe to detect intracellular ROS. DHE is a commonly used fluorescence detection probe to detect intracellular O2˙−. From cell staining images and fluorescence quantification of DCFH-DA and DHE, it could be seen that both NBS-PDMC NPs under 660 nm light irradiation showed significantly enhanced fluorescence in different degrees compared with other groups (Fig. 4a and c), suggesting that the NBS-PDMC NPs could efficiently produce cytotoxic ROS for PDT. The GSH level was determined using the cellular glutathione detection assay kit. The results proved that GSH in the cells treated with NBS-PDMC NPs and light irradiation was significantly lower than that in the control group because of the massive production of ROS (Fig. S18, ESI†).Among the factors that cause cellular oxidative stress, lipid peroxidation is an important regulator of cell fate, and widespread lipid peroxidation occurs through a mode known as ferroptosis. C11 BODIPY 581/591 was used as a lipid peroxidation (LPO) probe to observe the level of intracellular LPO and ferroptosis, which could be evaluated by the change of green fluorescence. Compared with other groups, in cells treated with NBS-PDMC NPs and light irradiation, the green fluorescence channel was significantly enhanced (Fig. 4b and c), indicating that significant lipid peroxidation occurred. The inactivation of GPX4 could result in the accumulation of lipid peroxides, which was a crucial indication of ferroptosis. To investigate the inhibition of GPX4, the western blotting experiment revealed the intracellular GPX4 protein expression in cancer cells between different groups. Compared with the NBS-PSA NP group, GPX4 protein expression was significantly down-regulated in both the PDMC NP group and the NBS-PDMC NP group (Fig. 4d and e), indicating that down-regulation of GPX4 was an important cause of intracellular LPO outbreak, which induced ferroptosis in cancer cells, thus amplifying the antitumor effect.
In vivo evaluation of the antitumor effect of NBS-PDMC NPs
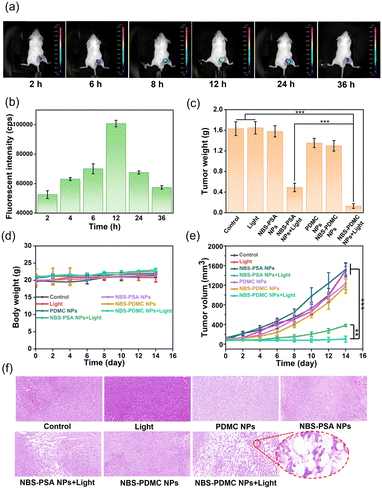
At the cellular level, NBS-PDMC NPs showed excellent therapeutic efficacy, prompting us to investigate their antitumor effect in vivo. Before the antitumor experiment, fluorescence imaging was used to determine the optimal time point for phototherapy. After injection of NBS-PDMC NPs into tumor-bearing mice, the fluorescence of tumor sites was enhanced with time and reached the highest point at 12 h after injection, and then the fluorescence gradually weakened and disappeared at 36 h (Fig. 5a and b), indicating that light irradiation 12 h after injection could be the optimal timing. Moreover, the mice were sacrificed 12 h later and the major organs were imaged, indicating that the nanoparticles were mainly distributed in the tumor (Fig. S19, ESI†). Thus, NBS-PDMC NPs could accumulate at the tumor site, which would be beneficial to achieve good tumor suppression performance.The in vivo antitumor activity was further investigated by intravenously injecting NBS-PDMC NPs into tumor-bearing mice and then irradiating under 660 nm light (150 mW cm−2,10 min). Seven parallel experiments were set up at the same time conducted as follows: (1) injection of phosphate-buffered saline (PBS), (2) injection of PBS and light treatment, (3) injection of NBS-PSA NPs, (4) injection of NBS-PSA NPs and light treatment, (5) injection of PDMC NPs and light treatment, (6) injection of NBS-PDMC NPs, and (7) injection of NBS-PDMC NPs and light treatment. To evaluate their antitumor performance, the tumor volumes were recorded every two days. Within 14 days, the tumor volume of both PBS groups and all dark treatment groups increased rapidly. Among them, the PDMC NP group and the NBS-PDMC NP group with dark treatment showed a little bit of tumor inhibition ability due to the presence of DMC. Due to inefficient activation of single cell death machinery, the tumor volume of the NBS-PSA NP group showed obvious rebound after certain inhibition effects. In stark contrast to all the other groups, the tumor volume had been effectively suppressed in the NBS-PDMC NPs + light group (Fig. 5e and Fig. S20, ESI†). Furthermore, the LPO and GPX4 levels were determined in vivo. Compared with the control group, LPO was significantly up-regulated and GPX4 was down-regulated in the NBS-PDMC NPs + light group (Fig. S21 and S22, ESI†). The tumor inhibition rate could reach 88.56% in the NBS-PDMC NPs + light group, suggesting that the ferroptosis-enhanced PDT inhibited tumor growth efficiently (Fig. 5c and Fig. S23, S24, ESI†). Following the two weeks of treatment, tumor tissues were collected for hematoxylin and eosin (H&E) staining to further evaluate the antitumor activity. In the NBS-PDMC NPs + light group, significant tumor cell nuclear ablation was observed by H&E staining (Fig. 5f). Together, these findings confirmed that NBS-PDMC NPs had excellent tumor accumulation and enhanced antitumor activity.
Since the nanomedicine would be used in vivo, the biosafety assessment of the NBS-PDMC NPs was critical. Based on our design, the use of aliphatic polycarbonates, which were mainly degraded into carbon dioxide and water, for drug delivery would have good biosafety. The biosafety was investigated by monitoring body weights, blood routine examinations, and evaluating the H&E staining of the main organs of mice. There was no significant change in the body weight in all groups during treatment (Fig. 5d). Moreover, from HE staining of the major organs, the treated groups showed no signs of hemorrhage, inflammatory cell infiltration, or changes in the physiological morphology (Fig. S25, ESI†). The main indicators of blood routine were also within the safe range (Fig. S26, ESI†). These results together proved the excellent biosafety of the NBS-PDMC NPs in vivo.
Conclusions
In summary, we constructed pH-sensitive NBS-PDMC NPs for GPX4-inhibited and ferroptosis-enhanced photodynamic therapy. The nanosized drug delivery strategies enhanced cellular uptake and tumor accumulation of NBS. The presence of a negative charge on the surface of NBS-PDMC NPs facilitated the stability of blood circulation, while the subsequent charge reversal promoted enhanced tumor penetration and the release of DMC and NBS. Under NIR light irradiation, ROS produced by nanoparticles could induce LPO and eliminate tumor cells. Meanwhile, inhibition of GPX4 by DMC increased the level of LPO in cells, inducing ferroptosis in cancer cells and synergistically enhancing the PDT effect. Compared with the single treatment mode, these above experiments showed that the GPX4-inhibited photodynamic synergistic treatment mode has better inhibition and ablation ability for tumors in mice. Moreover, the NBS-PDMC NPs demonstrated high biocompatibility and biological safety. This design of polymeric nanomodulators opened up a new window for constructing smart delivery platforms with excellent antitumor efficacy and biosafety.Experimental section
Synthesis of the TMC-Boc monomer
In a round-bottom flask, TMPIC (1.00 g, 5.74 mmol), 6-(Boc-amino)-1-hexanol (1.87 g, 8.61 mmol), and CsF (18 mg, 0.11 mmol) were added. Subsequently, 25 mL of acetone was added under argon and further vortexed for 24 h at 20 °C. Filtration removed the insoluble substances in the reaction system, which were then concentrated and treated with column chromatography (dichloromethane/ethyl acetate = 3/1) to obtain white crystals with a 61.9% yield.Synthesis of polyethylene glycol–polycarbonate (MPEG-b-PTMC-Boc)
In a nitrogen-filled glovebox, MPEG (0.601 g, 0.12 mmol), TMC-Boc (1.16 g, 3.0 mmol), and TU (55 mg, 0.15 mmol) were added to a 50 mL round-bottom flask. Then, 6 mL of THF (0.5 M) and DBU (15 μL, 0.10 mmol) were added and stirred at 30 °C for 24 h. Afterward, the solution was precipitated in diethyl ether and the solid was collected following centrifugation. This process was repeated twice to obtain MPEG-b-PTMC-Boc with a yield of 76.2%.Deprotection of MPEG-b-PTMC-Boc
Under a nitrogen atmosphere, MPEG-b-PTMC-Boc (0.55 g, 0.05 mmol) was dissolved in 5 mL of trifluoroacetic acid (TFA) and 5 mL of dichloromethane (DCM) at 0 °C. The mixture was further stirred at room temperament for 1 h. The product was concentrated and redissolved in 5 mL of deionized water, then dialyzed (MW cutoff, 1000 Da) for 24 h, and lyophilized to afford an 89.7% yield of MPEG-b-PTMC.Synthesis of MPEG-b-PDMC
MPEG-b-PTMC (95 mg, 0.01 mmol), DMC (4.2 mg, 0.025 mmol), and dimethyl aminopyridine (DMAP) (0.61 mg, 0.005 mmol) were dissolved in 5 mL of N,N-dimethylformamide (DMF), and the resulted solution was kept stirring at 55 °C for 12 h. Then, the solvent was concentrated and precipitated with excessive diethyl ether. The obtained precipitate was dried under vacuum to obtain MPEG-b-PDMC with a yield of 84.6%.Synthesis of NBS
3-(Naphthalen-1-ylamino) propane-1-ol (298 mg, 1 mmol) was condensed with Bunted salt (sodium N-[2-amino-5-(diethylamino)-phenyl] sulfanesulfin-iperoxoate) (200 mg, 1 mmol) with silver carbonate to obtain the NBS. After column chromatography (dichloromethane/methanol = 3/1), the NBS was obtained as a blue solid with a yield of 60.1%.Preparation of NBS-PDMC NPs
NBS-PDMC NPs were prepared by self-assembly methodology. In particular, 0.2 mL of THF containing 10 mg of MPEG-b-PDMC and 1 mg of NBS was added dropwise into 1 mL of water and stirred for 30 min. In the following 48 h, the blue solution was dialyzed (MW cutoff, 3500 Da) against deionized water to remove organic solvents. The NBS-PSA NPs were prepared from NBS and MPEG-b-PSA using the sample method.Cellular uptake
MCF-7 cells were seeded at a density of 1 × 10⁵ cell per mL in a confocal culture dish overnight. The medium was replaced by a fresh medium containing 40 μg mL−1 NBS-PDMC NPs. The cells were incubated at different time periods. Images of live cells were taken using a confocal laser scanning microscope (CLSM, Ex/Em = 660/710 nm).Colocalization analysis
In colocalization analysis, MCF-7 cells were cultured in a confocal dish for 24 h. Then, 40 μg mL−1 NBS-DMC NPs were added and incubated for 12 h under standard conditions; subsequently, the medium was removed and washed twice. The commercial localization probe Lyso Tracker (Ex/Em = 443/505 nm), Mito Tracker (Ex/Em = 490/516 nm), ER Tracker (Ex/Em = 504/511 nm), and Hoechst (Ex/Em = 340/510 nm) were added and the cells were incubated for the specified time. The cells were washed twice and the position of each group and fluorescence intensity were observed using the CLSM.MTT assay
The 4T1, MCF-7, and HepG2 cells were diluted in a single-cell suspension containing 5 × 10⁴ cells per mL and seeded in 96-well plates, and the surrounding 32 wells were incubated in PBS buffer for 24 h. After this, NBS-PSA NPs and NBS-PDMC NPs (0–40 μg mL−1) were added and incubated for 12 h and then the cells were irradiated (660 nm, 10 mW cm−2) for 4 min, followed by 12 h incubation. The MTT assay was used to determine the cell viability.Live and dead cell staining
In a confocal dish, MCF-7 cells were cultured until imaging was possible. NBS-PDMC NPs (40 μg mL−1) were incubated for 12 h. Then, the cells were stained with a live/dead fixable stain kit for 0.5 h after irradiation (660 nm, 10 mW cm−2,10 min), and each group was observed using the CLSM (green channel, Ex/Em = 490/515 nm; red channel, Ex/Em = 535/617 nm).Detection of lysosome injury
Lysosome injury was assessed using acridine orange (AO). The cells were incubated with NBS-DMC NPs (40 μg mL−1) for 12 h and then incubated with AO (5 μM) for 30 min and washed with PBS twice. After the cells were treated with light (660 nm, 10 mW cm−2, 4 min) or in the dark, the experimental group was observed using the CLSM (green channel, Ex/Em = 488/530 nm; red channel, Ex/Em = 488/640 nm).Detection of intracellular ROS
The fluorescent probes DCFH-DA and DHE were used for detecting intracellular ROS. Specifically, MCF-7 cells were incubated with the medium containing 40 μg mL−1 NBS-PDMC NPs for 12 h and then incubated with DCFH-DA (2 μM) and DHE (10 μM) for another 30 min. After this, specific groups were irradiated (660 nm, 10 mW cm−2) for 4 min. Subsequently, the cells were washed with PBS, followed by confocal fluorescence imaging (DCF, Ex/Em = 502/530 nm; DHE, Ex/Em = 535/610 nm).Detection of lipid peroxidation
To assess the LPO, the BODIPY (581/591)-C11 probe was used. Above all, NBS-DMC NPs (20 μg mL−1) were incubated with MCF-7 cells for 12 h. Following irradiation with a LED light (660 nm, 10 mW cm−2, 4 min), the MCF-7 cells were stained with C11-BODIPY (581/591). The CLSM was used to observe intracellular fluorescence (green channel, Ex/Em = 500/510 nm; red channel, Ex/Em = 581/591 nm).Detection of GSH
To assess the GSH levels, the monochlorobimane probe was used. Above all, NBS-DMC NPs (20 μg mL−1) were incubated with MCF-7 cells for 12 h. Following irradiation with a LED light (660 nm, 10 mW cm−2, 4 min), the MCF-7 cells were incubated with monochlorobimane. The CLSM was used to observe intracellular fluorescence (Ex/Em = 380/460 nm).Western blot
The expression of GPX4 was analyzed using the western blot. The MCF-7 cells were incubated with NBS-PSA NPs (20 μg mL−1), PDMC NPs (20 μg mL−1), and NBS-PDMC NPs (20 μg mL−1) for 12 h and then treated with light (660 nm, 10 mW cm−2, 4 min) or in the dark. After the cells were kept on ice with RIPA lysis buffer, the supernatant was centrifuged at 12![[thin space (1/6-em)]](https://www.rsc.org/images/entities/char_2009.gif) 000 rpm for 5 min to obtain the total protein. SDS-PAGE followed by PVDF membrane transfer isolated the proteins. The PVDF membrane was sealed with a western sealing fluid and then incubated overnight with anti-GPX4 and anti-actin antibodies, followed by secondary antibodies. Chemiluminescence was used to detect β-actin and GPX4 expression.
000 rpm for 5 min to obtain the total protein. SDS-PAGE followed by PVDF membrane transfer isolated the proteins. The PVDF membrane was sealed with a western sealing fluid and then incubated overnight with anti-GPX4 and anti-actin antibodies, followed by secondary antibodies. Chemiluminescence was used to detect β-actin and GPX4 expression.
Animals and tumor models
To establish a model of 4T1 tumor-bearing mice, 1 × 10⁶ 4T1 cells were injected subcutaneously into the right flank region. The tumor volume of 4T1 tumor-bearing mice was calculated using: A = b × c2/2 (a: length; b: width).In vivo fluorescence imaging
NBS-PDMC NPs were used to evaluate the in vivo distribution in 4T1 tumor-bearing mice. After tail vein injection of 100 μL of NBS-PDMC NPs (2 mg mL−1), an imaging system (IVIS Lumina imaging system) was used to optically image mice under general anesthesia at different time points (Ex/Em = 660/710 nm).In vivo antitumor evaluation
After tumors reached 100 mm3 in volume, the mice were separated into 7 groups with 5 mice in each group. The mice were intravenously injected with (1) PBS (150 μL), (2) PBS (150 μL) with irradiation, (3) PDMC NPs (150 μL, 2 mg mL−1), (4) NBS-PSA NPs (150 μL, 2 mg mL−1), (5) NBS-PSA NPs (150 μL, 2 mg mL−1) with irradiation, (6) NBS-PDMC NPs (150 μL, 2 mg mL−1), and (7) NBS-PDMC NPs (150 μL, 2 mg mL−1) with irradiation. Light irradiation (660 nm, 150 mW cm−2, 10 min) for the light group was carried out after 12 h injection. The mice weight and tumor size were recorded every other day over two weeks. Following the treatment, all mice were euthanized, and their major organs and tumor samples were gathered for examination and immunofluorescence staining.In vivo LPO and GPX4 levels
After the completion of treatment, all mice were sacrificed and the tumors were subject to immunofluorescence staining to evaluate the levels of LPO and GPX4 in vivo.Biosafety evaluation by H&E staining and blood routine tests
After the completion of treatment, all mice were sacrificed, and the main organs and tumors were subject to H&E staining to evaluate the tissue damage and inflammation. Blood samples of mice were collected for routine blood tests to further evaluate the biosafety of NBS-PDMC NPs.Ethics statement
All protocols for animal studies conformed to the Guide for the Care and Use of Laboratory Animals and approved by the Dalian University of Technology Animal Care and Use Committee (DUT20230416).Data availability
The ESI† includes materials and instrumentation, experimental methods, synthesis, cytotoxicity, and characterization data.Author contributions
Conceptualization: W. Sun, X. Yang, and M. He; methodology: X. Yang and M. He; formal analysis: X. Yang, H. Li, T. Qiu, J. Zuo and Y. Jin; investigation: X. Yang and M. He; supervision: W. Sun and M. He; project administration: W. Sun and M. He; writing – original draft: X. Yang and M. He; and writing – review and editing: J. Fan, W. Sun and X. Peng.Conflicts of interest
There are no conflicts to declare.Acknowledgements
This work was financially supported by the National Science Foundation of China (22078046), the Fundamental Research Fundamental Funds for the Central Universities (DUT22LAB601), the Liaoning Binhai Laboratory (LB-2023-03), and the China Postdoctoral Science Foundation (2023M740487).References
- S. Son, J. H. Kim, X. Wang, C. Zhang, S. A. Yoon, J. Shin, A. Sharma, M. H. Lee, L. Cheng, J. Wu and J. S. Kim, Chem. Soc. Rev., 2020, 49, 3244–3261 RSC.
- M. Abbas, Q. Zou, S. Li and X. Yan, Adv. Mater., 2017, 29, 1605021 CrossRef PubMed.
- J. Tian, B. Huang, M. H. Nawaz and W. Zhang, Coord. Chem. Rev., 2020, 420, 213410 CrossRef CAS.
- R. Xing, Q. Zou, C. Yuan, L. Zhao, R. Chang and X. Yan, Adv. Mater., 2019, 31, 1900822 CrossRef PubMed.
- W. Kang, Y. Shi, Z. Yang, X. Yin, Y. Zhao, L. Weng and Z. Teng, RSC Adv., 2023, 13, 5609–5618 RSC.
- Z. Liu, T. Cao, Y. Xue, M. Li, M. Wu, J. W. Engle, Q. He, W. Cai, M. Lan and W. Zhang, Angew. Chem., Int. Ed., 2020, 59, 3711–3717 CrossRef CAS PubMed.
- L. Ke, F. Wei, L. Xie, J. Karges, Y. Chen, L. Ji and H. Chao, Angew. Chem., Int. Ed., 2022, 61, 202205429 CrossRef PubMed.
- J. Zhang, B. Zhao, S. Chen, Y. Wang, Y. Zhang, Y. Wang, D. Wei, L. Zhang, G. Rong, Y. Weng, J. Hao, B. Li, X.-Q. Hou, X. Kang, Y. Zhao, F. Wang, Y. Zhao, Y. Yu, Q.-P. Wu, X.-J. Liang and H. Xiao, ACS Nano, 2020, 14, 14831–14845 CrossRef CAS PubMed.
- S. Zhang, M. Li, J. Wang, Y. Zhou, P. Dai, M. Zhao, W. Lv, S. Liu and Q. Zhao, Bioconjugate Chem., 2023, 34, 1327–1335 CrossRef CAS PubMed.
- Y. Jiang, H. Lu, X. Yuan, Y. Zhang, L. Lei, Y. Li, W. Sun, J. Liu, D. Scherman and Y. Liu, J. Mater. Chem. B, 2022, 10, 8082–8093 RSC.
- S. Wang, Y. Pan, Y. Qu, X. Chen, N. Shao, L. Y. Niu and Q. Z. Yang, Smart Mol., 2024, 1, 20230024 CrossRef.
- D. Huang, H. Huang, M. Li, J. Fan, W. Sun, J. Du, S. Long and X. Peng, Adv. Funct. Mater., 2022, 32, 2208105 CrossRef CAS.
- M. Wang, F. Li, T. Lu, R. Wu, S. Yang and W. Chen, Mater. Des., 2022, 224, 111403 CrossRef CAS.
- H. Wang, C. Qiao, Q. Guan, M. Wei and Z. Li, Asian J. Pharm. Sci., 2023, 18, 100829 CrossRef PubMed.
- L. Zhao, S. Chen, R. R. Zheng, X. Rao, R. Kong, C. Huang, Y. Liu, Y. Tang, H. Cheng and S. Li, ACS Appl. Mater. Interfaces, 2022, 14, 53501–53510 CrossRef CAS PubMed.
- Q. Hu, W. Zhu, J. Du, H. Ge, J. Zheng, S. Long, J. Fan and X. Peng, Chem. Sci., 2023, 14, 9095–9100 RSC.
- X. Meng, Y. Han, S. Wang, X. Wang, Z. Zhang, S. Yao, X. Wan, Z. Liu, Z. Ge and L. Li, Nano Today, 2023, 53, 102030 CrossRef CAS.
- Y. Wan, L. H. Fu, C. Li, J. Lin and P. Huang, Adv. Mater., 2021, 33, 2103978 CrossRef CAS PubMed.
- M. Li, J. Xia, R. Tian, J. Wang, J. Fan, J. Du, S. Long, X. Song, J. W. Foley and X. Peng, J. Am. Chem. Soc., 2018, 140, 14851–14859 CrossRef CAS PubMed.
- S. Jiang, M. Xiao, W. Sun, D. Crespy, V. Mailander, X. Peng, J. Fan and K. Landfester, Angew. Chem., Int. Ed., 2020, 59, 20008–20016 CrossRef CAS PubMed.
- K. X. Teng, L. Y. Niu and Q. Z. Yang, Chem. Sci., 2022, 13, 5951–5956 RSC.
- K. X. Teng, W. K. Chen, L. Y. Niu, W. H. Fang, G. Cui and Q. Z. Yang, Angew. Chem., Int. Ed., 2021, 60, 19912–19920 CrossRef CAS PubMed.
- H. B. Cheng, X. Cao, S. Zhang, K. Zhang, Y. Cheng, J. Wang, J. Zhao, L. Zhou, X. J. Liang and J. Yoon, Adv. Mater., 2022, 35, 2207546 CrossRef PubMed.
- X. Zhang, D. Li, J. Huang, K. Ou, B. Yan, F. Shi, J. Zhang, J. Zhang, J. Pang, Y. Kang and J. Wu, J. Mater. Chem. B, 2019, 7, 251–264 RSC.
- M. He, F. Chen, D. Shao, P. Weis, Z. Wei and W. Sun, Biomaterials, 2021, 275, 120915 CrossRef CAS PubMed.
- M. He, R. Wang, P. Wan, H. Wang, Y. Cheng, P. Miao, Z. Wei, X. Leng, Y. Li, J. Du, J. Fan, W. Sun and X. Peng, Biomacromolecules, 2022, 23, 1733–1744 CrossRef CAS PubMed.
- S. Jia, S. Wang, S. Li, P. Hu, S. Yu, J. Shi and J. Yuan, J. Mater. Chem. B, 2021, 9, 3180–3191 RSC.
- M. He, R. Wang, R. Zhang, P. Miao, P. Wang, Z. Wei, X. Leng, Y. Li, J. Fan, X. Peng and W. Sun, Adv. Funct. Mater., 2023, 33, 2300780 CrossRef CAS.
- D. Hu, M. Pan, Y. Yang, A. Sun, Y. Chen, L. Yuan, K. Huang, Y. Qu, C. He, Q. Wei and Z. Qian, Adv. Funct. Mater., 2021, 31, 2104473 CrossRef CAS.
- W. Wang, F. Yang, L. Zhang, M. Wang, L. Yin, X. Dong, H. Xiao and N. Xing, Adv. Mater., 2023, 36, 2308762 CrossRef PubMed.
- Y. Wu, D. Zhou, Q. Zhang, Z. Xie, X. Chen, X. Jing and Y. Huang, Biomacromolecules, 2016, 17, 2650–2661 CrossRef CAS PubMed.
- J. Xiang, K. Liu, H. Xu, Z. Zhao, Y. Piao, S. Shao, J. Tang, Y. Shen and Z. Zhou, Adv. Sci., 2023, 10, 2301216 CrossRef CAS PubMed.
- X. Zhu, X. Chen, L. Qiu, J. Zhu and J. Wang, Oncol. Lett., 2022, 24, 1–11 Search PubMed.
- M. He, G. He, P. Wang, S. Jiang, Z. Jiao, D. Xi, P. Miao, X. Leng, Z. Wei, Y. Li, Y. Yang, R. Wang, J. Du, J. Fan, W. Sun and X. Peng, Adv. Sci., 2021, 8, 2103334 CrossRef CAS PubMed.
- S. Li, Q. Zou, Y. Li, C. Yuan, R. Xing and X. Yan, J. Am. Chem. Soc., 2018, 140, 10794–10802 CrossRef CAS PubMed.
- S. Li, R. Chang, L. Zhao, R. Xing, J. C. Hest and X. Yan, Nat. Commun., 2023, 14, 5227 CrossRef CAS PubMed.
- J. H. Jung, M. Ree and H. Kim, Catal. Today, 2006, 115, 283–287 CrossRef CAS.
- S. He, J. li, P. Cheng, Z. Zeng, C. Zhang, H. Duan and K. Pu, Angew. Chem., Int. Ed., 2021, 60, 19355–19363 CrossRef CAS PubMed.
- Z. Xie, T. Fan, J. An, W. Choi, Y. Duo, Y. Ge, B. Zhang, G. Nie, N. Xie, T. Zheng, Y. Chen, H. Zhang and J. S. Kim, Chem. Soc. Rev., 2020, 49, 8065–8087 RSC.
Footnote |
| † Electronic supplementary information (ESI) available. See DOI: https://doi.org/10.1039/d4tb00616j |
| This journal is © The Royal Society of Chemistry 2024 |


