 Open Access Article
Creative Commons Attribution 3.0 Unported Licence
One-pot reductive liquefaction of sawdust to renewables over MoOx–Al2O3 variants: insight into structure–activity relationships†
Muhammad Abdus
Salam
a,
Quoc Khanh
Tran
a,
Phuoc Hoang
Ho
 a,
You Wayne
Cheah
a,
Joanna
Wojtasz-Mucha
a,
Christian
Kugge
b,
Elham
Nejadmoghaddam
a,
Louise
Olsson
a,
You Wayne
Cheah
a,
Joanna
Wojtasz-Mucha
a,
Christian
Kugge
b,
Elham
Nejadmoghaddam
a,
Louise
Olsson
 a and
Derek
Creaser
 *a
*a
aCompetence Centre for Catalysis, Chemical Engineering, Chalmers University of Technology, SE-41296, Gothenburg, Sweden. E-mail: derek.creaser@chalmers.se
bSCA R&D Centre, Sundsvall, Sweden
First published on 14th May 2024
Abstract
Valorization of forest residual products can offer a vital pathway to derive bio-based chemicals and fuel components. Herein, we report the effective and direct conversion of sawdust biomass over a supported Mo-oxide catalyst that results in a dominant fraction of aliphatic/cyclic alkanes and alkylbenzenes with low residual solids. The reductive liquefaction was conducted in an autoclave reactor using a series of MoOx–Al2O3 variants in the range of 340–400 °C with an initial H2 pressure of 35 bar for 4 h. At 340 °C, a correlation between Mo-loadings and reactivity for depolymerization and hydrodeoxygenation was found optimal for a surface density of 3.2 Mo-atoms per nm2 corresponding to 8 wt% Mo-loading. The liquefied fraction showed high selectivity (∼38%) for the formation of cycloalkanes and alkylbenzenes. At higher temperatures (400 °C) enhanced reactivity over the optimal catalyst showed higher cycloalkane and alkylbenzenes formation (∼57%) at a low biomass-to-catalyst feed mass ratio (3![[thin space (1/6-em)]](https://www.rsc.org/images/entities/char_2009.gif) :
:![[thin space (1/6-em)]](https://www.rsc.org/images/entities/char_2009.gif) 1). At a higher ratio (10
1). At a higher ratio (10![[thin space (1/6-em)]](https://www.rsc.org/images/entities/char_2009.gif) :
:![[thin space (1/6-em)]](https://www.rsc.org/images/entities/char_2009.gif) 1), alkylphenols (∼41%) are the leading product fraction followed by cycloalkanes and alkylbenzenes (∼34%) with a high liquefied monomer bio-oil product yield of 39.4 wt%. Catalyst characterization via XRD, Raman, H2-TPR, and XPS analysis revealed that the origin for this reactivity arises from the Mo species formed and stabilized over the support surface. A well dispersed, octahedral, higher fraction of easily reducible Mo-species (Mo5+) was evident over the optimal catalyst which enables enhanced C–O cleavage facilitating the hydrodeoxygenation reaction. Moreover, the solid residue yield could be reduced to below 5 wt% by optimizing the reaction conditions and particle size of the sawdust.
1), alkylphenols (∼41%) are the leading product fraction followed by cycloalkanes and alkylbenzenes (∼34%) with a high liquefied monomer bio-oil product yield of 39.4 wt%. Catalyst characterization via XRD, Raman, H2-TPR, and XPS analysis revealed that the origin for this reactivity arises from the Mo species formed and stabilized over the support surface. A well dispersed, octahedral, higher fraction of easily reducible Mo-species (Mo5+) was evident over the optimal catalyst which enables enhanced C–O cleavage facilitating the hydrodeoxygenation reaction. Moreover, the solid residue yield could be reduced to below 5 wt% by optimizing the reaction conditions and particle size of the sawdust.
Introduction
Lignocellulosic biomass is an ample and carbon neutral renewable resource to derive bio-based functional materials for numerous applications including specialty chemicals and fuels.1–7 Forest residual lignocellulosic material conversion can help mitigate the adverse effect of global warming caused by fossil carbon emission and make a sustainable contribution to achieve net zero vision by 2050.8 In addition, the global generation of such lignocellulosic material is about 20 billion tons, which is mostly utilized for low value applications e.g. heat from its combustion. Thus, in recent times, increasing attention has been paid to extracting high value alternative/sustainable fuel/chemical components from it to diminish the dependency on utilizing fossil resources.6,9–11 Among different biomass, sawdust, is an abundant, biorefinery by-product that could be exploited for this purpose. Chemically cellulose, hemicellulose, lignin, and extractives with various functionalities make up this material that is heterogeneous, complex, and recalcitrant to transformation. In addition, the presence of impurities (S, N, alkali metals, etc.) may pose additional difficulties. Also, this hydrogen deficient (or relatively C, O rich) material poses limitations for hydrocarbon yield in the absence of H2 being supplied. To address these challenges various thermochemical/catalytic strategies/processes have been proposed.12Among catalytic upgradations of sawdust/woody biomass two strategies are common: (i) in situ fast pyrolysis/hydropyrolysis followed by an ex situ upgradation via catalytic hydrodeoxygenation (HDO) in the presence of H2 to remove oxygen functionalities (two-stage processing), (ii) direct hydrothermal/reductive liquefaction in the presence/absence of solvent/H2 (one-pot process). In these processes, stabilization of the derived bio-oil, uncontrolled recondensation/repolymerization, or char formation often limits the desired monomer/product yield and selectivity. The operating conditions (temperature, H2-pressure etc.), choice of catalyst, solvent, and type of reactor employed often play a crucial role. However, two-stage processing is more common than the one-pot process. Various noble/transition metal catalysts have been investigated in this regard to valorize sawdust or woody biomass fractions as standalone or co-processes.13–15 Hydropyrolysis of pine sawdust and subsequent hydrotreatment of the produced vapor over a reduced bimetallic NiMo over HZSM-5 showed the formation of 23.9 wt% of bio-oil with a high (∼72%) aliphatic hydrocarbon selectivity.16 A similar strategy by Huang et al.17 over Mo–Cu/HZSM-5 (500 °C, 1 h) showed an increased fraction of C6–C12 hydrocarbons however with high residual solids. Cheng et al.18–20 investigated the liquefaction of pine sawdust using ethanol/water at supercritical conditions and employed zinc as an in situ H2 generator for the upgradation of bio-oil over Pd/C and CoZn/HZSM-5. The highest degree of deoxygenation was found over CoZn/HZSM-5 (∼66%) with a hydrocarbon content of 18.6%.18Ex situ hydropyrolysis of sawdust over Pt/TiO2 (400 °C, 1 atm) and hydro-coprocessing of the derived pyrolysis oil and fossil oil over sulfided NiMoS/Al2O3 (330 °C, 100 bar H2@25 °C) showed the formation of high value deoxygenated aliphatic and aromatic compounds with minimal residual coke (∼0.1 wt%).13 Formation of jet/diesel range fuel from sawdust biomass has also been demonstrated by a conventional two or three-stage process involving pyrolysis (HZSM-5), alkylation (ionic liquid), and hydrogenation/hydrotreatment (Pd/AC or RANEY® nickel).10,11,21
However, there are limited studies on the direct (one-pot) catalytic conversion of sawdust. Oxygenated biofuel having aliphatic/cyclic alkanes and benzenic compounds have been produced by direct conversion of pine wood in a batch reactor over Cu–Ru/heteropolyacid (470 °C, 40 bar@25 °C).14,15 Wang et al.22 studied the direct liquefaction of sawdust using H-donor/non-hydrogen donor solvents under various atmospheres (H2, syngas, Ar, and CO) and found a high yield of bio-oil using an H-donor solvent (tetralin) and H2 atmosphere. The unique feature of the Pt/NbOPO4 catalyst for the direct conversion (one-pot) of wood sawdust to liquid alkanes (pentane, hexane, alkylcyclohexanes) was attributed to the synergy between metallic Pt,Nb-oxides, and the resulting acidity.23 Such upgradation was carried out in a batch reactor at 190 °C, 5 MPa H2@room temperature for 20 h with a yield of residual solids of 15–33 wt%.23 Hydrocracking of woody biomass over Ni–W2C/C showed an impressive 75.6% yield of ethylene glycol and diols from the cellulose/hemicellulose fraction and 46.5% of monophenols from the lignin fraction.24 Liu et al.25 demonstrated a one-pot conversion of pine sawdust and other biomass over LiTaMoO6 and Ru/C using water and a low concentration of phosphoric acid. Enhanced depolymerization and production of gasoline alkanes (−82.4% yield based on cellulose/hemicellulose) and 53% yield of hydrocarbon/monophenols (based on lignin) have been reported at 230 °C, 60 MPa (at room temperature) and 24 h. Furthermore, co-processing of poplar wood sawdust and VGO (1![[thin space (1/6-em)]](https://www.rsc.org/images/entities/char_2009.gif) :
:![[thin space (1/6-em)]](https://www.rsc.org/images/entities/char_2009.gif) 10 ratio) in pilot-scale at 340 °C, 8 MPa over in situ generated sulfur deficient MoSx facilitated depolymerization/hydrodeoxygenation and formation of small oxygenate molecules.26 The so called co-HDO oil thus produced showed a high liquid yield, high H/C values, and comparable heating values as VGO. These studies show the possibility to integrate sawdust biomass directly in existing refinery infrastructures to obtain value-added fuel components. Román-Leshkov's group27–29 examined molybdenum-based catalysts for upgrading of model compounds and fast pyrolysis oil. Inspired by their work, herein, we report the direct conversion of sawdust biomass over reduced Mo/γ-Al2O3 catalysts, a cheaper and sulfur-free catalyst compared to the traditional sulfide and costly noble metal catalysts.
10 ratio) in pilot-scale at 340 °C, 8 MPa over in situ generated sulfur deficient MoSx facilitated depolymerization/hydrodeoxygenation and formation of small oxygenate molecules.26 The so called co-HDO oil thus produced showed a high liquid yield, high H/C values, and comparable heating values as VGO. These studies show the possibility to integrate sawdust biomass directly in existing refinery infrastructures to obtain value-added fuel components. Román-Leshkov's group27–29 examined molybdenum-based catalysts for upgrading of model compounds and fast pyrolysis oil. Inspired by their work, herein, we report the direct conversion of sawdust biomass over reduced Mo/γ-Al2O3 catalysts, a cheaper and sulfur-free catalyst compared to the traditional sulfide and costly noble metal catalysts.
In earlier work, reduced Mo-based catalysts have been investigated for structure–activity relationships for the synthesis of nopol,30 transesterification of dimethyl oxalate,31 dehydrogenation of ethane,32 propane,33 and methanol oxidation.34 In most of these studies, a correlation between activity and Mo-oxides structure has been found related to the surface coverage of Mo atoms or the Mo-loadings.
However, to the best of our knowledge, no studies have been reported regarding the direct conversion of sawdust (one-pot) using Mo-oxide variations over γ-Al2O3 in a batch reactor. Table S1† presents relevant studies of Mo-based catalysts explored for upgrading of lignocellulosic biomass, distinguishing between those dealing with multi-stage versus direct (one-pot) process studies. Reduced MoO3 (with inert support α-alumina) was found highly active for the deoxygenation reaction of typical lignin-derived bio-oil model compounds m-cresol, anisole, guaiacol, phenol, diphenyl ether, etc at ≤atmospheric pressure.28 The high reactivity was attributed to the formation of surface oxycarbide/oxycarbohydride phases which prevent the catalyst from forming less reactive MoO2 (Mo4+ species). In addition, HDO of m-cresol using reduced MoO3/metal-oxides (e.g. ZrO2, CeO2, TiO2, SiO2, and γ-Al2O3) was investigated by Shetty et al.27 Interestingly, reactivity was found to be greatly influenced by the reduced species formed and stabilized by the support materials. TiO2 and ZrO2-based catalysts showed high activity and slow deactivation rates. Furthermore, MoO3/TiO2 and MoO3/ZrO2 have been explored for fast pyrolysis of pine wood at 500 °C and mild H2 pressures ≤0.75 bar and showed a carbon yield of 30% as hydrocarbon products.29 Bulk MoO3 was found highly active for deoxygenation of corn stover pyrolysis vapor (at low H2 pressure, 300–400 °C) and yielded a large fraction of C1–C6 linear alkanes and aromatics predominantly.35 An industrial Mo/Al2O3 yielded a low amount of bio-oil, with higher yields of gas and coke during tandem pyrolysis and atmospheric HDO (450 °C) of wheat straw pyrolysis vapor.36 MoO3 (10 wt%) dispersed over TiO2, has been shown to possess a high HDO activity similar to that of 0.5 wt% Pt/TiO2.36 Other supported Mo-based catalysts have been studied in more typical two-stage upgrading processes of lignocellulosic biomass as mentioned earlier. In the current contribution, we have synthesized a series of conventional Mo-oxide over γ-Al2O3 catalysts with variations of Mo-loadings to obtain mechanistic insights into the valorization of a complex sawdust feedstock in a one-pot process using hexadecane as the solvent. Such hydrocarbon solvent has been reported to be stable and reduces char formation during biomass/bio-oil stabilization and upgradation.37–39 Detailed analysis of the resulting bio-oil (GCxGC-MS, 2D HSQC NMR) coupled with the catalyst characterization (X-ray diffraction (XRD), Raman spectroscopy, H2-temperature-programmed reduction (TPR), NH3-temperature-programmed desorption (TPD), scanning electron microscope (SEM), X-ray photoelectron spectroscopy (XPS), Fourier transformed infrared (FTIR) spectroscopy) shows unique insights regarding structure–activity relationships for this application.
Experimental
Catalyst synthesis
Pre-calcined γ-Al2O3 (5 °C min−1 to 550 °C and hold for 2 h) was used as the support material for all the synthesized catalysts. A wet impregnation method described elsewhere40 was employed to load the Mo-precursor (ammonium molybdate tetrahydrate, 81–83% MoO3 basis, Sigma-Aldrich) over γ-Al2O3. Briefly, an aqueous mixture of γ-alumina was initially made and stirred continuously at 500 rpm. Its pH was then adjusted to 4.0 by the dropwise addition of 10% HNO3. An aqueous solution of the required amount of Mo-precursor, prepared separately, was then added to the pH stabilized γ-alumina. The addition of the Mo-precursor caused an increase in the pH of the mixture, but it was maintained at 4.0 by adding 10% HNO3 during the Mo-impregnation. Following the Mo-impregnation, rotary vacuum evaporation (at 70 °C) was used to remove water from the mixture, which was then dried overnight at 80 °C. Finally, it was calcined in air at 450 °C (with a ramp of 5 °C min−1) for 4 h. Likewise, several Mo variants (namely 4, 8, 12, and 16 wt% of Mo) over the γ-Al2O3 were prepared. For brevity, xMoAl is used as an acronym, where x represents the Mo-loading (wt%) and Al for γ-Al2O3.Catalyst characterization
Catalytic activity measurements
All the activity tests were performed in a 300 ml Parr autoclave reactor (Parr Inc.). The synthesized catalyst (∼0.5 g) was first reduced at 450 °C and 10 bar of H2 (99.9%, AGA) for 4 h. After the reduction, the catalyst was passivated using 1% O2/Ar for 0.5 h at room temperature (25 °C). Dried sawdust was then loaded in a 3![[thin space (1/6-em)]](https://www.rsc.org/images/entities/char_2009.gif) :
:![[thin space (1/6-em)]](https://www.rsc.org/images/entities/char_2009.gif) 1 (or 10
1 (or 10![[thin space (1/6-em)]](https://www.rsc.org/images/entities/char_2009.gif) :
:![[thin space (1/6-em)]](https://www.rsc.org/images/entities/char_2009.gif) 1) mass ratio to the amount of catalyst in the reactor. 75 ml of hexadecane (n-C16, 99%, Sigma-Aldrich) was added subsequently before closing the reactor. After three consecutive sequences (first N2 and then H2 purging), the reactor was pressurized to 35 bar@25 °C with H2 and heated up to 340–400 °C with a stirring rate of 1000 rpm. Heating required approximately 23–31 min to reach the desired temperature during which the pressure autonomously increased to 65–75 bar respectively (depending on temperature). Thereafter, the reductive liquefaction process was maintained for 4 h after which the reactor was cooled to 25 °C (taking approximately 25 minutes) using cooling water flow through an internal coil in the reactor vessel. A 100 ml gas sample (5–7 bar) was collected in a stainless-steel container before depressurizing the reactor. Purging with N2 was carried out before opening the reactor to collect the liquid and solid residue mixture. The organic phase containing n-C16 was separated via filtration. The reactor cylinder, other auxiliaries (stirrer, cooling coils, dip tube, reactor headspace, etc.), and the filtered solid residue were further washed with acetone and the phase thus obtained will be referred to as the ‘aqueous phase’. The dried solid residue (80 °C, ambient pressure, overnight) was further characterized.
1) mass ratio to the amount of catalyst in the reactor. 75 ml of hexadecane (n-C16, 99%, Sigma-Aldrich) was added subsequently before closing the reactor. After three consecutive sequences (first N2 and then H2 purging), the reactor was pressurized to 35 bar@25 °C with H2 and heated up to 340–400 °C with a stirring rate of 1000 rpm. Heating required approximately 23–31 min to reach the desired temperature during which the pressure autonomously increased to 65–75 bar respectively (depending on temperature). Thereafter, the reductive liquefaction process was maintained for 4 h after which the reactor was cooled to 25 °C (taking approximately 25 minutes) using cooling water flow through an internal coil in the reactor vessel. A 100 ml gas sample (5–7 bar) was collected in a stainless-steel container before depressurizing the reactor. Purging with N2 was carried out before opening the reactor to collect the liquid and solid residue mixture. The organic phase containing n-C16 was separated via filtration. The reactor cylinder, other auxiliaries (stirrer, cooling coils, dip tube, reactor headspace, etc.), and the filtered solid residue were further washed with acetone and the phase thus obtained will be referred to as the ‘aqueous phase’. The dried solid residue (80 °C, ambient pressure, overnight) was further characterized.
Product analysis
The organic and the aqueous phase obtained were analyzed by 2D GC × GC-MS-FID (7890B-5977A, Agilent) instrument having VF-1701 MS (30 m × 250 μm × 0.25 μm) and DB-5MS (3 m × 150 μm × 0.15 μm) columns connected in series. In a typical GC run, the injector temperature was maintained at 280 °C. The sample injected (split ratio of 7![[thin space (1/6-em)]](https://www.rsc.org/images/entities/char_2009.gif) :
:![[thin space (1/6-em)]](https://www.rsc.org/images/entities/char_2009.gif) 1) from the automatic liquid sampler is evaporated and separated in the column based on the oven setting and thermal modulation. The oven, initially at 40 °C for 1 min was ramped to 280 °C with a rate of 2.5 °C min−1 (a total of 97 min per run). During this time interval, thermal modulation was maintained at 5 s. GC Image software was used to analyze the evolved 2D chromatograms (MS/FID). Additionally, 1D analysis runs were performed to identify the alkanes below C7 using the same setup but without thermal modulation and using a heating rate of 5 °C min−1 (a total of 55 min run). The quantification of the detected products was made using external calibrations for different groups of products using anisole as an internal standard. The formulae given below were used to quantify the sawdust conversion, product/solid residue yields, and product selectivities.
1) from the automatic liquid sampler is evaporated and separated in the column based on the oven setting and thermal modulation. The oven, initially at 40 °C for 1 min was ramped to 280 °C with a rate of 2.5 °C min−1 (a total of 97 min per run). During this time interval, thermal modulation was maintained at 5 s. GC Image software was used to analyze the evolved 2D chromatograms (MS/FID). Additionally, 1D analysis runs were performed to identify the alkanes below C7 using the same setup but without thermal modulation and using a heating rate of 5 °C min−1 (a total of 55 min run). The quantification of the detected products was made using external calibrations for different groups of products using anisole as an internal standard. The formulae given below were used to quantify the sawdust conversion, product/solid residue yields, and product selectivities.| Conversion (%) = 100 − solid residue yield (%) | (1) |
 | (2) |
| Dried total solid (g) = dried acetone washed solid residue | (3) |
 | (4) |
 | (5) |
| Bio-oil yield (%) = 100 − solid residue yield − gas product yield | (6) |
It is important to note that bio-oil yield (including moisture) is an estimated value (calculated by difference) as it is difficult to fully distinguish the bio-oil products from the hexadecane/aqueous phase. Hence, the product yield and selectivities reported here are only GC-detectable products based solely on 1D and 2D GC×GC analysis and external calibrations.
The collected gas sample was analyzed using a GC (Scion 456, Bruker) consisting of TCD (thermal conductivity) and FID (flame ionization) detectors. External calibration of CO/CO2 and C1–C5 paraffins was used to quantify the gas components. The product gas sampled from the reactor at 25 °C and ∼30 bar was assumed to contain a negligible quantity of water. The H2 conversion was calculated based on the difference between start and final total reactor pressures at room temperature, and accounting for the H2 purity of the final gas based on the gas analysis. The water content of the organic and aqueous phases was measured via volumetric titration using a Karl Fisher apparatus (Metrohm 870 KF Titrino plus). HYDRANAL™ – composite 5, (Honeywell Fluka™) was used as the titrant and the sample (∼0.1–0.2 g) was titrated in HYDRANAL™ – methanol dry (Honeywell Fluka™) in a glass container.
Furthermore, the organic phase dissolved in deuterated chloroform-D1 (CDCl3, 99.8%, Merck) was analyzed by 2D (1H–13C) HSQC (heteronuclear single quantum coherence spectroscopy) NMR to understand the product spectrum evolved after the liquefaction treatment. The analysis was done by using a setup of Bruker Advance III HD; Bruker BioSpin GmBH, Rheinstetten, Germany. Data acquisition and further processing were performed using Bruker Topspin software. In addition, Fourier transform infrared spectroscopy (FTIR, Bruker Vertex 70v spectrometer) analysis was performed on the sawdust sample and solid residues obtained after the catalytic hydrotreatment.
Results and discussion
Characterization of sawdust
Table 1 shows the proximate and ultimate analysis of the supplied sawdust sample. The volatile matter was measured at 900 °C and showed a value of 83.8 wt% with minimal ash content. Elemental analysis shows that the sawdust is hydrogen deficient but rich in C and O with very low nitrogen and sulfur content. Moreover, the structural analysis of the ground sample shows cellulose, hemicellulose, and lignin contents of 36, 22, and 29 wt% respectively. The remaining amount accounts for extractives and ash content.| Proximate analysis (wt%, dry) | Ultimate analysis (wt%, dry)*** | Structural analysis (wt%) | |||
|---|---|---|---|---|---|
| a *Measured by ALS Scandinavia AB, **values by difference, ***measured by elemental analysis. | |||||
| Volatile matter | 83.8* | C | 49.1 | Cellulose | 36 |
| Moisture | 7.4 | H | 6.47 | Hemicellulose | 22 |
| Fixed carbon (FC) | 8.5** | N | 0.030 | Lignin | 29 |
| Ash | 0.3* | O | 44.4 | Extractives | 12.7** |
| S | 0.002 | Ash | 0.3* | ||
Characterization of synthesized catalysts
Table 2 shows the metal contents and textural properties of the as-prepared catalysts. ICP-SFMS analysis shows that the Mo-loading was in the range of 4–16 wt% and consistent with the nominal loadings for the as-synthesized catalysts. The impregnation of Mo-precursors on the γ-Al2O3 shows a gradual reduction (up to 18%) in the total specific surface area, pore volumes, and average pore sizes. Fig. S1† shows the variations in the N2 physisorption data for Mo-loading. Based on the Mo-contents and specific surface area, the Mo-surface density (Mo atoms per nm2 of surface area) shows a linear increase with increasing Mo loading.| Catalyst | Elemental composition (wt%) | N2 physisorption | Mo-surface density | ||
|---|---|---|---|---|---|
| Mo | S a total (m2 g−1) | V p total (cm3 g−1) | d p (Å) | (Mo per nm2) | |
| a S a = BET surface area. Vp = pore volume. dp = average pore sizes for mesopores. | |||||
| γAl2O3 (Al) | 168 | 0.48 | 73.7 | 0 | |
| 4Mo/γ-Al2O3 (4MoAl) | 4.2 | 168 | 0.43 | 67.8 | 1.6 |
| 8Mo/γ-Al2O3 (8MoAl) | 8.0 | 155 | 0.40 | 67.5 | 3.2 |
| 12Mo/γ-Al2O3 (12MoAl) | 12.1 | 143 | 0.36 | 68.8 | 5.3 |
| 16Mo/γ-Al2O3 (16MoAl) | 16.0 | 137 | 0.36 | 70.0 | 7.3 |
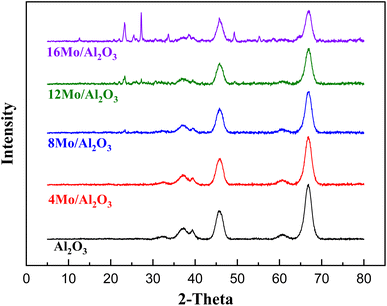
As shown in Fig. 1 the diffraction peaks from Mo-oxides start appearing from the 12MoAl catalyst at a surface density of 5.3 Mo per nm2. Literature data suggest that a monolayer of Mo-oxides over alumina ensues at a Mo-surface density of 4.8 Mo per nm2.33 This indicates that MoOx phases could be well dispersed at a loading of 8 wt% Mo over γ-Al2O3 (surface density of 3.2 Mo per nm2) or the Mo-oxide phases are amorphous. The crystalline phases of MoOx can be clearly distinguished at a surface density of 5.3 Mo per nm2 (12MoAl) or above. As can be seen, 2θ values of 12.5°, 23.2°, 25.5°, 27.1°, 33.6°, 38.7°,49.3°, 55.2° in Fig. 1 represent the (020), (110), (040), (021), (111), (060) and (200) planes of the orthorhombic phase of crystalline Mo-oxides.45–47
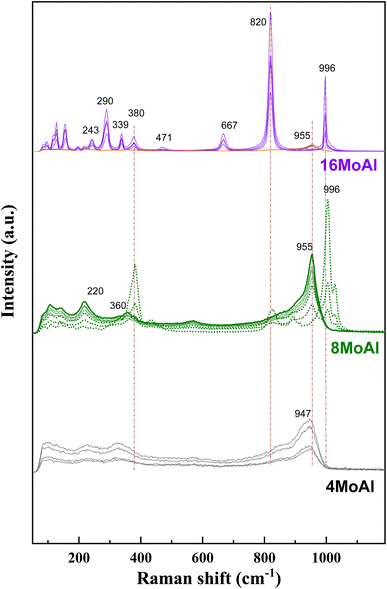
Raman scattering spectra of the synthesized catalysts in Fig. 2 illustrate the variation of Mo–O vibrations under ambient conditions (hydrated conditions). A broad band at a Raman shift of ∼947 cm−1 (terminal Mo![[double bond, length as m-dash]](https://www.rsc.org/images/entities/char_e001.gif) O stretching vibration) for 4 wt% Mo loading (4MoAl with 1.6 Mo per nm2) represents the presence of oligomeric MoOx species.27,33 As the Mo-loading increases, this band shifted to a value of ca. ∼955 cm−1 for 8MoAl with a surface density of 3.2 Mo per nm2. The literature data suggests that this band should exist up to a surface density of ∼4.5 Mo per nm2 where monolayer coverage by Mo-polymolybdates is reached.33,48 At higher Mo-loading (16MoAl, 7.3 Mo per nm2) the intense bands at Raman shifts of 290, 339, 380, 667, 822, and 996 cm−1 represent the formation of three-dimensional crystalline MoO3 clusters, typically arising when monolayer formation is exceeded.33,49,50 Like for lower Mo-loading, a weak band at ∼955 cm−1 also coexists at such a high loading. However, as evident, additional bands that are common for higher Mo-loaded samples were also observed for 8MoAl at a few locations suggesting the completion of monolayer formation and the possible coexistence of fine MoO3 crystallites. Additional bands at ca. 1005 and 1028 cm−1 can also represent the formation of isolated MoO4 structures.48
O stretching vibration) for 4 wt% Mo loading (4MoAl with 1.6 Mo per nm2) represents the presence of oligomeric MoOx species.27,33 As the Mo-loading increases, this band shifted to a value of ca. ∼955 cm−1 for 8MoAl with a surface density of 3.2 Mo per nm2. The literature data suggests that this band should exist up to a surface density of ∼4.5 Mo per nm2 where monolayer coverage by Mo-polymolybdates is reached.33,48 At higher Mo-loading (16MoAl, 7.3 Mo per nm2) the intense bands at Raman shifts of 290, 339, 380, 667, 822, and 996 cm−1 represent the formation of three-dimensional crystalline MoO3 clusters, typically arising when monolayer formation is exceeded.33,49,50 Like for lower Mo-loading, a weak band at ∼955 cm−1 also coexists at such a high loading. However, as evident, additional bands that are common for higher Mo-loaded samples were also observed for 8MoAl at a few locations suggesting the completion of monolayer formation and the possible coexistence of fine MoO3 crystallites. Additional bands at ca. 1005 and 1028 cm−1 can also represent the formation of isolated MoO4 structures.48
On the other hand, the band in the region of 200–400 cm−1 generally denotes the bending modes of bridging Mo–O–Mo and O–Mo–O vibrations which further indicate the presence of well dispersed oligomeric MoOx species for the low Mo-loaded catalysts.27,48,51,52 Hanjing Tian et al.48 identified the presence of isolated [MoO4]2− and [Mo7O24]6− clusters− at low and monolayer Mo-coverage under ambient/hydrated conditions. Under dehydrated conditions, MoOx dispersed as monomolybdate (MoO4) and polymolybdate (O![[double bond, length as m-dash]](https://www.rsc.org/images/entities/char_e001.gif) MoO4) at low and full monolayer Mo-coverage, both possessing at least one Mo
MoO4) at low and full monolayer Mo-coverage, both possessing at least one Mo![[double bond, length as m-dash]](https://www.rsc.org/images/entities/char_e001.gif) O termination.48,53 Beyond the full coverage, crystalline MoO3 clusters appeared regardless of the condition (ambient or dehydrated). Overall, the XRD data are in line with the Raman data at higher Mo-surface density showing the presence of crystalline MoO3 while at lower loadings the well dispersed oligomeric/octahedral MoOx domain dominates.
O termination.48,53 Beyond the full coverage, crystalline MoO3 clusters appeared regardless of the condition (ambient or dehydrated). Overall, the XRD data are in line with the Raman data at higher Mo-surface density showing the presence of crystalline MoO3 while at lower loadings the well dispersed oligomeric/octahedral MoOx domain dominates.
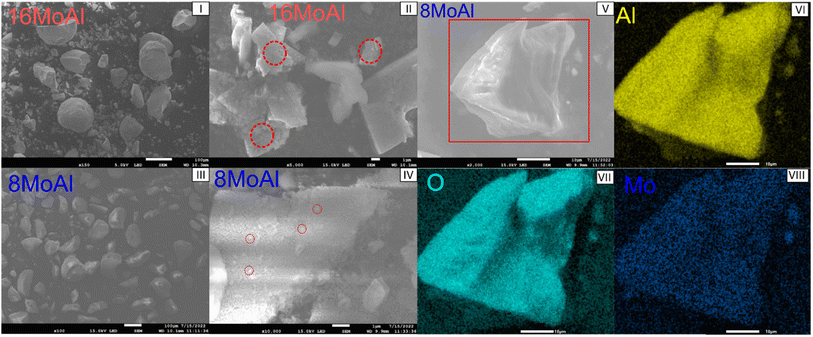
To elucidate the surface morphology and variation of Mo-oxides, SEM-EDX was performed for the 8MoAl and 16MoAl catalysts as shown in Fig. 3. Consistent with the XRD and Raman measurements, the higher Mo-loaded catalyst, 16MoAl shows clusters of agglomerated MoO3 particles (Fig. 3(I and II)). EDX analysis of representative areas (Fig. S2†) shows that the local Mo-content in such clusters on 16MoAl can be as high as three times higher than the nominal Mo-loading. On the other hand, an even distribution of MoOx species despite some small clusters can be observed from Fig. 3(III and IV) for 8MoAl. EDX-elemental mapping on the representative areas shows the uniformity of the elements, Mo, O, and Al.
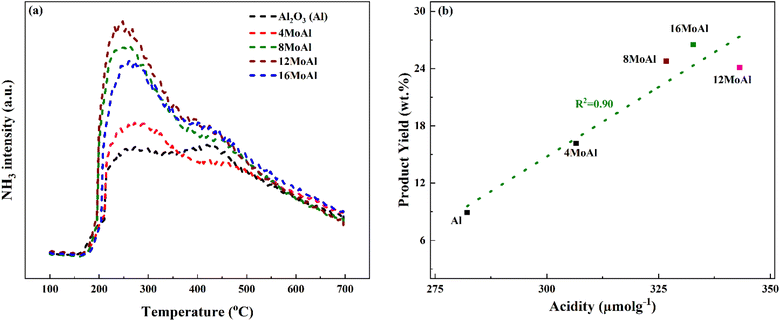
Fig. 4 shows the NH3 desorption profile during the NH3 temperature-programmed desorption experiments and the correlation between the monomer product yields of the Mo-based catalysts to the corresponding acidity of the catalyst shown in Table 3.
The synthesized catalysts show a nearly linear increase in acidity as the Mo-loading increases up to the catalyst with a Mo-surface density of 5.3 Mo per nm2 (12MoAl). A further increase in Mo-surface density (16MoAl) shows a decrease in the total acidity of the catalyst with the highest Mo-loading. As evident from XRD and Raman analysis, this could be due to the bulk/layered crystalline MoO3 phase that either blocks access to the acidic sites or imposes diffusion limitations for NH3 molecules to reach and adsorb on sites at the specified conditions. The deconvolution of the evolved NH3-desorption pattern (shown in Fig. S3†) shows three temperature regions for NH3 desorption indicating different acid site strengths (Table 3). Mo-impregnation of the γ-Al2O3 support causes a decrease in the high-temperature (>375 °C) acid site density and a corresponding rise in the moderate (250–375 °C) and low (<250 °C) temperature acid site densities for the synthesized catalysts.
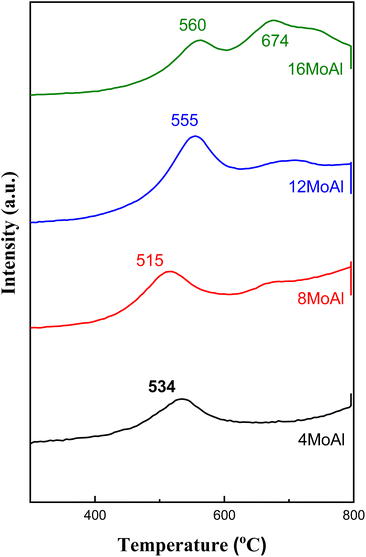
Fig. 5 and S4† show the H2 temperature-programmed reduction profile data of the synthesized catalysts. Table S2† shows that increasing Mo-loading causes as expected an increase in H2 consumption. The typical crystalline/bulk MoO3 (Mo6+) reduction profile typically follows two reduction steps, first to MoO2 (Mo4+) at a lower temperature and then further to metallic Mo at high temperature.54 The characteristics of the reduction pattern can be affected by many factors e.g., catalyst synthesis (supported/unsupported), pretreatment conditions, and type/loading of metals on the support, etc.54,55 As can be seen from Fig. 5 the Mo-loading influences the reducibility of Mo-oxide species. As the loading increases to 8 wt% (8MoAl, 3.2 Mo per nm2), Tmax of the first H2 consumption peak shifted to lower values for 8MoAl (8 wt% Mo-loading) suggesting the presence of easily reducible (octahedral) Mo6+ species that reduce to Mo4+.27 At lower Mo-loading (4MoAl) this peak appears at a higher temperature than 8MoAl suggesting there are stronger interactions with the support at lower Mo-loading or the presence of tetrahedral Mo6+ species that require higher temperature to reduce. At higher loading, the presence of more crystalline and tetrahedral Mo6+ species increases the reduction temperature to a higher value. This can be partly due to the need for H2 to diffuse into larger agglomerated MoO3 particles, as evident from the SEM analysis. Also, additional shoulder peaks that appear at a temperature >600 °C could be due to the reduction of polymeric molybdenum species to a lower aggregation level.
XPS analysis demonstrates the presence of Mo in different oxidation states as evidenced by the deconvolution of the Mo3d core level spectra shown in Fig. 6 for the ex situ reduced catalyst. Variations of reduced species, Mo4+ and Mo5+ can be seen easily over the different catalysts (Fig. 6(a–d)). However, there is minor sulfur S2s (6.8 ± 2.7%) contamination from the reactor for all samples, as can seen from the peak appearing at 227.2 eV. We consider such small contamination to have little or similar influence on the Mo reduction for all Mo-variations. From Fig. 6, it can be seen that the proportion of Mo5+ in 8MoAl shows a higher value of 42% while the proportion of Mo4+ was higher (37%) for 16MoAl. The presence of Mo5+ species suggests the formation of coordinately unsaturated sites (CUS) due to the reduction of MoO3 to MoO3−x species.27 This oxygen vacancy formation drives the HDO reactions. On the other hand, stable Mo4+ and Mo6+ species show lower reactivity for deoxygenation reactions.27 Mo-loading over γ-Al2O3 seems crucial to stabilize the presence of different Mo species. It is clear from Fig. 6 that Mo-loading corresponding to 8MoAl provides more highly reducible species (lowest Mo6+ species). Also, as evident from the TPR data (Fig. 5) over 8MoAl, CUS forms at a lower temperature than for other Mo-loadings.
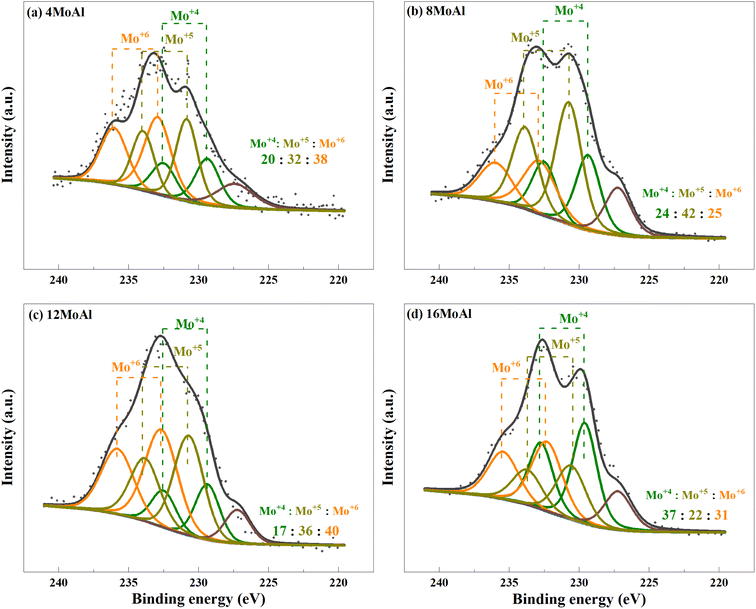 | ||
| Fig. 6 Deconvolution of the core level spectra of Mo3d for the reduced (a) 4MoAl, (b) 8MoAl, (c) 12MoAl, and (d) 16MoAl catalysts. | ||
Reductive liquefaction of sawdust
Table 4 shows product yields for one-pot sawdust liquefaction over xMoAl in the range of 340–400 °C with an initial pressure of 35 bar of H2@25 °C and 1000 rpm stirring rate in the Parr autoclave reactor. The evolution of different phases has been quantified based on the description in the Experimental section (product analysis section).| Entry | Catalyst | Temperature (°C) | Bio-oil yielda, wt% | Yield of GC-detectable bio-oil products, wt% | Yield of oxygen as H2O, wt% | Yield of gas-phase products, wt% | Solid residue yield, wt% |
|---|---|---|---|---|---|---|---|
a Estimated value on a wet basis.
b Experiment with sawdust![[thin space (1/6-em)]](https://www.rsc.org/images/entities/char_2009.gif) : :![[thin space (1/6-em)]](https://www.rsc.org/images/entities/char_2009.gif) catalyst mass ratio of 10 catalyst mass ratio of 10![[thin space (1/6-em)]](https://www.rsc.org/images/entities/char_2009.gif) : :![[thin space (1/6-em)]](https://www.rsc.org/images/entities/char_2009.gif) 1. All other experiments were run with the sawdust particle size of <500 μm and sawdust 1. All other experiments were run with the sawdust particle size of <500 μm and sawdust![[thin space (1/6-em)]](https://www.rsc.org/images/entities/char_2009.gif) : :![[thin space (1/6-em)]](https://www.rsc.org/images/entities/char_2009.gif) catalyst mass ratio of 3 catalyst mass ratio of 3![[thin space (1/6-em)]](https://www.rsc.org/images/entities/char_2009.gif) : :![[thin space (1/6-em)]](https://www.rsc.org/images/entities/char_2009.gif) 1. 1.
|
|||||||
| 1 | Blank | 340 | 75.3 | 8.9 | 6.7 | 1.2 | 23.4 |
| 2 | 4MoAl | 75.2 | 16.2 | 21.7 | 8.6 | 16.2 | |
| 3 | 8MoAl | 78.4 | 24.8 | 19.4 | 8,3 | 13.6 | |
| 4 | 12MoAl | 77.9 | 24.1 | 22.1 | — | 14.1 | |
| 5 | 16MoAl | 70.0 | 26.5 | 19.7 | 13.5 | 16.5 | |
| 6 | 8MoAl | 400 | 78.9 | 29.2 | 19.7 | 14.6 | 6.5 |
| 7 | 8MoAlb | 72.9 | 39.4 | 16.3 | 17.4 | 9.7 |
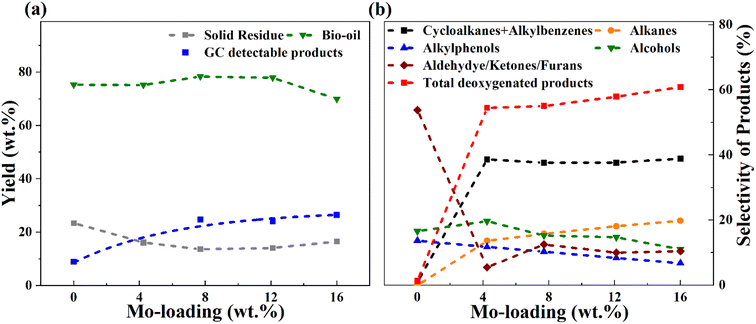
It is evident from Table 4 that the catalytic runs (entries 2–7) gave enhanced GC-detectable liquified product yields compared to solely thermal depolymerization (entry 1). Simultaneously, a reduced solid residue was observed for the catalytic runs. It can be noted here that the solid residue may consist partly of unconverted sawdust (mainly observed for blank runs), but also solids formed due to the repolymerization of reactive intermediates, sometimes referred to char. The improved liquid product yield and lower solids with catalyst is due to enhanced catalytic depolymerization of the sawdust constituents cellulose, hemicellulose, and lignin, and enhanced stabilization of reactive intermediates in the presence of a catalyst. With the same catalyst (8MoAl), the depolymerization process was improved at 400 °C compared to 340 °C as can be seen from entries 3, 6, and 7, in Table 4 showing a further decrement in solid residue and a corresponding rise in liquified product yields (entries 6 and 7). However, an accompanying increase in the gas phase products at 400 °C compared to 340 °C is also noticed (comparing entries 3 and 6). A similar increase in gas yield has been reported for lignin hydrotreatment/HDO of pyrolysis vapor studied in the range of 340–450 °C.56 Also, for higher Mo-loaded catalysts (entry 5) the gas phase product showed a higher value compared to low Mo-loaded catalysts (entries 2 and 3). This could be due to a combination of the deoxygenation of small oxygenate molecules and/or catalytic cracking reactions at the studied conditions. Table 4 and Fig. 7 show the variation in the yield and selectivity of liquefied fractions (GC-detectable bio-oil products) with the corresponding variations in Mo-loadings over γ-Al2O3 of the catalysts. It should be noted that zero Mo-loading in Fig. 7, corresponds to the blank experiment free of catalyst material (including Al2O3).
For a low Mo-loaded catalyst (4MoAl) the yield of GC-detectable products is double that of the non-catalytic experiment (blank), whereas the value becomes about three times higher for 8MoAl. However, for increasing Mo-loading from 8MoAl to 16MoAl, the GC-detectable fraction showed only a minor increment from 24.8 wt% to 26.5 wt% with an accompanying increase in the gas phase content. For 12MoAl, the GC-detectable yield was comparable at 24.1 wt%. The water content (Table 4) showed a little variation for the catalytic runs (entries 2–5) while for blank it was low. This is reasonable since the presence of a Mo-based catalyst should promote deoxygenation reactions.27 Based on the solid residue and gas phase contents, an estimated overall bio-oil yield (GC-detectable and undetectable) on a wet basis showed a declining trend at higher Mo-loading (16MoAl) while for 8MoAl it can reach ∼78 wt%. Xia Q. et al.23 reported a yield of 28.1% aliphatic and cyclic alkanes for one-pot sawdust conversion using Pd/NbOPO4 however, with higher solid residues (15–33%) as mentioned earlier. Table 4, Fig. 7 and Table S3† (ESI†) show the overall material balance based on the GC-detectable products to be in the range of 40–83% for the thermal/catalytic runs, demonstrating the presence of GC undetectable oligomeric fragments. The 2D GC×GC images of bio-oil products and identified compounds are listed in the supplementary file† (Table S4(a and b) and Fig. S5†).
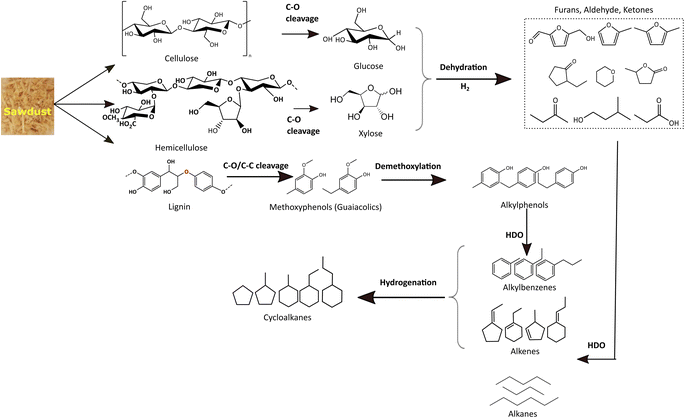
For simplicity and comparison, the gamut of products evolved after the reductive process was grouped into alkanes, cycloalkanes, alkylbenzenes, alkylphenols, alcohols, aldehydes, ketones, furans, and other oxygenates. Fig. 7(b) and Table S4(c)† illustrates their selectivities for the reductive process at 340 °C. It can be seen that aldehydes (∼7%), ketones (35%), furans (∼12%), alcohols (∼17%), and alkyl/alkoxyphenols (∼14%) dominate in the identified liquefied fraction for the run without catalyst. The presence of the catalyst (xMoAl) causes changes in the selectivities of these groups of products. Cycloalkanes and alkylbenzene selectivities reach an asymptotic value of ∼38% irrespective of Mo-loading over γ-Al2O3 despite the variation in overall product yield. A sharp decline in the aldehyde/ketone/furanic compounds can be seen for 4 wt% Mo-loading (4MoAl) followed by an increment for 8 wt% (due probably to increased depolymerization of solids) and a further slow decline at higher Mo-loadings. Similarly, a gradual decline in the other oxygenated products (alcohols, alkylphenols) can also be seen in Fig. 7(b), with catalyst and increasing Mo-loading. The deoxygenation of such oxygenated compounds thus yields higher alkanes, cycloalkanes and alkylbenzenes over the Mo-based catalysts. The total yield of deoxygenated products show a small increment from 54.5% for 4 wt% to 61% for 16 wt% Mo-loadings (16MoAl) at 340 °C. Considering the evolution of GC-detectable products, Scheme 1 is suggested for the reductive depolymerization and upgradation pathways towards the identified end products. However, the data in Table 4, Fig. 7 and Table S3† also indicate the presence of soluble larger oligomeric compounds, due to the lack of closure of the overall mass balance when using the GC-detectable components. The soluble oligomeric fragments are thus not included in Scheme 1.
During the thermal reductive depolymerization, C–O cleavage of cellulose (β 1,4-glycosidic linkages), hemicellulose (mixed β 1,4-linkages), and lignin (mostly β-O-4) occurs and results in the formation of 5-ring compounds (furans, ketones, aldehydes, etc.) and methoxy phenols (guaiacolics). In addition, ring opening reactions occurred to form aliphatic alcohols, ketones, and acids (e.g. acetic acid, propanoic acid). In literature, different routes have been reported for the C–O cleavage products.25,57,58 However, these reactions are augmented in the presence of Mo-based catalysts to varying degrees. Notably for lignin derived monolignols, demethoxylation of methoxy phenols (guaiacols) to alkylphenol, direct hydrodeoxygenation/dehydroxylation of alkylphenol to alkylbenzenes, and hydrogenation of alkylbenzene to naphthenes are common as shown in Scheme 1. Also, cellulose/hemicellulose-derived aliphatic and 5-member cyclic products undergo multiple pathways to yield deoxygenated alkanes and cycloalkanes. Aliphatic acids/alcohols/aldehyde/ketone may undergo direct-HDO, decarbonylation/decarboxylation to form corresponding alkanes (e.g. C4–C9 alkanes) with the liberation of small molecules, H2O, CO, and CO2 in the gas phase. On the other hand, 5-member cyclic/heterocyclic compounds may undergo decarbonylation, dehydroxylation, and hydrogenation reactions to yield saturated monocyclics. It is important to note that cellulose/hemicellulose-derived compounds (e.g. aliphatic alcohols) can also facilitate hydrogen transfer reactions to reduce for example carbonyl compounds to analogous alcohols or to stabilize unsaturated alkenes/alkynes.59 Besides, dimeric compounds such as indans, naphthalenes, biphenyls, etc. are also derived via depolymerization (not shown in Scheme 1). Also, polyaromatic compounds (e.g. anthracene/phenanthrene derivatives, not shown in Scheme 1) may form due to the fusion of benzene rings. Some polyaromatics (e.g. abietic acid) are derived from sawdust extractives. Undesired solid residue/char also forms due to low conversion of sawdust or condensation/radical coupling/repolymerization reactions of the unstabilized reactive intermediates.
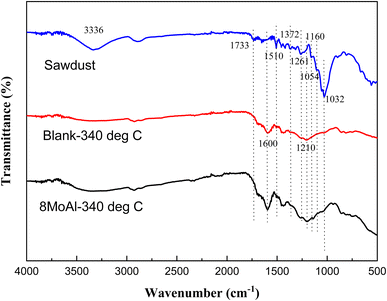
To elucidate the nature of the solid residue, FTIR analysis was carried out on the solid residue after the reductive liquefaction at 340 °C. Fig. 8 shows the acquired spectra including that of the sawdust as a reference. A broad band around 3336 cm−1 represents the presence of hydroxyl groups in cellulose/hemicellulose/lignin.60 Upon reductive liquefaction, the intensity of this band reduces. On the other hand, C–O stretching vibrations (in sawdust or solid residue) can be observed around 1738, 1261, 1229, and 1029 cm−1 are representative of cellulose/hemicellulose/lignin.61–63 The characteristic C–O–C vibration of the pyranose ring in cellulose/hemicellulose, evident at 1054 cm−1 is hardly present in the solid residue derived with/without catalytic treatment.64 This represents the transformation of this polymeric substance to monomeric compounds as evident via GCMS analysis of products present in the liquid phase. The aromatic ring vibration (νCar![[double bond, length as m-dash]](https://www.rsc.org/images/entities/char_e001.gif) Car) observed near 1600, 1510, and 1419 cm−161,65,66 indicating the presence of the phenylpropane unit in lignin or the development of aromatic C in the solid residue is due to the increased intensity of the band near 1600 cm−1. Other characteristic vibrations are presented in the ESI (Table S5†).
Car) observed near 1600, 1510, and 1419 cm−161,65,66 indicating the presence of the phenylpropane unit in lignin or the development of aromatic C in the solid residue is due to the increased intensity of the band near 1600 cm−1. Other characteristic vibrations are presented in the ESI (Table S5†).
Based on the above results, it is clear from Table 4 and Fig. 7 that the bio-oil product yield, selectivity, and solid residue formation at 340 °C for Mo loadings beyond 8 wt% (8MoAl) show only small variations. Also, the solids formed are mostly of an aromatic nature. Hence, the catalyst with 8 wt% Mo-loading (8MoAl) was further studied to explore the effect of temperature, feed-to-catalyst ratio, and sawdust particle sizes on the liquefaction process and solid residue formation.
Effect of temperature, feed-to-catalyst ratio, and particle size
An increasing temperature from 340–400 °C showed a linear decline in the solid residue formation over 8MoAl in Table S3† (entries 4, 7 and 8) and plotted in Fig. S6.† At 400 °C with sawdust particle size <500 μm, the GC-detectable bio-oil fraction increased by 18% compared to that at 340 °C over 8MoAl while the solid residue formation notably reduced by 50% to 6.5 wt% (Table 4, entries 3 and 6), however, with an accompanying increase in gas phase product yield. Furthermore, a supplementary experiment at 400 °C with sawdust particle size <100 μm (Table S3†) showed a further reduction in the solid residue to 4.9 wt% (Table S3,† entry 9). This is likely due to reduced transport limitations leading to enhanced depolymerization, stabilization, and subsequent upgradation pathways shown in Scheme 1. Fig. 9 compares the monomer product selectivities of the experimental runs made with a constant feed-to-catalyst ratio of 3![[thin space (1/6-em)]](https://www.rsc.org/images/entities/char_2009.gif) :
:![[thin space (1/6-em)]](https://www.rsc.org/images/entities/char_2009.gif) 1 with 8MoAl catalyst. Cycloalkane and alkylbenzene selectivity reached ∼57% at 400 °C from 38% at 340 °C. The reduced selectivity for oxygenate compounds (alkylphenols/alcohols/aldehydes/ketones/furans) at 340 °C demonstrates the enhanced deoxygenation and hydrogenation activity at 400 °C with increased temperature and a corresponding higher H2 pressure in the reactor (than the pressure at 340 °C). However, dimeric product (indans/naphthalenes/biphenyls) selectivity increased from ∼1% to 8% and polyaromatics increased from ∼1% to ∼2% possibly due to increased thermally-driven depolymerization of biomass. On the other hand, increasing the sawdust
1 with 8MoAl catalyst. Cycloalkane and alkylbenzene selectivity reached ∼57% at 400 °C from 38% at 340 °C. The reduced selectivity for oxygenate compounds (alkylphenols/alcohols/aldehydes/ketones/furans) at 340 °C demonstrates the enhanced deoxygenation and hydrogenation activity at 400 °C with increased temperature and a corresponding higher H2 pressure in the reactor (than the pressure at 340 °C). However, dimeric product (indans/naphthalenes/biphenyls) selectivity increased from ∼1% to 8% and polyaromatics increased from ∼1% to ∼2% possibly due to increased thermally-driven depolymerization of biomass. On the other hand, increasing the sawdust![[thin space (1/6-em)]](https://www.rsc.org/images/entities/char_2009.gif) :
:![[thin space (1/6-em)]](https://www.rsc.org/images/entities/char_2009.gif) catalyst feed ratio from 3
catalyst feed ratio from 3![[thin space (1/6-em)]](https://www.rsc.org/images/entities/char_2009.gif) :
:![[thin space (1/6-em)]](https://www.rsc.org/images/entities/char_2009.gif) 1 to 10
1 to 10![[thin space (1/6-em)]](https://www.rsc.org/images/entities/char_2009.gif) :
:![[thin space (1/6-em)]](https://www.rsc.org/images/entities/char_2009.gif) 1 at reaction temperature 400 °C caused an increased yield of GC-detectable liquefied bio-oil products from 29 to 39 wt% (Table 4, entries 6 and 7). Among these, selectivity for alkylphenols was highest at ∼40% followed by cycloalkanes/alkylbenzenes (∼34%) and alcohols/aldehyde/ketones/furans (∼20%). The solid residue also increased to ∼9.7 wt%. The increased selectivity for alkylphenols could be related either to a more limited H2 availability for the increased feed or slower HDO and hydrogenation pathways due to inhibitive occupancy of catalytic active sites. The H2 conversion increased from 25.8% for 3
1 at reaction temperature 400 °C caused an increased yield of GC-detectable liquefied bio-oil products from 29 to 39 wt% (Table 4, entries 6 and 7). Among these, selectivity for alkylphenols was highest at ∼40% followed by cycloalkanes/alkylbenzenes (∼34%) and alcohols/aldehyde/ketones/furans (∼20%). The solid residue also increased to ∼9.7 wt%. The increased selectivity for alkylphenols could be related either to a more limited H2 availability for the increased feed or slower HDO and hydrogenation pathways due to inhibitive occupancy of catalytic active sites. The H2 conversion increased from 25.8% for 3![[thin space (1/6-em)]](https://www.rsc.org/images/entities/char_2009.gif) :
:![[thin space (1/6-em)]](https://www.rsc.org/images/entities/char_2009.gif) 1 to 31.2% for 10
1 to 31.2% for 10![[thin space (1/6-em)]](https://www.rsc.org/images/entities/char_2009.gif) :
:![[thin space (1/6-em)]](https://www.rsc.org/images/entities/char_2009.gif) 1 sawdust
1 sawdust![[thin space (1/6-em)]](https://www.rsc.org/images/entities/char_2009.gif) :
:![[thin space (1/6-em)]](https://www.rsc.org/images/entities/char_2009.gif) catalyst feed ratio (Table S2†). Despite the increased H2 conversion with higher sawdust feed, this stabilized the reaction intermediates to form increased GC-detectable products, however with higher solid residue yield at the end of 4 h reaction.
catalyst feed ratio (Table S2†). Despite the increased H2 conversion with higher sawdust feed, this stabilized the reaction intermediates to form increased GC-detectable products, however with higher solid residue yield at the end of 4 h reaction.
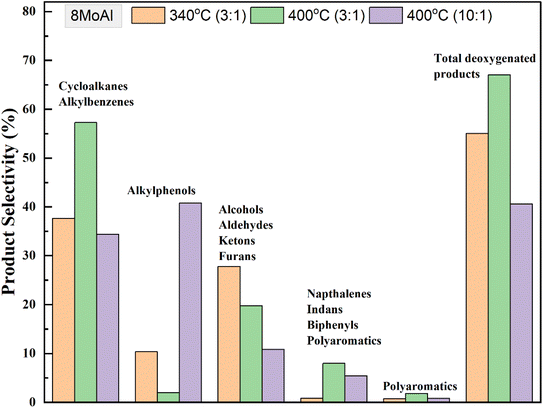 | ||
Fig. 9 Selectivity of monomeric products for catalytic runs over 8MoAl using dried sawdust at 340 °C and 400 °C (35 bar@25 °C, 1000 rpm, 4 h) with the variation of sawdust![[thin space (1/6-em)]](https://www.rsc.org/images/entities/char_2009.gif) : :![[thin space (1/6-em)]](https://www.rsc.org/images/entities/char_2009.gif) catalyst feed mass ratio. catalyst feed mass ratio. | ||
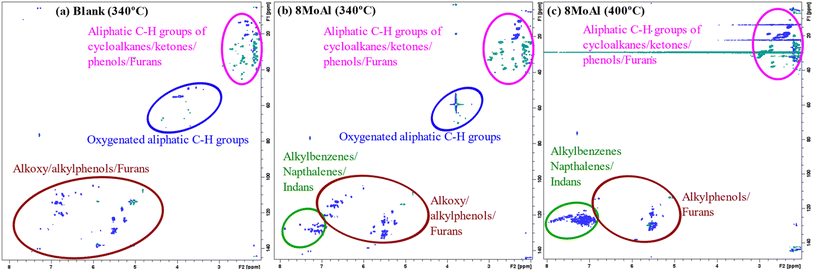
Furthermore, 2D HSQC NMR was performed on the liquefied bio-oil fraction to elucidate the chemical functionality of all products including the oligomers which could not be detected by 2D GC-MS. Fig. 10 shows the evolution of the products for the blank, and catalytic runs made at 340 °C and 400 °C for 8MoAl (Table 4). The oxygenated groups, alkoxyphenol (e.g. propyl guaiacol), alkyl phenol, and furans appear in the range of δH/δC 5.0–7.5/100–150. Aliphatic side groups (e.g., –CH2, CH3) of such oxygenates show peaks near δH/δC 1.0–3.0/0–50. Also, oxygenated aliphatic (e.g. methoxyl, alcoholic) functionalities can be observed around δH/δC 3.0–5.0/50–80. The catalytic reductive process over 8MoAl at 340 °C and 400 °C displays the appearance of aromatics (alkylbenzene/indans/naphthalenes) in the range δH/δC 6.0–8.0/120–140. Hardly any methoxylated products can be seen at 400 °C, confirming faster demethoxylatioin reactions at higher temperature. As evident from Fig. 10, 2D HSQC NMR results, mimic the 2D GC-MS findings which suggests that larger oligomeric products may have similar chemical functionalities compared to the GC-detectable products.
Overall, the results obtained via reductive liquefaction of sawdust samples demonstrate that the selectivity of the products can be tuned significantly by varying the processing conditions. Also, among the Mo variations, the catalyst 8MoAl displays notable depolymerization and deoxygenation activity with a moderate loading of Mo. The residual solid can be reduced down to <5 wt%. In addition, comparable cycloalkane/alkylbenzenes selectivity is obtained for catalysts with higher Mo-loading over γ-Al2O3 at the lower temperature (340 °C). At higher temperatures (400 °C) the selectivity for these fractions increased by 1.5-fold for the constant sawdust![[thin space (1/6-em)]](https://www.rsc.org/images/entities/char_2009.gif) :
:![[thin space (1/6-em)]](https://www.rsc.org/images/entities/char_2009.gif) catalyst ratio. At a high sawdust
catalyst ratio. At a high sawdust![[thin space (1/6-em)]](https://www.rsc.org/images/entities/char_2009.gif) :
:![[thin space (1/6-em)]](https://www.rsc.org/images/entities/char_2009.gif) catalyst ratio, the catalyst demonstrates high depolymerization activity with high alkylphenol selectivity. To elucidate the role of the Mo phases for evolved catalytic activity, the Mo-variation over γ-Al2O3 has been thoroughly investigated as described above in the ‘Characterization of synthesized catalysts’ section.
catalyst ratio, the catalyst demonstrates high depolymerization activity with high alkylphenol selectivity. To elucidate the role of the Mo phases for evolved catalytic activity, the Mo-variation over γ-Al2O3 has been thoroughly investigated as described above in the ‘Characterization of synthesized catalysts’ section.
Catalytic structure–activity relationship
Overall, based on the catalyst characterization and reductive liquefaction of sawdust discussed above, it is evident that there is a Mo-loading over the γ-alumina that ensures an efficient use of the active phase for the direct conversion of sawdust biomass. XRD, Raman, and SEM analysis showed the presence of octahedral, oligomeric Mo-oxide phases well dispersed over the γ-alumina support for the 8MoAl catalyst. H2-TPR analysis showed the presence of easily reducible species for 8MoAl. NH3-TPD results illustrated that the surface density of moderate-strength acidic sites increased with Mo-loading until a monolayer coverage of Mo-oxides was reached as with 8MoAl. Furthermore, importantly XPS analysis shows an increased fraction of active Mo5+ species for 8MoAl compared to other Mo-impregnated catalysts. As mentioned earlier, the presence of such Mo5+ species suggests the formation of coordinately unsaturated sites (CUS) due to the reduction of MoO3 to MoO3−x species.27 This oxygen vacancy formation typically promotes the HDO reactions. These attributes observed for 8MoAl facilitate the reductive thermal depolymerization and hydrodeoxygenation reaction to a significant extent, yielding high monomeric liquefied/deoxygenated products with lower residual solids. For instance, from Fig. 4(b) the reactivity, as indicated by the monomeric product yields, correlates fairly well with the total acidity of the catalysts up to a Mo-surface density of 3.2 Mo per nm2 (8MoAl). At this Mo-surface density, the density of medium acid sites approximately reaches a maximum. At higher Mo-loading, although the total acidity continues to increase, due mainly to a higher surface density of the strongest acid sites, this seems to have a negligible effect on the monomeric product yield. Also, from Fig. 6 it is clear that there is a gradual increase of the Mo5+ fraction from 4MoAl until 8MoAl followed by a continuous decrease with increasing Mo-loadings. The reactivity data also shows that the bio-oil/monomeric product yield formation was optimal for 8MoAl.Conclusions
In this study, direct conversion of sawdust biomass has been explored using a series of Mo-variants over γ-Al2O3 at 340–400 °C, 35 bar of initial H2 at 25 °C. At low temperatures, the reactivity data was found optimal for 8 wt% Mo-loading (8MoAl) which corresponds to a surface density of 3.2 Mo-atoms per nm2. At this point, the conversion of sawdust gives a total estimated bio-oil yield of 78% with a ∼25 wt% yield of GC-detectable monomeric products of which 38% is composed of cycloalkanes and alkylbenzene. For higher Mo-loading of 16 wt% (16MoAl), there is only a minor increase in the monomer product yield, but also a ∼21% increased solid residue yield compared to 8 wt% loading. At increased temperature of 400 °C, the fraction of deoxygenated products increased by a factor of 1.5, and solid residue yield decreased by about 50% for a biomass to catalyst ratio of 3![[thin space (1/6-em)]](https://www.rsc.org/images/entities/char_2009.gif) :
:![[thin space (1/6-em)]](https://www.rsc.org/images/entities/char_2009.gif) 1. The sawdust particle size had an influence on performance. Reducing the sawdust particle size to <100 μm could reduce the solid residue yield to under 5 wt%. At a higher biomass-to-catalyst ratio (10
1. The sawdust particle size had an influence on performance. Reducing the sawdust particle size to <100 μm could reduce the solid residue yield to under 5 wt%. At a higher biomass-to-catalyst ratio (10![[thin space (1/6-em)]](https://www.rsc.org/images/entities/char_2009.gif) :
:![[thin space (1/6-em)]](https://www.rsc.org/images/entities/char_2009.gif) 1), the catalyst showed high depolymerization activity and yields more alkylphenolic products, with less deoxygenated monocyclics, and alkylbenzenes, leading to the formation of 39.4 wt% of monomeric product yield. Characterization of the catalyst shows that at 8 wt% Mo-loading, the catalyst is composed of a well-dispersed octahedral oligomeric Mo-oxide monolayer with fewer polymeric species. As a result, the active phase could be reduced at a lower temperature to form active sites. XPS analysis indeed shows the evolution of a higher proportion of more active Mo5+ species over 8MoAl compared to the other Mo-loadings. These features rationalize the optimal catalytic activity observed for 8MoAl.
1), the catalyst showed high depolymerization activity and yields more alkylphenolic products, with less deoxygenated monocyclics, and alkylbenzenes, leading to the formation of 39.4 wt% of monomeric product yield. Characterization of the catalyst shows that at 8 wt% Mo-loading, the catalyst is composed of a well-dispersed octahedral oligomeric Mo-oxide monolayer with fewer polymeric species. As a result, the active phase could be reduced at a lower temperature to form active sites. XPS analysis indeed shows the evolution of a higher proportion of more active Mo5+ species over 8MoAl compared to the other Mo-loadings. These features rationalize the optimal catalytic activity observed for 8MoAl.
Conflicts of interest
There are no conflicts of interest to declare.Acknowledgements
This work is a collaboration between Chemical Engineering at Chalmers and SCA Forest Products AB. We would like to acknowledge the Swedish Energy Agency for funding (P52405-1). We would also like to thank the Swedish NMR center and Chalmers materials analysis laboratory for access to these infrastructures.References
- C. Li, X. Zhao, A. Wang, G. W. Huber and T. Zhang, Chem. Rev., 2015, 115, 11559–11624 CrossRef CAS PubMed.
- J. Zakzeski, P. C. A. Bruijnincx, A. L. Jongerius and B. M. Weckhuysen, Chem. Rev., 2010, 110, 3552–3599 CrossRef CAS.
- W. Schutyser, T. Renders, S. Van den Bosch, S. F. Koelewijn, G. T. Beckham and B. F. Sels, Chem. Soc. Rev., 2018, 47, 852–908 RSC.
- S. Gillet, M. Aguedo, L. Petitjean, A. R. C. Morais, A. M. da Costa Lopes, R. M. Łukasik and P. T. Anastas, Green Chem., 2017, 19, 4200–4233 RSC.
- R. Rinaldi, R. Jastrzebski, M. T. Clough, J. Ralph, M. Kennema, P. C. Bruijnincx and B. M. Weckhuysen, Angew Chem. Int. Ed. Engl., 2016, 55, 8164–8215 CrossRef CAS PubMed.
- F. Cheng and C. E. Brewer, Renewable Sustainable Energy Rev., 2017, 72, 673–722 CrossRef CAS.
- K. Lee, Y. Jing, Y. Wang and N. Yan, Nat. Rev. Chem, 2022, 6, 635–652 CrossRef.
- W. Deng, Y. Feng, J. Fu, H. Guo, Y. Guo, B. Han, Z. Jiang, L. Kong, C. Li and H. Liu, Green Energy Environ., 2023, 8, 10–114 CrossRef CAS.
- X. Zhang, H. Lei, L. Zhu, J. Wu and S. Chen, Green Chem., 2015, 17, 4736–4747 RSC.
- Y. Zhang, P. Bi, J. Wang, P. Jiang, X. Wu, H. Xue, J. Liu, X. Zhou and Q. Li, Appl. Energy, 2015, 150, 128–137 CrossRef CAS.
- A. Farooq, S. Shuing Lam, J. Jae, M. Ali Khan, B.-H. Jeon, S.-C. Jung and Y.-K. Park, Fuel, 2023, 333, 126313 CrossRef CAS.
- Z. Cao, M. Dierks, M. T. Clough, I. B. Daltro de Castro and R. Rinaldi, Joule, 2018, 2, 1118–1133 CrossRef CAS PubMed.
- H. Shafaghat, M. Linderberg, T. Janosik, M. Hedberg, H. Wiinikka, L. Sandström and A.-C. Johansson, Energy Fuels, 2021, 36, 450–462 CrossRef.
- A. Garron, W. A. Maksoud, C. Larabi, P. Arquillière, K. C. Szeto, J.-J. Walter and C. C. Santini, Catal. Today, 2015, 255, 75–79 CrossRef CAS.
- W. Al Maksoud, C. Larabi, A. Garron, K. C. Szeto, J. J. Walter and C. C. Santini, Green Chem., 2014, 16, 3031–3038 RSC.
- J. Shi, L. Sun, H. Yan and J. Wang, Energy Fuels, 2021, 36, 932–944 CrossRef.
- Y. Huang, L. Wei, Z. Crandall, J. Julson and Z. Gu, Fuel, 2015, 150, 656–663 CrossRef CAS.
- S. Cheng, L. Wei and M. Rabnawaz, Fuel, 2018, 223, 252–260 CrossRef CAS.
- S. Cheng, L. Wei, J. Julson, K. Muthukumarappan, P. R. Kharel, Y. Cao, E. Boakye, D. Raynie and Z. Gu, J. Taiwan Inst. Chem. Eng., 2017, 74, 146–153 CrossRef CAS.
- S. Cheng, L. Wei, M. R. Alsowij, F. Corbin, J. Julson, E. Boakye and D. Raynie, J. Energy Inst., 2018, 91, 163–171 CrossRef CAS.
- X. Zhang, H. Lei, L. Zhu, Y. Wei, Y. Liu, G. Yadavalli, D. Yan, J. Wu and S. Chen, Fuel, 2015, 160, 375–385 CrossRef CAS.
- G. Wang, W. Li, B. Li and H. Chen, Fuel, 2007, 86, 1587–1593 CrossRef CAS.
- Q. Xia, Z. Chen, Y. Shao, X. Gong, H. Wang, X. Liu, S. F. Parker, X. Han, S. Yang and Y. Wang, Nat. Commun., 2016, 7, 11162 CrossRef PubMed.
- C. Li, M. Zheng, A. Wang and T. Zhang, Energy Environ. Sci., 2012, 5, 6383–6390 RSC.
- Y. Liu, L. Chen, T. Wang, Q. Zhang, C. Wang, J. Yan and L. Ma, ACS Sustain. Chem. Eng., 2015, 3, 1745–1755 CrossRef CAS.
- D. Liu, Z. Li, C. Wu, L. Song, P. Wu, M. Li, C. Wang, Z. Men, Z. Yan and I. D. Gates, Appl. Catal., B, 2021, 297, 120499 CrossRef CAS.
- M. Shetty, K. Murugappan, T. Prasomsri, W. H. Green and Y. Román-Leshkov, J. Catal., 2015, 331, 86–97 CrossRef CAS.
- T. Prasomsri, M. Shetty, K. Murugappan and Y. Román-Leshkov, Energy Environ. Sci., 2014, 7, 2660–2669 RSC.
- K. Murugappan, C. Mukarakate, S. Budhi, M. Shetty, M. R. Nimlos and Y. Román-Leshkov, Green Chem., 2016, 18, 5548–5557 RSC.
- V. S. Marakatti, D. Mumbaraddi, G. V. Shanbhag, A. B. Halgeri and S. P. Maradur, RSC Adv., 2015, 5, 93452–93462 RSC.
- X. Y. S. W. a. S. W. Jinlong Gonga and X. Maa, React. Kinet. Catal. Lett., 2005, 84, 79–86 CrossRef.
- A. Christodoulakis, E. Heracleous, A. Lemonidou and S. Boghosian, J. Catal., 2006, 242, 16–25 CrossRef CAS.
- K. Chen, S. Xie, A. T. Bell and E. Iglesia, J. Catal., 2001, 198, 232–242 CrossRef CAS.
- W. I. E, D. S. Kim and K. Segawa, J. Catal., 1994, 149, 268–277 CrossRef.
- M. W. Nolte, J. Zhang and B. H. Shanks, Green Chem., 2016, 18, 134–138 RSC.
- A. Eschenbacher, A. Saraeian, B. H. Shanks, P. A. Jensen, C. Li, J. Ø. Duus, A. B. Hansen, U. V. Mentzel, U. B. Henriksen, J. Ahrenfeldt and A. D. Jensen, Sustainable Energy Fuels, 2020, 4, 1991–2008 RSC.
- J. A. Onwudili and C. A. Scaldaferri, Fuel, 2023, 352, 129015 CrossRef CAS.
- Y. W. Cheah, R. Intakul, M. A. Salam, J. Sebastian, P. H. Ho, P. Arora, O. Öhrman, D. Creaser and L. Olsson, Chem. Eng. J., 2023, 475, 146056 CrossRef CAS.
- E. Nejadmoghadam, A. Achour, P. Sirous-Rezaei, M. A. Salam, P. Arora, O. Öhrman, D. Creaser and L. Olsson, Fuel, 2023, 353, 129094 CrossRef CAS.
- M. Abdus Salam, D. Creaser, P. Arora, S. Tamm, E. Lind Grennfelt and L. Olsson, Catalysts, 2018, 8, 418 CrossRef.
- M. A. Salam, Y. W. Cheah, P. H. Ho, L. Olsson and D. Creaser, Sustainable Energy Fuels, 2021, 5, 3445–3457 RSC.
- M. A. Salam, P. Arora, H. Ojagh, Y. W. Cheah, L. Olsson and D. Creaser, Sustainable Energy Fuels, 2020, 4, 149–163 RSC.
- J. Wojtasz-Mucha, M. Hasani and H. Theliander, Bioresour. Technol., 2017, 241, 120–126 CrossRef CAS PubMed.
- J. Wojtasz-Mucha, M. Hasani and H. Theliander, Wood Sci. Technol., 2021, 55, 811–835 CrossRef CAS.
- S. Patnaik, G. Swain and K. M. Parida, Nanoscale, 2018, 10, 5950–5964 RSC.
- Y. Wu, H. Wang, W. Tu, S. Wu and J. W. Chew, Appl. Organomet. Chem., 2019, 33, e4780 CrossRef.
- Q. Bkour, O. G. Marin-Flores, M. G. Norton and S. Ha, Appl. Catal., B, 2019, 245, 613–622 CrossRef CAS.
- C. A. R. Hanjing Tian and I. E. Wachs, J. Phys. Chem. C, 2010, 114, 14110–14120 CrossRef.
- M. Dieterle, G. Weinberg and G. Mestl, Phys. Chem. Chem. Phys., 2002, 4, 812–821 RSC.
- M. A. V. a. I. E. Wacbs, J. Phys. Chem., 1992, 96, 5008–5016 CrossRef.
- J. Strunk, M. A. Bañares and I. E. Wachs, Top. Catal., 2017, 60, 1577–1617 CrossRef CAS.
- M. F. L. Seguin, R. Cavagnat and J. C. Lasskgues, Spectrochim. Acta, Part A, 1995, 51, 1323–1344 CrossRef.
- G. Tsilomelekis and S. Boghosian, Catal. Sci. Technol., 2013, 3, 1869–1888 RSC.
- K. Chary, J. Catal., 2004, 226, 283–291 CrossRef CAS.
- R. T. E. M. V. O. V. H. J. D. B and J. M. J. A. MOULIJN, J. Catal., 1982, 76, 241–253 CrossRef.
- J. Horáček, F. Homola, I. Kubičková and D. Kubička, Catal. Today, 2012, 179, 191–198 CrossRef.
- T. D. Matson, K. Barta, A. V. Iretskii and P. C. Ford, J. Am. Chem. Soc., 2011, 133, 14090–14097 CrossRef CAS PubMed.
- T. Renders, E. Cooreman, S. Van den Bosch, W. Schutyser, S. F. Koelewijn, T. Vangeel, A. Deneyer, G. Van den Bossche, C. M. Courtin and B. F. Sels, Green Chem., 2018, 20, 4607–4619 RSC.
- E. Baráth, Catalysts, 2018, 8, 671 CrossRef.
- G. Zhu, X. Xing, J. Wang and X. Zhang, J. Mater. Sci., 2017, 52, 7664–7676 CrossRef CAS.
- F. Kong, K. Parhiala, S. Wang and P. Fatehi, Eur. Polym. J., 2015, 67, 335–345 CrossRef CAS.
- B. Joffres, C. Lorentz, M. Vidalie, D. Laurenti, A. A. Quoineaud, N. Charon, A. Daudin, A. Quignard and C. Geantet, Appl. Catal., B, 2014, 145, 167–176 CrossRef CAS.
- G. Charis, G. Danha and E. Muzenda, Processes, 2020, 8, 546 CrossRef CAS.
- M. Thakur, A. Sharma, V. Ahlawat, M. Bhattacharya and S. Goswami, Mater. Sci. Energy Technol., 2020, 3, 328–334 CAS.
- P. Yan, Z. Xu, C. Zhang, X. Liu, W. Xu and Z. C. Zhang, Green Chem., 2015, 17, 4913–4920 RSC.
- M. N. M. Ibrahim, A. Iqbal, C. C. Shen, S. A. Bhawani and F. Adam, BMC Chem., 2019, 13, 17 CrossRef PubMed.
Footnote |
| † Electronic supplementary information (ESI) available. See DOI: https://doi.org/10.1039/d3se01539d |
| This journal is © The Royal Society of Chemistry 2024 |

