 Open Access Article
Size dependent effectiveness of engineering and administrative control strategies for both short- and long-range airborne transmission control†
Xiaowei
Lyu
 a,
Zhiwen
Luo
*b and
Li
Shao
a
aSchool of the Built Environment, University of Reading, UK
bWelsh School of Architecture, Cardiff University, UK. E-mail: LuoZ18@Cardiff.ac.uk
First published on 5th December 2023
Abstract
Ventilation is recognized as an effective mitigation strategy for long-range airborne transmission. However, a recent study by Li et al. revealed its potential impact on short-range airborne transmission as well. Our study extends their work by developing size-dependent transmission models for both short- and long-range airborne transmission and evaluates the impact of various control strategies, including ventilation. By adopting a recently determined mode-dependent viral load, we first analyzed the role of different sizes of droplets in airborne transmission. In contrast to models with a constant viral load where large droplets contain more viruses, our findings demonstrated that droplets ranging from ∼2–4 μm are more critical for short-range airborne transmission. Meanwhile, droplets in the ∼1–2 μm range play a significant role in long-range airborne transmission. Furthermore, our study indicates that implementing a size-dependent filtration/mask strategy considerably affects the rate of change (ROC) of virus concentration in relation to both distancing and ventilation. This underscores the importance of factoring in droplet size during risk assessment. Engineering controls, like ventilation and filtration, as well as administrative controls, such as distancing and masks, have different effectiveness in reducing virus concentration. Our findings indicate that high-efficiency masks can drastically reduce virus concentrations, potentially diminishing the impacts of other strategies. Given the size-dependent efficiency of filtration, ventilation has a more important role in reducing virus concentration than filtration, especially for long-range airborne transmission. For short-range airborne transmission, maintaining distance is far more effective than ventilation, and its effectiveness is largely unaffected by ventilation. However, the influence of ventilation on virus concentration and its variation with the distance mainly depend on the specific transmission model utilized. In sum, this research delineates the differential roles of droplet sizes and control strategies in both short- and long-range airborne transmission, offering valuable insights for future size-dependent airborne transmission control measures.
Environmental significanceAirborne transmission, including both short- and long-range spread, is the primary route of infection for respiratory diseases within indoor environments. However, previous studies have often overlooked the influence of ventilation on short-range airborne transmission and the impact of droplet size. To address these research gaps, we developed size-dependent transmission models for short- and long-range airborne transmission, allowing for a re-evaluation of various control strategies' effectiveness. Our results highlight that ventilation can reduce virus concentration by approximately 10% for short-range airborne transmission. We also find that size-dependent control strategies can significantly alter the rate of change in virus concentration in relation to size-independent strategies. These findings provide new insights into airborne transmission control and stress the importance of considering both ventilation and droplet size when developing effective mitigation strategies. |
1 Introduction
Short- and long-range airborne infection transmission control is crucial for limiting COVID-19's spread indoors. Short-range airborne transmission refers to the inhalation of air-suspended virus-laden droplets in close proximity1,2 and is identified as the predominant route of SARS-CoV-2 transmission in close contact.3 Conversely, long-range airborne transmission refers to the inhalation of infectious aerosols at a distance and often leads to outbreaks of COVID-19 in poorly ventilated spaces.4,5 Great efforts have been made to identify effective strategies for controlling both short- and long-range airborne transmissions, with ventilation, filtration, social distancing, and mask wearing being widely adopted.6–8Ventilation and filtration are mainly designed to reduce long-range airborne transmission.8–11 A study by Shen et al.11 found that doubling the ventilation rate could reduce long-range airborne transmission by approximately 37%. The same study revealed that high-efficiency filters offer risk reductions comparable to increased outdoor ventilation. Meanwhile, maintaining a critical social distance addresses short-range transmission (including large droplet transmission and short-range airborne transmission), especially given the heterogeneous spatial distribution of expelled virus-laden droplets.12–14 When the distance exceeds 2 m, the effects of short-range airborne transmission would diminish with airborne virus concentration in the jet, dropping to the background virus concentration level.15 Wearing masks, as a source control strategy, can reduce both short- and long-range airborne transmission.16,17 Notably, a well-sealed N95 mask can lead to more than 95% risk reduction for both short- and long-range airborne transmission.11,15
Despite the high effectiveness of those control strategies, they are primarily assessed through models that treat short- and long-range airborne transmission as two independent transmission routes. However, recent studies suggest a continuum from short- to long-range airborne transmission, leveraging a macroscopic aerosol balance model.1,18–20 Virus concentration in the expired jet decreases with the distance and merges into the background air. During this decay process, background room air provides dilution to the expired jet through entrainment. This entrainment process reveals an interplay: viruses contained in the background room air contributing to long-range airborne transmission can also affect short-range airborne transmission.1,18–20 Consequently, engineering control strategies of ventilation and filtration can affect both short- and long-range airborne transmission. Furthermore, the effectiveness of maintaining social distance as a control for short-range transmission may also be affected by ventilation. Given these insights, it's imperative to re-evaluate the effectiveness of both engineering and administrative control strategies in light of this expanded understanding of airborne transmission.
In fact, there are a few recent studies that considered the impact of long-range airborne transmission on short-range airborne transmission in assessing different control strategies. Wagner et al.21 evaluated the effectiveness of various control strategies for near-field transmission by directly adding up short- and long-range airborne transmission. They found that the impact of distancing on risk reduction is also affected by ventilation, especially when the air change rate (ACH) is high. However, the additive nature of long-range effects on short-range transmission remains a topic of debate. In a separate study, Li et al.1 reassessed the effectiveness of ventilation on short-range airborne transmission reduction, with consideration of the contaminated room air entrainment. They highlighted the detrimental effects of inadequate ventilation on short-range airborne transmission and advocated for a baseline ventilation rate of 10 L s−1. However, besides ventilation, other control strategies such as filtration and masks and their interactions should also be reassessed.
In addition, droplet size is pivotal in airborne transmission, affecting it in at least two primary ways. First, different respiratory activities can produce varying droplet size distributions, resulting in different roles of droplets in airborne transmission.22,23 Recent studies suggested that the viral load of SARS-CoV-2 may be highly size-dependent, with most RNA copies coming from fine particles (diameter ≤ 5 μm), e.g., up to 85% of detected RNA copies were found to come from fine particles,24,25 which is possibly due to the different generation mechanism and origin sites in the respiratory tract.26 The high viral load in fine particles may redefine the role of droplet size in airborne transmission, but it has not yet been estimated. Second, droplet size can affect the surface deposition rate, filtration efficiency, mask efficiency, etc., and further affects the effectiveness of different control strategies.27–29 However, many earlier studies employed constant values in their analyses, including a constant viral load, raising questions about the accuracy of such models.4,30,31 It's essential to discern if results differ when considering size-dependent strategies versus fixed values.
Extending from the newly developed macroscopic aerosol balance model that links short- and long-range airborne transmission,1 this study aims to estimate the effectiveness and impacts of engineering control strategies (i.e., ventilation and filtration) and administrative control strategies (i.e., masks and distancing) in reducing virus concentration for short- and long-range airborne transmission. We prioritize two focal points: (1) droplet size's impact; (2) ventilation's role in short-range airborne transmission. Our approach is threefold. First, we re-estimate the role of different sizes of droplets in airborne transmission, integrating mode-dependent viral load from Stettler et al.32 (Section 3.1). Then, we emphasize the importance of adopting size-dependent control strategies instead of constant variables in airborne transmission due to the impact of droplet size (Section 3.2). Finally, we re-evaluate the effectiveness of different control strategies for airborne transmission (including short- and long-range airborne transmission) (Section 3.3).
2 Methods
2.1 Virus concentration estimation
To estimate virus concentration for short- and long-range airborne transmission, the room space was divided into two zones, specifically, jet zone and room zone, see Fig. 1. Exhaled droplets with an initial diameter of d0 ≤ 50 μm are considered in the jet zone and contribute to short-range airborne transmission. Only exhaled droplets with an initial diameter of d0 ≤ 10 μm will spread to the room zone and contribute to long-range airborne transmission.1,23 A critical distance of 2 m is adopted to distinct short- and long-range airborne routes. When the distance between the infector and susceptible individual is less than 2 m, the individual will inhale viruses from the jet zone, otherwise, from the room zone.1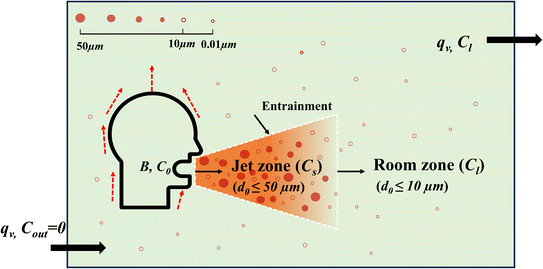 | ||
| Fig. 1 A simple size-dependent model of the continuum from short-range to long-range inhalation routes (modified from Li et al.1). | ||
We assumed that there is only 1 infector and 1 susceptible person indoors, and the outdoor virus concentration is equal to zero. The steady-state size-dependent virus concentration in the room zone is derived from the mass balance equation based on a well-mixed assumption and expressed as:1,33
 | (1) |
| q(d) = qv + qd + qf(d) + qs(d) | (2) |
Based on a dilution factor of S, room air with low virus concentration can dilute the jet zone where the virus concentration is high. Here, S is equal to 0.32x/dm, where x is the distance between the susceptible individual and infector and dm is the mouth diameter of 20 mm.1 The size-dependent virus concentration (Cs(d)) in the expired jet zone can be expressed as eqn (3).
 | (3) |
It is important to note that the jet zone contains droplets within 50 μm, while the room zone only contains droplets within 5 μm. Therefore, Cl(d) is equal to zero when d > 5 μm in eqn (3).
2.2 Size-dependent variables
| Mode | B | L | O |
|---|---|---|---|
| N (cm−3) | 0.0540 | 0.0684 | 0.00126 |
| CMD (μm) | 1.61 | 2.40 | 144.7 |
| GSD | 1.30 | 1.66 | 1.80 |
In light of recent evidence that most RNA copies come from fine particles (d1 ≤ 5 μm) which are most likely to be produced in the lower respiratory tract,25,36 we scale the viral load in B and L modes relative to O mode of the exhaled droplets following the method proposed by Stettler et al.32 We operate under the assumption that B and L modes have a higher viral load than O mode, with the ratio of viral load in B and L modes to O mode being r. As a consequence, the total virus quantity (nvirus) contained in breath air can be expressed as follows:
| nvirus = vOrVB + vOrVL + vOVO | (4) |
Accepting the result from Coleman et al.24 which states that approximately 85% of viruses are contained in droplets with a diameter of 5 μm or less, we can establish the relationship that nvirus(d ≤ 0.5)/nvirus = 0.85. Substituting this into eqn (4), we can solve for the viral load ratio, r, as:
 | (5) |
Considering the study by Coleman et al.,24 the detected droplets are understood to be evaporated droplets. Consequently, the droplet volume in eqn (5) pertains to evaporated droplets. Recalling the BLO model, Johnson et al.23 corrected only the droplets in B and L modes for evaporation. Therefore, we need to convert only the droplets in B and L modes to their evaporated state for VBL in eqn (5), using an evaporation factor of 0.5. Similarly, the ratio r calculated for droplets with final diameters needs to be adjusted to represent the ratio at the mouth by multiplying it with a correction factor of 0.125 (which is the evaporation factor raised to the third power).
Based on the calculations above and using the BLO model detailed in Table 1, the ratio r is around 6 × 10⁴ for initial droplets in B and L modes relative to evaporated droplets in O mode. It should be noted that Stettler et al.32 established the viral load ratio of B (or L) mode relative to O mode but did not specify the actual viral load. Given that a wide viral load range of 102 to 1011 copies per mL has been found,37 we opted to use the median value of 107 copies per mL as the average viral load (vavr) for droplets at the mouth4 and further calculated the mode-dependent viral load following eqn (6). The results show a viral load of ∼3 × 10¹⁰ copies per mL for B and L modes and ∼5 × 10⁵ copies per mL for O mode.
 | (6) |
It should be noted that in eqn (6), VB and VL are calculated based on droplets with initial diameters (as corrected by Johnson et al.23) and VO is calculated based on droplets with final diameters as the droplets in O mode haven't been corrected for evaporation by Johnson et al.23
The settling rate for droplets with diameter (d) ≤ 10 μm is obtained from a fitted equation according to previous measurements:1
| K = 0.4636d − 0.1869 | (7) |
Meanwhile, for droplets with diameter (d) > 10 μm, the settling rate can be calculated through a simplified equation as follows:1,38
 | (8) |
 | (9) |
By adopting the above equations, the droplet settling rate can be easily obtained. For instance, the settling rate for droplets with a diameter of 5 μm and 15 μm is approximately 2.1 h−1 and 8.1 h−1 respectively. It should be noted that the settling rate of droplets for long-range airborne transmission should be calculated with a final diameter.
| m(d) = 1 − (am × ln(d) + bm) | (10) |
2.3 Control strategy and base case
We estimate the effectiveness of two administrative control strategies (masks and social distancing) and two engineering control strategies (ventilation and filtration) for a small office room. Only 1 infector and 1 susceptible person with the most common indoor activity of “sedentary activity – speaking” are considered in the indoor environment. The adopted ranges of different control strategies and environmental parameters for the base case are shown in Table 2.3 Results and discussion
3.1 Size-dependent virus concentration under different control strategies
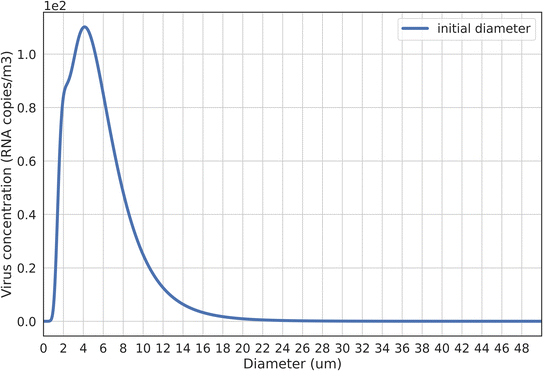
By applying a three-mode droplet size distribution coupled with a mode-dependent viral load,23,32 we find that exhaled droplets with d0 ≤ 10 μm play a more important role in airborne transmission than larger droplets. This observation aligns with recent findings presented by Y. Wang et al.44 The droplet size-dependent virus concentration in exhaled breath air is shown in Fig. 2. Around 90% exhaled viruses come from droplets with d0 ≤ 10 μm, with a peak virus concentration observed at ∼4 μm. This left skewed size-dependent virus concentration is consistent with previous measurements that detected a high viral load in fine particles.45–47 Based on this distribution, it can be inferred that respiratory activities producing a larger number of small droplets can expel more viruses, underscoring their significance in airborne transmission.23,32 This might provide an explanation for findings suggesting singing as a potent transmission source,5 given that singing releases a larger number of small droplets.48,49 However, many earlier studies, which employed a constant viral load, posited that respiratory activities like coughing and sneezing, which produce a larger number of larger droplets, were more likely to spread viruses.4,30,50,51 In light of our findings, such assumptions may require reconsideration. When factoring in the mode-dependent viral load, the roles of different respiratory activities and the efficiency of control strategies might need reevaluation.Based on droplet size-dependent virus concentration in breath air illustrated in Fig. 2, the viral load fraction attributable to speaking respiratory activity is close to 0.9. This viral load fraction, as determined by Li et al.,1 represents the proportion of expired viruses spreading in the jet zone that can spread to the room zone. With a higher viral load fraction, room air viruses can more significantly affect short-range airborne transmission. Although Li et al.1 compared the normalized concentration across various viral load fractions (ranging from 0.1 to 0.9), they did not specify a particular fraction value. Our results indicate that by defining a final diameter of 5 μm as the threshold for droplets spreading to room air1 and employing an evaporation factor of 0.5,23 roughly 90% of exhaled viruses can spread to the room air. This underlines the substantial influence of room air viruses on short-range airborne transmission and suggests that by altering room air virus concentrations, ventilation can wield a significant influence on short-range airborne transmission, especially when compared to a lower viral load fraction.
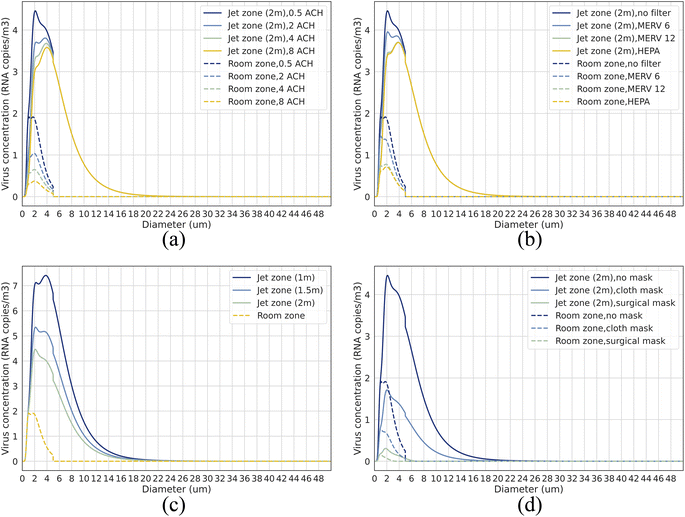
The droplet size-dependent virus concentration in ambient room air under different control strategies is shown in Fig. 3. Droplets with different diameters contribute differently to airborne transmission. For short-range airborne transmission (≤2 m), approximately 90% of the viruses in the expired jet are contributed by droplets ≤ 10 μm, peaking around ∼2–4 μm, when taking into account room air virus entrainment. For long-range airborne transmission (distance > 2 m), viruses all come from droplets ≤ 5 μm (peaking around ∼1–2 μm) as we take 5 μm as the critical final diameter for droplets spreading to room air. It should be noted that although current studies have assessed infection risk by aggregating viruses from different-sized droplets and assuming they have equal infectivity,12,51 droplets of various sizes can actually deposit in different locations within the respiratory tract, leading to varying infectivity levels.52,53 Simply aggregating viruses from droplets of all sizes to estimate infection risk can introduce biases, skewing evaluations regarding the role of diverse virus-laden droplets in transmission dynamics. Consequently, in our study, we prioritize virus concentration as our evaluative metric over infection risk. Our results intuitively depict the size-dependent virus concentration in the surrounding air under different control strategies, providing references for size-dependent infection risk estimation and giving inspirations of how to develop more effective control strategies with consideration of droplet size impact in future studies. As shown in Fig. 3, ventilation and filtration can only reduce droplets of size smaller than 5 μm (impacting room air directly), while distancing and masks can affect droplets within the entire diameter range studied (≤50 μm). Amplifying the efficiency of filtration and masks, especially targeting specific droplet dimensions (e.g., 1–4 μm), could offer a pragmatic route to enhance control over airborne transmission.
3.2 Impact of size-dependent control strategies on airborne transmission
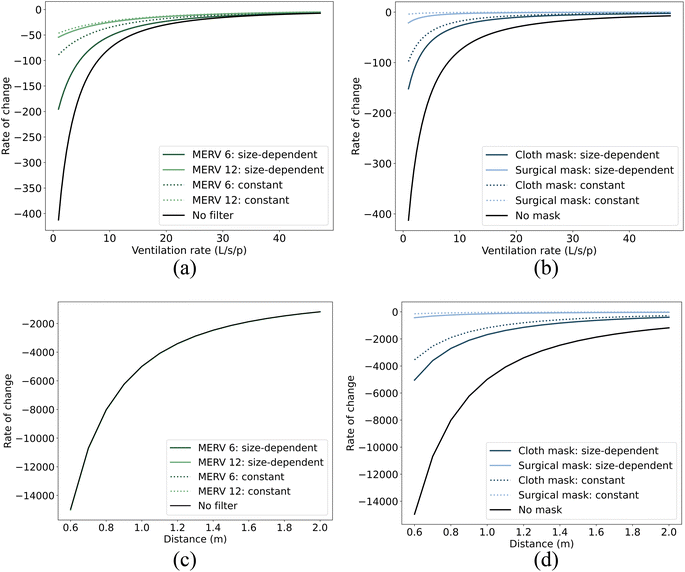
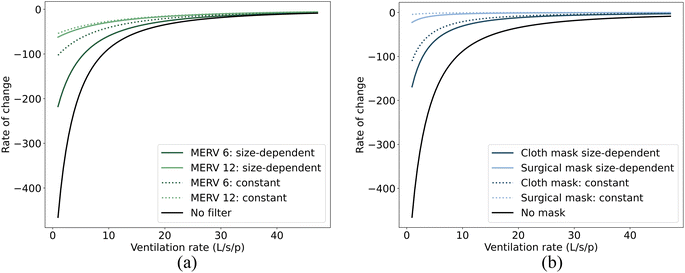
In this study, we have considered how size-dependent control strategies, such as filtration and masks, can alter the size distribution of airborne droplets in both the jet zone and the room zone, see Section 3.1. This change may, in turn, influence the effectiveness of non-size-dependent control strategies, such as ventilation and physical distancing, in controlling the airborne transmission of viruses. Our objective here is to determine whether size-dependent strategies like filtration/masks can influence the effectiveness of non-size-independent strategies like ventilation and distancing in reducing virus concentration in the air. Fig. 4 and 5 present the rate of change (ROC) in virus concentration in relation to the ventilation and distance. The illustration compares scenarios without filters or masks against those with filters or masks, both with size-dependent and with size-independent (constant) efficiencies. This constant efficiency represents the average of the size-dependent efficiencies as inferred from our research. To illustrate, filtration efficiencies of approximately 55% for MERV 6 filters and 97% for MERV 12 filters were determined, while mask efficiencies were found to be around 76% for cloth masks and 99% for surgical masks, respectively. The ROC provides insight into the rapidity of changes in virus concentration with respect to the ventilation/distance. A negative ROC suggests a decrease in virus concentration with an increase in the ventilation/distance, and vice versa. A high absolute ROC value indicates a steep change in virus concentration for a slight modification in the ventilation/distance. In contrast, a low absolute ROC value signifies a more gradual change in virus concentration.Fig. 4 and 5 demonstrate that compared to the constant efficiency of filtration, size-dependent filtration can significantly change the rate at which virus concentration changes with respect to ventilation for both short- and long-range airborne transmission (Fig. 4(a) and 5(a)). However, it has little impact on the rate of change with respect to distancing for short-range airborne transmission (Fig. 4(c)). On the other hand, size-dependent mask usage influences the rate of change in virus concentration with respect to both distancing (Fig. 4(d)) and ventilation (Fig. 4(b)). This may be because the ROC is predominantly influenced by the absolute changes in virus concentration. Since the absolute change in virus concentration with distancing for short-range airborne transmission is much larger than with filtration, the ROC is almost unaffected by the types of filters used. Overall, adopting droplet size-dependent efficiencies for filtration and masks can cause the ROC curves to deviate further from zero when compared to using constant efficiencies. This indicates a steeper change in virus concentration with respect to ventilation or distance when size-dependent filtration and masks are employed.
Many previous studies considered the impact of droplet size in risk assessment.46,54 In contrast, others have opted for a more simplified approach by assigning constant values to size-dependent parameters, such as filtration and mask efficiencies.50,55,56 Our results emphasize the necessity of factoring in size-dependent efficiencies for filtration and masks when evaluating different control strategies for airborne transmission. The rate of change (ROC) adopted in our study can provide insight into potential diminishing returns, aiding in the determination of an optimal ventilation rate or distancing strategy to mitigate infection risk. Some studies, like Jia et al.,57 have sought to identify ventilation benchmarks to regulate airborne transmission by determining a ROC threshold that approaches zero. Yet, our findings indicate that the specific ventilation benchmark might fluctuate considerably based on the choice between size-dependent filtration efficiencies and constant efficiencies for filters and masks. In the context of our study—a small office room accommodating two individuals (1 infector and 1 susceptible person)—we adopted a ventilation benchmark of 10 L per s per person to determine the ROC threshold for infection risk control in scenarios without filtration or masks, in line with recommendations made by other studies.1,57 To attain an equivalent ROC, the necessary ventilation rate thresholds vary in scenarios that involve the use of either constant or size-dependent filters/masks. These differences in ventilation rate thresholds are detailed in Table 3. It's noteworthy that the ventilation rate threshold exhibits a more pronounced increase when subjected to either a lower size-dependent filtration or a lower size-dependent mask.
| Size-dependent control strategies | Constant | Size-dependent |
|---|---|---|
| MERV 6 | 2.4 | 7.1 |
| MERV 12 | 0.9 | 0.9 |
| Cloth mask | 1.9 | 3.8 |
| Surgical | 0.9 | 0.9 |
3.3 Effectiveness and impact of different control strategies
Fig. 6 and 7 illustrate the relative concentration reduction resulting from different control strategies. The term “relative concentration (=(concentration)studied-case/(concentration)base-case)” refers to the virus concentration relative to the base case value described in Section 2.3. A small value of relative concentration indicates high effectiveness of the control strategy in reducing virus concentration.58 In addition to relative concentration, the term of “concentration range = ((relative concentration)max/(relative concentration)min)” was used to reflect the impact of different control strategies on virus concentration, with a higher concentration range indicating a greater impact.21 The maximum or minimum value of relative concentration is determined by the range of each control strategy adopted. In terms of visualization, the color intensity in the heatmap can visually represent the magnitude of relative concentration, with the red color indicating higher virus concentration than the base case, while blue indicating lower virus concentration than the base case. The variation in color reflects the magnitude of the concentration range, with a greater variation indicating a large concentration range and therefore a greater impact of the corresponding control strategy on virus concentration. Specific values related to the relative concentration and concentration range of our studied case can be found in Table 4.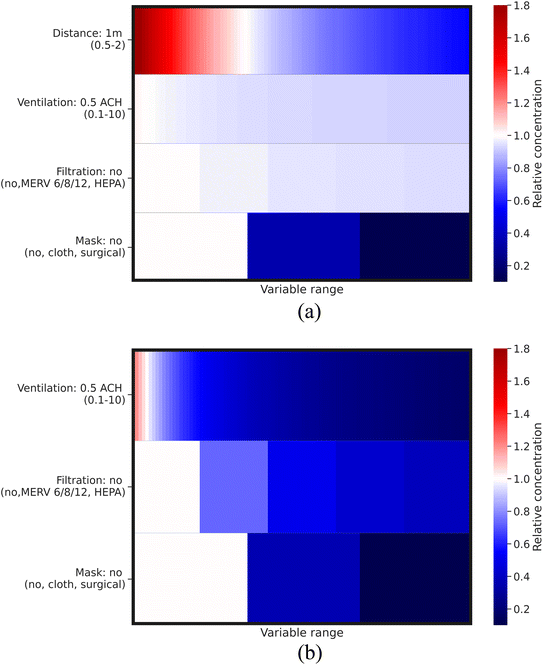 | ||
| Fig. 6 Relative virus concentration for (a) short-range airborne transmission and (b) long-range airborne transmission, with the variable range referred to in Table 2. | ||
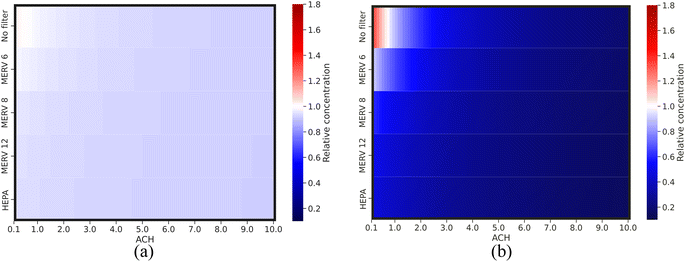 | ||
| Fig. 7 Relative virus concentration compared to the base case as a function of different variable pairs for (a) short-range airborne transmission and (b) long-range airborne transmission. | ||
| Parameters | Base case (range) | Short-range airborne transmission | Long-range airborne transmission | ||||
|---|---|---|---|---|---|---|---|
| Rel. conc. at param. min. | Rel. conc. at param. max. | Concentration range | Rel. conc. at param. min. | Rel. conc. at param. max. | Concentration range | ||
| Ventilation | 0.5 ACH (0.1–10) | 0.92 | 1.03 | 1.1 | 0.17 | 1.27 | 7.5 |
| Filtration | No (no, MERV 6/8/12, HEPA) | 0.94 | 1 | 1.1 | 0.39 | 1 | 2.7 |
| Distance | 1 m (0.5–2) | 0.55 | 1.90 | 3.5 | — | — | — |
| Mask | No (no, cloth/surgical mask) | 0.03 | 1 | 33.3 | 0.04 | 1 | 25 |
Fig. 6 depicts that using masks is the most effective control strategy and has the greatest impact on reducing virus concentration for both short-range airborne transmission (33-fold concentration range) and long-range airborne transmission (25-fold concentration range). The minimum relative concentration achieved by masks is approximately 0.03 and 0.04 for short- and long-range airborne transmission, respectively. Additionally, masks can significantly attenuate the impact of ventilation and filtration on the reduction of virus concentration (refer to Fig. 8). This suggests that with the use of a high-efficiency mask, the importance of other control strategies is diminished. However, the efficiency of masks is highly dependent on the material filtration efficiency and the fit to users' face.7,17,59 If poorly fitted, the leakage of a mask can even reach 70–85%.60 Therefore, even though a high-efficiency mask can achieve a significant reduction in virus concentration, the impact of other control strategies cannot be ignored. Improving the fit of masks through technological advancements and increasing their usage rate through policy measures are crucial steps towards effective transmission control in the future.
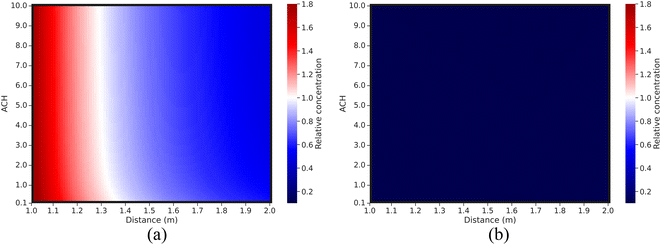 | ||
| Fig. 8 Relative virus concentration compared to the base case as a function of different variable pairs for short-range airborne transmission: (a) without a mask; (b) with a surgical mask. | ||
Fig. 6 and 7 demonstrate that engineering control strategies of filtration and ventilation exhibit a diminishing return phenomenon in reducing virus concentration for short- and long-range airborne transmission, indicating that controlling airborne transmission solely through engineering control strategies may not be sufficient. The impact of ventilation and filtration is greater for long-range airborne transmission (up to 7.5-fold concentration range) than that for short-range airborne transmission (up to 1.1-fold concentration range). Their effectiveness is also much higher for long-range airborne transmission than for short-range. For short-range airborne transmission, approximately 0.92–0.94 minimum relative concentration can be achieved by engineering control strategies, reducing virus concentration up to ∼10% compared to the base case. For long-range airborne transmission, the minimum relative concentration is between 0.17 and 0.39. This indicates a much more important role of engineering control strategies for long-range airborne transmission than for short-range airborne transmission.9,61–63 Furthermore, ventilation demonstrates a more crucial role than filtration in decreasing virus concentrations, particularly in the context of long-range airborne transmission. The minimum relative concentration achieved through filtration is roughly twice as high as that achieved through ventilation for long-range airborne transmission. This discrepancy arises from the size-dependent nature of filtration efficiency. Smaller droplets exhibit lower filtration efficiency compared to their larger counterparts. In contrast, ventilation can remove droplets of all sizes, thus making it more efficacious than filtration.
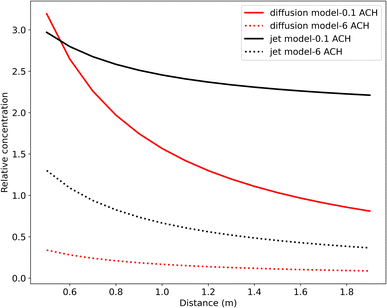
Fig. 6 and 8 demonstrate that distancing is a more effective control strategy than ventilation for short-range airborne transmission.6,12,13,64 The concentration range for distancing is around 3.5-fold. The minimum relative virus concentration reaches approximately 0.55 when maintaining a 2 m distance. As depicted in Fig. 8(a), the relationship between the relative concentration and distance remains relatively unchanged when the ventilation rate exceeds approximately 1 ACH. This is different from the study by Wagner et al.,21 where ventilation exhibited a more pronounced impact on the variation of virus concentration with the distance. Among the plausible explanations is that we used different models to simulate short-range airborne transmission. In our study, the dispersion of initially exhaled viruses in the expired jet is solely influenced by the distance. However, in the study of Wagner et al.,21 a modified diffusion model was adopted, making the dispersion of initially exhaled viruses to be dominated by both ventilation and distancing. A high ventilation rate can generate significant virus dispersion in their study, thereby enhancing the importance of ventilation for the control of short-range airborne transmission and also influencing how virus concentrations vary with the distance. We have conducted a comparative study of these two models for short-range airborne transmission, see Fig. 9 (specific information can be found in the ESI Appendix†).
The relative concentrations displayed in Fig. 9 represent the virus concentration, which is initially normalized by the concentration at the mouth and then compared to the base case. Our results reveal that the effectiveness of ventilation in reducing virus concentration for short-range airborne transmission varies considerably between the two models used. Notably, even with the same level of ventilation, the relative concentration differs significantly. Moreover, at a low air change rate per hour (ACH), the relative concentration derived from the diffusion model decreases more dramatically with an increased distance compared to the results from a high ACH. In contrast, the gradient of the relative concentration derived from the jet model remains relatively consistent across varying ACH values. These observations underscore that the diffusion model, when used to simulate short-range airborne transmission, may amplify the influence of distancing on reducing virus concentration. The variations in outcomes among our studies revealed a research gap related to how to better simulate short-range airborne transmission through analytical models. The choice of the model can lead to divergent assessments of control strategy effectiveness.
4 Limitations
Our study contains several major limitations. Just as described by Li et al.,1 steady-state well-mixed room air and a steady expired jet were assumed for simulating short-range airborne transmission, while in reality, unsteady-state and unevenly distributed room air viruses can exist.65–67 Additionally, expired flows are typically not constant but intermittent. In line with this observation, a recent study by Jia et al.57 attempted to use a two-stage jet in place of a steady one to simulate the intermittent nature of respiratory activity in the context of short-range airborne transmission. This approach could potentially be adopted in future evaluations of different strategies for transmission control. Besides, the simplified jet model assumes stagnant ambient air, neglecting the potential impact of ambient turbulence on droplet dispersion,68,69 while it was found by a measurement that the dispersion of low-velocity droplets released by non-violent respiratory activity such as breathing can be significantly affected by ventilation-induced air currents.7 Moreover, the 2 m threshold distance for short-range airborne transmission can be somewhat arbitrary, which may change when more realistic expired-jet data are available in future.1 Similarly, the 50 μm threshold for the droplet diameter in the respiratory jet also represents a generalization.1 Variations in indoor environments, characterized by differing temperatures and humidity levels, can influence this threshold by affecting the evaporation and deposition dynamics of these droplets.70 Finally, mask usage can in fact affect the transmission of expired viruses in the jet zone,57 and we did not account for this impact in our study.5 Conclusion
A recent study by Li et al.1 proved the impact of ventilation on short-range airborne transmission through relating short- and long-range airborne transmission using a macroscopic aerosol balance model. Our research builds upon theirs, delving deeper into the effects of droplet size and assessing the efficiency of various control strategies for both short- and long-range airborne transmission.The impact of droplet size on airborne transmission was evaluated, and it was found that droplets with different diameters have different contributions to airborne transmission. Droplets with an initial diameter (d0) less than 50 μm are considered for short-range airborne transmission, while those less than 10 μm are considered for long-range airborne transmission. By adopting a tri-mode droplet size distribution and a mode-dependent viral load, it was found that most exhaled viruses contributing to airborne transmission are from droplets with an initial diameter less than 10 μm. If a critical final diameter of 5 μm (with an evaporation factor of 0.5) is taken for long-range airborne transmission, then the viral load fraction, which represents the fraction of exhaled virus suspended in the expired jet that can spread to the room zone, is close to 0.9. For long-range airborne transmission, all viruses are contained in droplets ≤ 5 μm with a peak virus concentration observed at ∼1–2 μm. For short-range airborne transmission, ∼90% of the viruses are contained in droplets ≤ 10 μm with a peak virus concentration observed at ∼2–4 μm when considering the entrainment of room air viruses to the expired jet. These results intuitively reflect the different roles of droplets in short- and long-range airborne transmission, providing references for size-dependent airborne transmission control for future study. Additionally, it was found that due to the impact of droplet size, size-dependent control strategies (i.e., filtration and masks) can affect the rate at which virus concentration changes with non-size-dependent control strategies such as ventilation and distancing. This emphasizes the importance of adopting size-dependent efficiency instead of constant values for filtration and masks in evaluating the effectiveness of non-size-dependent control strategies.
The effectiveness and impacts of engineering and administrative control strategies were estimated for short- and long-range airborne transmission, respectively. Our results indicate that the engineering control strategies of ventilation and filtration both exhibit diminishing returns in their effectiveness at reducing virus concentration. Furthermore, these strategies were found to be more efficacious for long-range airborne transmission than for short-range airborne transmission. Moreover, due to the size-dependent efficiency of filtration, ventilation assumes a more significant role than filtration in reducing virus concentration, particularly in the context of long-range airborne transmission. The minimum relative concentrations achieved by ventilation and filtration are approximately 0.17 and 0.39, respectively, for long-range airborne transmission, and only around 0.92 and 0.94 for short-range airborne transmission. For short-range airborne transmission, distancing was found to be more effective than ventilation in reducing virus concentration. A relative virus concentration of ∼0.55 can be achieved by maintaining a 2 m distance. Our findings also indicate that ventilation has a minimal effect on the variation of virus concentration with respect to distancing. Nonetheless, the extent of this influence, as well as the efficacy of ventilation in controlling short-range airborne transmission, is largely contingent upon the specific model utilized for such transmission. Using masks was found to be the most effective control strategy for short- and long-range airborne transmission control and could attenuate the impacts of other control strategies. ∼0.03 and ∼0.04 relative virus concentrations can be achieved using surgical masks. But due to the leakage of masks, indoor transmission control cannot solely rely on their use. A combination of engineering and administrative control strategies should be considered for effective indoor airborne transmission control.
Author contributions
Xiaowei Lyu: writing – review & editing, writing – original draft, visualization, methodology, investigation, formal analysis, data curation, and conceptualization. Zhiwen Luo: writing – review & editing, supervision, resources, project administration, methodology, investigation, and conceptualization. Li Shao: writing – review & editing, supervision, and investigation.Conflicts of interest
There are no conflicts to declare.Acknowledgements
XL acknowledged the financial support from the China Scholarship Council (CSC) for pursuing her PhD at the University of Reading, UK.References
- Y. Li, P. Cheng and W. Jia, Poor ventilation worsens short-range airborne transmission of respiratory infection, Indoor Air, 2022, 32(1), e12946 CAS.
- Y. Li, Basic routes of transmission of respiratory pathogens—a new proposal for transmission categorization based on respiratory spray, inhalation, and touch, Indoor Air, 2021, 31, 3–6 CrossRef PubMed.
- W. Chen, N. Zhang, J. Wei, H. L. Yen and Y. Li, Short-range airborne route dominates exposure of respiratory infection during close contact, Build. Environ., 2020, 176, 106859 CrossRef.
- G. Buonanno, L. Morawska and L. Stabile, Quantitative assessment of the risk of airborne transmission of SARS-CoV-2 infection: prospective and retrospective applications, Environ. Int., 2020, 145, 106112 CrossRef CAS PubMed.
- S. L. Miller, W. W. Nazaroff, J. L. Jimenez, A. Boerstra, G. Buonanno and S. J. Dancer, et al., Transmission of SARS-CoV-2 by inhalation of respiratory aerosol in the Skagit Valley Chorale superspreading event, Indoor Air, 2021, 31(2), 314–323 CrossRef CAS PubMed.
- C. Sun and Z. Zhai, The efficacy of social distance and ventilation effectiveness in preventing COVID-19 transmission, Sustain. Cities Soc., 2020, 62, 102390 CrossRef PubMed.
- J. P. Coyle, R. C. Derk, W. G. Lindsley, T. Boots, F. M. Blachere and J. S. Reynolds, et al., Reduction of exposure to simulated respiratory aerosols using ventilation, physical distancing, and universal masking, Indoor Air, 2022, 32(2), e12987 CrossRef CAS PubMed.
- L. Morawska, J. W. Tang, W. Bahnfleth, P. M. Bluyssen, A. Boerstra and G. Buonanno, et al., How can airborne transmission of COVID-19 indoors be minimised?, Environ. Int., 2020, 142, 105832 CrossRef CAS PubMed.
- H. C. Burridge, R. K. Bhagat, M. E. J. Stettler, P. Kumar, I. De Mel and P. Demis, et al., The ventilation of buildings and other mitigating measures for COVID-19: a focus on wintertime, Proc. R. Soc. A, 2021, 477(2247), 20200855 CrossRef PubMed.
- J. Kurnitski, M. Kiil, A. Boerstra, O. Seppänen, P. Wargocki and B. Olesen, et al., Preprint - a new ventilation criterion based on respiratory infection risk of COVID-19, Indoor Air, 2021 DOI:10.13140/RG.2.2.35510.83524.
- J. Shen, M. Kong, B. Dong, M. J. Birnkrant and J. Zhang, A systematic approach to estimating the effectiveness of multi-scale IAQ strategies for reducing the risk of airborne infection of SARS-CoV-2, Build. Environ., 2021, 200, 107926 CrossRef PubMed.
- F. Liu, Z. Luo, Y. Li, X. Zheng, C. Zhang and H. Qian, Revisiting physical distancing threshold in indoor environment using infection-risk-based modeling, Environ. Int., 2021, 153, 106542 CrossRef CAS PubMed.
- N. R. Jones, Z. U. Qureshi, R. J. Temple, J. P. J. Larwood, T. Greenhalgh and L. Bourouiba, Two metres or one: what is the evidence for physical distancing in covid-19?, Br. Med. J., 2020, 370, m3223 CrossRef PubMed.
- S. Balachandar, S. Zaleski, A. Soldati, G. Ahmadi and L. Bourouiba, Host-to-host airborne transmission as a multiphase flow problem for science-based social distance guidelines, Int. J. Multiphase Flow, 2020, 132, 103439 CrossRef CAS.
- N. Zhang, W. Chen, P. T. Chan, H. L. Yen, J. W. T. Tang and Y. Li, Close contact behavior in indoor environment and transmission of respiratory infection, Indoor Air, 2020, 30, 645–661 CrossRef CAS PubMed.
- F. Liu and H. Qian, Uncertainty analysis of facemasks in mitigating SARS-CoV-2 transmission, Environ. Pollut., 2022, 303, 119167 CrossRef CAS PubMed.
- M. Liang, L. Gao, C. Cheng, Q. Zhou, J. P. Uy and K. Heiner, et al., Efficacy of face mask in preventing respiratory virus transmission: a systematic review and meta-analysis, Travel Med. Infect. Dis., 2020, 36, 101751 CrossRef PubMed.
- Y. Li, Hypothesis: SARS-CoV-2 transmission is predominated by the short-range airborne route and exacerbated by poor ventilation, Indoor Air, 2021, 31, 921–925 CrossRef CAS PubMed.
- W. Chen, H. Qian, N. Zhang, F. Liu, L. Liu and Y. Li, Extended short-range airborne transmission of respiratory infections, J. Hazard. Mater., 2022, 422, 126837 CrossRef CAS PubMed.
- Y. Li, The respiratory infection inhalation route continuum, Indoor Air, 2021, 31, 279–281 CrossRef CAS PubMed.
- J. Wagner, T. L. Sparks, S. Miller, W. Chen, J. M. Macher and J. M. Waldman, Modeling the impacts of physical distancing and other exposure determinants on aerosol transmission, J. Occup. Environ. Hyg., 2021, 1–15 Search PubMed.
- L. Morawska, G. R. Johnson, Z. D. Ristovski, M. Hargreaves, K. Mengersen and S. Corbett, et al., Size distribution and sites of origin of droplets expelled from the human respiratory tract during expiratory activities, J. Aerosol Sci., 2009, 40(3), 256–269 CrossRef CAS.
- G. R. Johnson, L. Morawska, Z. D. Ristovski, M. Hargreaves, K. Mengersen and C. Y. H. Chao, et al., Modality of human expired aerosol size distributions, J. Aerosol Sci., 2011, 42(12), 839–851 CrossRef CAS.
- K. K. Coleman, D. J. W. Tay, K. S. Tan, S. W. X. Ong, T. S. Than and M. H. Koh, et al., Viral Load of Severe Acute Respiratory Syndrome Coronavirus 2 (SARS-CoV-2) in Respiratory Aerosols Emitted by Patients with Coronavirus Disease 2019 (COVID-19) while Breathing, Talking, and Singing, Clin. Infect. Dis., 2022, 74(10), 1722–1728 CrossRef CAS PubMed.
- N. H. L. Leung, D. K. W. Chu, E. Y. C. Shiu, K. H. Chan, J. J. McDevitt and B. J. P. Hau, et al., Respiratory virus shedding in exhaled breath and efficacy of face masks, Nat. Med., 2020, 26(5), 676–680 CrossRef CAS PubMed.
- B. Bake, P. Larsson, G. Ljungkvist, E. Ljungström and A. C. Olin, Exhaled particles and small airways, Respir. Res., 2019, 20, 8 CrossRef CAS PubMed.
- L. F. Pease, T. I. Salsbury, K. Anderson, R. M. Underhill, J. E. Flaherty and A. Vlachokostas, et al., Size dependent infectivity of SARS-CoV-2 via respiratory droplets spread through central ventilation systems, Int. Commun. Heat Mass Transfer, 2022, 132, 105748 CrossRef CAS.
- J. Gralton, E. Tovey, M. L. McLaws and W. D. Rawlinson, The role of particle size in aerosolised pathogen transmission: a review, J. Infect., 2011, 62, 1–13 CrossRef PubMed.
- M. I. Guzman, An overview of the effect of bioaerosol size in coronavirus disease 2019 transmission, Int. J. Health Plann. Manag., 2021, 36(2), 257–266 CrossRef PubMed.
- G. Buonanno, L. Stabile and L. Morawska, Estimation of airborne viral emission: quanta emission rate of SARS-CoV-2 for infection risk assessment, Environ. Int., 2020, 141, 105794 CrossRef CAS PubMed.
- A. Cammarata and G. Cammarata, Dynamic assessment of the risk of airborne viral infection, Indoor Air, 2021, 31(6), 1759–1775 CrossRef CAS PubMed.
- M. E. J. Stettler, R. T. Nishida, P. M. de Oliveira, L. C. C. Mesquita, T. J. Johnson and E. R. Galea, et al., Source terms for benchmarking models of SARS-CoV-2 transmission via aerosols and droplets, R. Soc. Open Sci., 2022, 9(5), 212022 CrossRef CAS PubMed.
- J. Wang, H. Tang, J. Wang and Z. Zhong, An agent-based study on the airborne transmission risk of infectious disease in a fever clinic during COVID-19 pandemic, Build. Environ., 2022, 218, 109118 CrossRef PubMed.
- W. C. Adams, Measurement of Breathing Rate and Volume in Routinely Performed Daily Activities, final report, Adams, WC, 1993, available from: https://heronet.epa.gov/heronet/index.cfm/reference/download/reference_id/77086 Search PubMed.
- B. Jones, P. Sharpe, C. Iddon, E. A. Hathway, C. J. Noakes and S. Fitzgerald, Modelling uncertainty in the relative risk of exposure to the SARS-CoV-2 virus by airborne aerosol transmission in well mixed indoor air, Build. Environ., 2021, 191, 107617 CrossRef PubMed.
- K. K. Coleman, D. J. W. Tay, K. S. Tan, S. W. X. Ong, T. S. Than and M. H. Koh, et al., Viral Load of Severe Acute Respiratory Syndrome Coronavirus 2 (SARS-CoV-2) in Respiratory Aerosols Emitted by Patients with Coronavirus Disease 2019 (COVID-19) while Breathing, Talking, and Singing, Clin. Infect. Dis., 2021, 1722–1728 Search PubMed.
- S. Anand and Y. S. Mayya, Size distribution of virus laden droplets from expiratory ejecta of infected subjects, Sci. Rep., 2020, 10(1), 21174 CrossRef CAS PubMed.
- L. F. Pease, T. I. Salsbury, K. Anderson, R. M. Underhill, J. E. Flaherty and A. Vlachokostas, et al., Size dependent infectivity of SARS-CoV-2 via respiratory droplets spread through central ventilation systems, Int. Commun. Heat Mass Transfer, 2021, 105748 Search PubMed.
- M. Z. Bazant and J. W. M. Bush, A guideline to limit indoor airborne transmission of COVID-19, Proc. Natl. Acad. Sci. U. S. A., 2021, 118(17), e2018995118 CrossRef CAS PubMed.
- R. Hecker and K. C. Hofacre, Development of Performance Data for Common Building Air Cleaning Devices, US Environmental Protection Agency, Washington, DC, USA, 2008 Search PubMed.
- Z. Peng, A. L. P. Rojas, E. Kropff, W. Bahnfleth, G. Buonanno and S. J. Dancer, et al., Practical Indicators for Risk of Airborne Transmission in Shared Indoor Environments and Their Application to COVID-19 Outbreaks, Environ. Sci. Technol., 2022, 56(2), 1125–1137 CrossRef CAS PubMed.
- A. Mikszewski, L. Stabile, G. Buonanno and L. Morawska, The vaccination threshold for SARS-CoV-2 depends on the indoor setting and room ventilation, BMC Infect. Dis., 2021, 21(1), 1193 CrossRef CAS PubMed.
- F. N. Willis, Initial speaking distance as a function of the speakers’ relationship, Psychon. Sci., 1966, 5(6), 221–222 CrossRef.
- Y. Wang, J. Wei, C. X. Gao, T. Jin and L. Liu, Tracing the origin of large respiratory droplets by their deposition characteristics inside the respiratory tract during speech, Build. Simulat., 2023, 16(5), 781–794 CrossRef PubMed.
- D. K. Milton, M. P. Fabian, B. J. Cowling, M. L. Grantham and J. J. McDevitt, Influenza Virus Aerosols in Human Exhaled Breath: Particle Size, Culturability, and Effect of Surgical Masks, PLoS Pathog., 2013, 9(3), e1003205 CrossRef CAS PubMed.
- Y. H. Cheng, C. H. Wang, S. H. You, N. H. Hsieh, W. Y. Chen and C. P. Chio, et al., Assessing coughing-induced influenza droplet transmission and implications for infection risk control, Epidemiol. Infect., 2016, 144(2), 333–345 CrossRef PubMed.
- K. K. Coleman, D. J. W. Tay, K. S. Tan, S. W. X. Ong, T. S. Than and M. H. Koh, et al., Viral Load of Severe Acute Respiratory Syndrome Coronavirus 2 (SARS-CoV-2) in Respiratory Aerosols Emitted by Patients with Coronavirus Disease 2019 (COVID-19) while Breathing, Talking, and Singing, Clin. Infect. Dis., 2022, 74(10), 1722–1728 CrossRef CAS PubMed.
- N. Good, K. M. Fedak, D. Goble, A. Keisling, C. L’Orange and E. Morton, et al., Respiratory Aerosol Emissions from Vocalization: Age and Sex Differences Are Explained by Volume and Exhaled CO2, Environ. Sci. Technol. Lett., 2021, 8(12), 1071–1076 CrossRef CAS.
- D. Mürbe, M. Kriegel, J. Lange, H. Rotheudt and M. Fleischer, Aerosol emission in professional singing of classical music, Sci. Rep., 2021, 11(1), 1–11 CrossRef PubMed.
- J. Lelieveld, F. Helleis, S. Borrmann, Y. Cheng, F. Drewnick and G. Haug, et al., Model calculations of aerosol transmission and infection risk of covid-19 in indoor environments, Int. J. Environ. Res. Public Health, 2020, 17(21), 1–18 Search PubMed.
- J. Schijven, L. C. Vermeulen, A. Swart, A. Meijer, E. Duizer and A. Maria, Quantitative microbial risk assessment for airborne transmission of SARS-CoV-2 via breathing, speaking, singing, coughing, and sneezing, Environ Health Perspect, 2021, 129(4), 47002 CrossRef CAS PubMed.
- G. N. Sze To and C. Y. H. Chao, Review and comparison between the Wells-Riley and dose-response approaches to risk assessment of infectious respiratory diseases, Indoor Air, 2010, 20, 2–16 CrossRef CAS PubMed.
- W. C. Hinds and Y. Zhu, Aerosol Technology: Properties, Behavior, and Measurement of Airborne Particles, John Wiley & Sons, 2022 Search PubMed.
- M. Kennedy, S. J. Lee and M. Epstein, Modeling aerosol transmission of SARS-CoV-2 in multi-room facility, J. Loss Prev. Process Ind., 2021, 69, 104336 CrossRef CAS PubMed.
- D. Hou, A. Katal, L. L. Wang, A. Katal and L. L. Wang, Bayesian Calibration of Using CO2 Sensors to Assess Ventilation Conditions and Associated COVID-19 Airborne Aerosol Transmission Risk in Schools, medRxiv, 2021, preprint, DOI:10.1101/2021.01.29.21250791, available from: https://medrxiv.org/content/early/2021/02/03/2021.01.29.21250791.abstract.
- S. Yan, L. L. Wang, M. J. Birnkrant, J. Zhai and S. L. Miller, Evaluating SARS-CoV-2 airborne quanta transmission and exposure risk in a mechanically ventilated multizone office building, Build. Environ., 2022, 219, 109184 CrossRef PubMed.
- W. Jia, J. Wei, P. Cheng, Q. Wang and Y. Li, Exposure and respiratory infection risk via the short-range airborne route, Build. Environ., 2022, 219, 109166 CrossRef PubMed.
- S. Miller-Leiden, C. Lohascio, W. W. Nazaroff and J. M. Macher, Effectiveness of In-Room Air Filtration and Dilution Ventilation for Tuberculosis Infection Control, J. Air Waste Manage. Assoc., 1996, 46(9), 869–882 CrossRef CAS PubMed.
- S. Verma, M. Dhanak and J. Frankenfield, Visualizing the effectiveness of face masks in obstructing respiratory jets, Phys. Fluids, 2020, 32(6), 061708 CrossRef CAS PubMed.
- D. A. Rothamer, S. Sanders, D. Reindl and T. H. Bertram, Strategies to minimize SARS-CoV-2 transmission in classroom settings: combined impacts of ventilation and mask effective filtration efficiency, Sci. Technol. Built. Environ., 2021, 27(9), 1181–1203 CrossRef.
- T. Lipinski, D. Ahmad, N. Serey and H. Jouhara, Review of ventilation strategies to reduce the risk of disease transmission in high occupancy buildings, Int. J. Thermofluids, 2020, 7–8 Search PubMed.
- J. Kurnitski, M. Kiil, P. Wargocki, A. Boerstra, O. Seppänen and B. Olesen, et al., Respiratory infection risk-based ventilation design method, Build. Environ., 2021, 206, 108387 CrossRef PubMed.
- L. Stabile, A. Pacitto, A. Mikszewski, L. Morawska and G. Buonanno, Ventilation procedures to minimize the airborne transmission of viruses in classrooms, Build. Environ., 2021, 202, 1–21 CrossRef PubMed.
- R. Mittal, C. Meneveau and W. Wu, A mathematical framework for estimating risk of airborne transmission of COVID-19 with application to face mask use and social distancing, Phys. Fluids, 2020, 32(10), 101903 CrossRef CAS PubMed.
- H. Qian, Y. Li, P. V. Nielsen and X. Huang, Spatial distribution of infection risk of SARS transmission in a hospital ward, Build. Environ., 2009, 44(8), 1651–1658 CrossRef.
- Y. Guo, H. Qian, Z. Sun, J. Cao, F. Liu and X. Luo, et al., Assessing and controlling infection risk with Wells-Riley model and spatial flow impact factor (SFIF), Sustain. Cities Soc., 2021, 67, 102719 CrossRef PubMed.
- G. N. Sze To, M. P. Wan, C. Y. H. Chao, F. Wei, S. C. T. Yu and J. K. C. Kwan, A methodology for estimating airborne virus exposures in indoor environments using the spatial distribution of expiratory aerosols and virus viability characteristics, Indoor Air, 2008, 18(5), 425–438 CrossRef CAS PubMed.
- P. M. De Oliveira, L. C. C. Mesquita, S. Gkantonas, A. Giusti and E. Mastorakos, Evolution of spray and aerosol from respiratory releases: theoretical estimates for insight on viral transmission, Proc. R. Soc. A, 2021, 477(2245), 20200584 CrossRef CAS PubMed.
- Y. Li, G. M. Leung, J. W. Tang, X. Yang, C. Y. H. Chao and J. Z. Lin, et al., Role of ventilation in airborne transmission of infectious agents in the built environment - a multidisciplinary systematic review, Indoor Air, 2007, 17, 2–18 CrossRef CAS PubMed.
- X. Xie, Y. Li, A. T. Y. Chwang, P. L. Ho and W. H. Seto, How far droplets can move in indoor environments – revisiting the Wells evaporation – falling curve, Indoor Air, 2007, 211–225 CrossRef CAS PubMed.
Footnote |
| † Electronic supplementary information (ESI) available. See DOI: https://doi.org/10.1039/d3ea00115f |
| This journal is © The Royal Society of Chemistry 2024 |

