Linker engineering to regulate the fluorescence of hydrazone-linked covalent organic frameworks for the real-time visual detection of norfloxacin and multiple information encryption†
Haifei
Wan
,
Mengyao
Li
,
Li
Wang
 * and
Yonghai
Song
 *
*
College of Chemistry and Chemical Engineering, Jiangxi Normal University, 99 Ziyang Avenue, Nanchang 330022, China. E-mail: lwang@jxnu.edu.cn; yhsonggroup@hotmail.com; yhsong@jxnu.edu.cn
First published on 2nd October 2023
Abstract
The misuse and improper handling of norfloxacin (NOR) can cause serious harm; therefore, the sensitive and visual detection of NOR is of great significance. However, it is still a huge challenge to establish the multiplex fluorescence detection of NOR. Herein, four hydrazone-linked covalent organic frameworks (COFs) with different luminescence were prepared using 2,5-bis(2-methoxyethoxy)terephthalohydrazide as the nucleus and aldehyde monomers containing methoxy and different numbers of hydroxyl groups as linkers, respectively, and the precise modulation of the emission of hydrazone-linked COFs was achieved. The intrinsic blue emission of NOR was combined with hydrazone-linked COFs to construct ratiometric fluorescence sensors to monitor NOR. Among them, a two-signal change ratiometric fluorescence sensor based on COFBMTH-HB showed the highest sensitivity, the lowest detection limit (51 ng mL−1) and the widest linear range (153 ng mL−1 to 48 μg mL−1), originating from the lowest background fluorescence and the largest output signal. Based on the obvious color changes in the detection process, a novel test paper was also proposed with simultaneous multi-chroma and was combined with a smartphone App as a real-time detection tool to successfully monitor NOR in real fish samples. This portable paper-based sensor provides support for rapid and simple NOR visual detection. In addition, a two-dimensional code with multiple information encryption was developed by taking advantage of the obvious color changes as well as the excitation dependence of COFBMTH-HB during the detection of NOR, which further broadens the application of two-dimensional codes in the field of anti-counterfeiting.
1. Introduction
The prevalence of the coronavirus (COVID-19) mutant strain Omicron XBB series has led to widespread concern about drugs, such as norfloxacin (NOR).1,2 NOR is a broad-spectrum fluoroquinolone antibiotic used widely to treat urinary, respiratory, and gastrointestinal infections in humans and animals.3–5 However, NOR can enter the body through the food chain, causing adverse effects, such as drowsiness, anorexia, dizziness and nausea, and the long-term ingestion of NOR might cause central nervous system disorders and induce antibiotic resistance.6–8 In addition, the presence of NOR in wastewater and surface water can lead to the propagation of drug-resistant bacteria.9,10 Thus, it is of great significance to develop a rapid and accurate method to monitor NOR.Fluorescence sensing has been widely used to detect NOR because of its simple operation, high sensitivity, rapid response and easy visualization analysis.11–13 For example, Li et al. established a novel fluorescence “on–off–on” NOR detection strategy based on S QDs-Co2+.14 Cui et al. designed a zinc(II)-based fluorescence sensor to achieve the ultra-sensitive detection of NOR in water.15 However, the above examples all relied on the enhancement of a single fluorescence signal. Therefore, it was difficult to distinguish different concentrations of NOR by the naked eye, which would affect its visual analysis. Fortunately, compared with single-emission fluorescent sensors, ratiometric fluorescent sensors are favoured because of their built-in self-calibration, strong immunity to interference, and ability to achieve color output.16–18 Given these advantages, several ratiometric fluorescence strategies have been designed for the visual analysis of antibiotics in food and ecology. Recently, Chen et al. designed a UiO-66-NH2@TpTGCl composite by combining the metal–organic framework UiO-66-NH2 with the ionic covalent organic framework (iCOF) TpTGCl for the ratiometric fluorescence detection of NOR (I549/I450), achieving a transition from dark blue to light blue.19 Our group screened COFBTT-TAGH by adjusting the number, charge and length of amine monomers with different amino groups for visual field determination of enrofloxacin (I451/I540) to achieve the transition from green to blue.20 However, these ratiometric fluorescence sensors have a limited range of color changes due to the insufficient difference between the two emission peaks, which greatly limits the field visual detection of antibiotics. In addition, a ratiometric fluorescence sensor increases the range of dynamic response by varying the ratio of fluorescence intensities. The larger the change in the intensity ratio, the larger the output signal of the dual-emission probe.21,22 Therefore, it is necessary to explore fluorescent materials with large emission wavelength differences that can be regulated to detect NOR with multiple fluorescence changes.
Covalent organic frameworks (COFs) are a class of porous crystalline polymers with periodic ordered units and extensive chemical adjustability.23–27 COFs have shown great potential applications in various fields, such as photoelectrocatalysis,28,29 anti-counterfeiting,30 sensing31 and energy storage.32 In particular, they have become a promising fluorescence sensing material,33 because specific recognition sites can be easily integrated and extended to the entire skeleton of COFs.34 Ordered pore channels are conducive to the enrichment of analytes and increase the probability of contact with analytes to amplify signals, thus improving the sensitivity of fluorescence detection.35–37 Therefore, COFs have great potential for fluorescence sensing.38–40 In addition, COFs not only have adjustable structure, pore size and functional groups,41,42 but also have adjustable fluorescence properties. For example, Li et al. achieved the adjustable emission colors of COFs from blue to yellow or even white by changing the size of conjugated connectives and side chains.43 Jiang et al. introduced the mono-chlorine, methyl, methoxy and hydroxyl sites on the pore wall to trigger resonance, hyperconjugation and tautomerism effects, and realized RGB emission through small perturbations on the wall.44 Therefore, COFs have broad prospects in regulating emission wavelength and constructing ratiometric fluorescence sensors and visual detection.45,46 At the same time, the luminescence controllable multicolor COFs also have important application value in the field of information storage encryption. Traditional information encryption materials are limited by single-stimulus encryption, which is easy to crack. Multi-stimulus synergistic encryption technology is conducive to improving the security of information encryption but there are still great challenges.47,48 Multiple stimulus-response information can be provided by designing a system with multicolor fluorescence changes in the sensing process and with excitation dependence, which provides a new idea for constructing multiple information encryption.
Herein, four hydrazone-linked COFs with different luminescence colors were synthesized by using 2,5-bis(2-methoxyethoxy)terephthalohydrazide as the nucleus and aldehyde monomers with hydrogen, methoxy and different numbers of hydroxyl groups as linkers through amine-aldehyde condensation reactions (Scheme 1). Emissions ranging from blue to red were achieved due to different π-electron effects triggered by the methoxy and hydroxyl groups. Combined with the intrinsic blue fluorescence emission of NOR, the ratiometric fluorescence detection of NOR can be achieved using these hydrazone-linked COFs. Among them, COFBMTH-HB has the widest dynamic response range to NOR, and the lowest detection limit. In addition, COFBMTH-HB can produce abundant and obvious fluorescence color differences visible to the naked eye when it is used to detect NOR. More excitingly, this smartphone-based portable sensor successfully achieved the monitoring of NOR in real fish samples with satisfactory results, providing a promising approach for achieving accurate in situ determination of NOR residues. In addition, combined with the excitation dependence of the COFBMTH-HB + NOR system, two-dimensional codes with multiple information encryption have been proposed, which provide enlightening significance for the design of materials for information encryption.
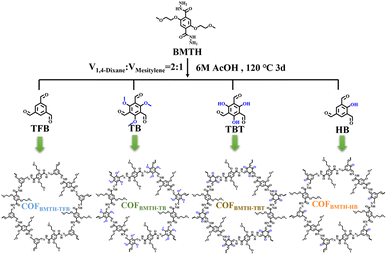 | ||
| Scheme 1 Synthesis procedures and the structures of COFBMTH-TFB, COFBMTH-TB, COFBMTH-TBT and COFBMTH-HB. | ||
2. Experimental section
2.1. Synthesis of 2,5-bis(2-methoxyethoxy)terephthalohydrazide-based COFs
To synthesize COFBMTH-TFB, 51.4 mg BMTH (0.15 mmol) and 16.2 mg TFB (0.1 mmol) were dissolved in 1.5 mL of mixed solution (V1,4-dioxane![[thin space (1/6-em)]](https://www.rsc.org/images/entities/char_2009.gif) :
:![[thin space (1/6-em)]](https://www.rsc.org/images/entities/char_2009.gif) Vmesitylene = 2
Vmesitylene = 2![[thin space (1/6-em)]](https://www.rsc.org/images/entities/char_2009.gif) :
:![[thin space (1/6-em)]](https://www.rsc.org/images/entities/char_2009.gif) 1) and sonicated for 15 min. After being dissolved completely, the solution was transferred into a 25 mL Pyrex tube and sonication was continued for 5 min. Then, 300 μL of 6 M AcOH was added. Next, the Pyrex tubes were frozen at 77 K (liquid N2 bath) and degassed through three freeze–pump–thaw cycles. After that, the tube was sealed and then heated at 120 °C for 3 days. The obtained product was centrifuged at 10
1) and sonicated for 15 min. After being dissolved completely, the solution was transferred into a 25 mL Pyrex tube and sonication was continued for 5 min. Then, 300 μL of 6 M AcOH was added. Next, the Pyrex tubes were frozen at 77 K (liquid N2 bath) and degassed through three freeze–pump–thaw cycles. After that, the tube was sealed and then heated at 120 °C for 3 days. The obtained product was centrifuged at 10![[thin space (1/6-em)]](https://www.rsc.org/images/entities/char_2009.gif) 000 rpm for 5 min, the precipitate was collected and washed with DMF and THF at least three times until the supernatant was clear and transparent. Finally, a white solid was obtained, which was dried in an oven at 60 °C to obtain COFBMTH-TFB in 67.8% yield. To obtain COFBMTH-TFB with good dispersion, COFBMTH-TFB was ground. The synthesis method of COFBMTH-TB, COFBMTH-TBT and COFBMTH-HB is consistent with that of COFBMTH-TFB. Only the aldehyde monomers need to be replaced with 25.2 mg TB (0.1 mmol), 21.0 mg TBT (0.1 mmol) and 17.8 mg HB (0.1 mmol), respectively. Finally, yellow, orange and bright yellow solids were obtained with yields of 52.3%, 82.2% and 81.7%, respectively.
000 rpm for 5 min, the precipitate was collected and washed with DMF and THF at least three times until the supernatant was clear and transparent. Finally, a white solid was obtained, which was dried in an oven at 60 °C to obtain COFBMTH-TFB in 67.8% yield. To obtain COFBMTH-TFB with good dispersion, COFBMTH-TFB was ground. The synthesis method of COFBMTH-TB, COFBMTH-TBT and COFBMTH-HB is consistent with that of COFBMTH-TFB. Only the aldehyde monomers need to be replaced with 25.2 mg TB (0.1 mmol), 21.0 mg TBT (0.1 mmol) and 17.8 mg HB (0.1 mmol), respectively. Finally, yellow, orange and bright yellow solids were obtained with yields of 52.3%, 82.2% and 81.7%, respectively.
3. Results and discussion
3.1. Structural characterization of 2,5-bis(2-methoxyethoxy) terephthalohydrazide-based COFs
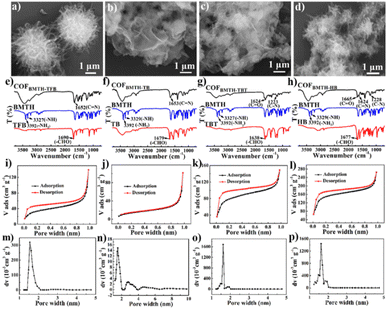
The morphology of 2,5-bis(2-methoxyethoxy) terephthalohydrazide-based COFs was characterized by SEM. COFBMTH-TFB has a microsphere structure with a diameter of about 2 μm, which is composited of nanofibers (Fig. 1a). COFBMTH-TB (Fig. 1b) and COFBMTH-TBT (Fig. 1c) showed some nanosheets, and COFBMTH-HB is made up of mainly nanofibers (Fig. 1d). The 2,5-bis(2-methoxyethoxy)terephthalohydrazide-based COFs were further characterized by FTIR, N2 adsorption/desorption isotherms and PXRD. Fig. 1e–h show characteristic peaks of –NH and –NH2 for monomer BMTH (3327 cm−1 and 3392 cm−1) and C![[double bond, length as m-dash]](https://www.rsc.org/images/entities/char_e001.gif) O bonds for monomers TFPB, TB, TBT and HB at 1690 cm−1, 1679 cm−1, 1638 cm−1 and 1677 cm−1, respectively. For COFBMTH-TFB and COFBMTH-TB, new imine bond peaks appeared at 1652 cm−1 and 1653 cm−1, respectively. In the FTIR spectrum of COFBMTH-TBT, C
O bonds for monomers TFPB, TB, TBT and HB at 1690 cm−1, 1679 cm−1, 1638 cm−1 and 1677 cm−1, respectively. For COFBMTH-TFB and COFBMTH-TB, new imine bond peaks appeared at 1652 cm−1 and 1653 cm−1, respectively. In the FTIR spectrum of COFBMTH-TBT, C![[double bond, length as m-dash]](https://www.rsc.org/images/entities/char_e001.gif) O (1624 cm−1) and C–N (1223 cm−1) stretching vibration peaks from the tautomerism of the enolimine to keto-enamine were observed. In the FTIR spectrum of COFBMTH-HB, the tautomerism of the enolimine to keto-enamine produced a C
O (1624 cm−1) and C–N (1223 cm−1) stretching vibration peaks from the tautomerism of the enolimine to keto-enamine were observed. In the FTIR spectrum of COFBMTH-HB, the tautomerism of the enolimine to keto-enamine produced a C![[double bond, length as m-dash]](https://www.rsc.org/images/entities/char_e001.gif) O peak (1665 cm−1), the imine peak appeared at 1624 cm−1 and the C–N stretching vibration peak appeared at 1228 cm−1. All these data prove the successful preparation of the 2,5-bis(2-methoxyethoxy) terephthalohydrazide-based COFs. The specific surface area and permanent porosity of 2,5-bis(2-methoxyethoxy) terephthalohydrazide-based COFs were tested by N2 adsorption/desorption isotherms at 77 K. As shown in Fig. 1i–l, COFBMTH-TFB, COFBMTH-TBT, and COFBMTH-HB exhibited type II isotherms, while COFBMTH-TB exhibited a type III isotherm.49,50 The corresponding Brunauer–Emmett–Teller (BET) surface areas are 114.783 m2 g−1, 39.806 m2 g−1, 254.784 m2 g−1, and 305.212 m2 g−1, respectively. The pore sizes obtained by BJH calculation are approximately 1.54 nm, 1.54 nm, 1.61 nm, and 1.61 nm, respectively (Table S1†).
O peak (1665 cm−1), the imine peak appeared at 1624 cm−1 and the C–N stretching vibration peak appeared at 1228 cm−1. All these data prove the successful preparation of the 2,5-bis(2-methoxyethoxy) terephthalohydrazide-based COFs. The specific surface area and permanent porosity of 2,5-bis(2-methoxyethoxy) terephthalohydrazide-based COFs were tested by N2 adsorption/desorption isotherms at 77 K. As shown in Fig. 1i–l, COFBMTH-TFB, COFBMTH-TBT, and COFBMTH-HB exhibited type II isotherms, while COFBMTH-TB exhibited a type III isotherm.49,50 The corresponding Brunauer–Emmett–Teller (BET) surface areas are 114.783 m2 g−1, 39.806 m2 g−1, 254.784 m2 g−1, and 305.212 m2 g−1, respectively. The pore sizes obtained by BJH calculation are approximately 1.54 nm, 1.54 nm, 1.61 nm, and 1.61 nm, respectively (Table S1†).
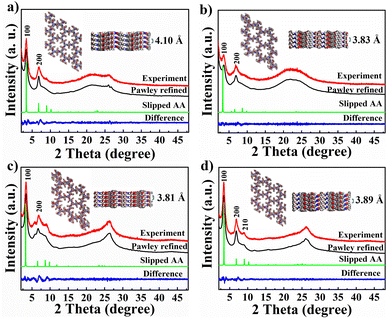
Next, the obtained PXRD experimental data were analyzed by combining the Pawley refinement and theoretical simulation. In Fig. 2, the PXRD patterns of 2,5-bis(2-methoxyethoxy)terephthalohydrazide-based COFs showed strong peaks at 2θ = 3.43° and 6.80°, which correspond to the (100) and (200) crystal planes, respectively. In addition, COFBMTH-TBT showed weak peaks at 2θ = 5.81° and 8.81°, corresponding to the (110) and (210) crystal planes, respectively. COFBMTH-HB showed a weak peak at 9.01°, corresponding to the (210) crystal plane. The experimental PXRD patterns of 2,5-bis(2-methoxyethoxy) terephthalohydrazide-based COFs (red line) agree well with the simulated PXRD patterns (black line), with a slight difference (blue line) and Rwp of 5.52%, 4.28%, 4.75%, and 4.40%, respectively. The AA stacking models generated by Materials Studio 7.0 matched well with the experimental results (green line), which demonstrates that 2,5-bis(2-methoxyethoxy)terephthalohydrazide-based COFs are stacked in AA with space group P3. The cell parameters are shown in Table S2.† The 2,5-bis(2-methoxyethoxy)terephthalohydrazide-based COFs showed good chemical stability in different solvents including THF, DMF, H2O, 1 M HCl and 1 M NaOH (Fig. S1†), and also showed superior thermal stability (Fig. S2†).
3.2. Optical properties of 2,5-bis(2-methoxyethoxy) terephthalohydrazide-based COFs
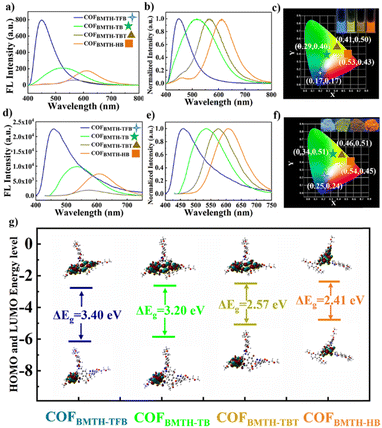
The fluorescence excitation and emission spectra of 2,5-bis(2-methoxyethoxy)terephthalohydrazide-based COFs were obtained. As shown in Fig. S3,† the excitation spectra of the 2,5-bis(2-methoxyethoxy)terephthalohydrazide-based COFs show a maximum peak at 370 nm, and the emission spectra were obtained at this excitation wavelength. As shown in Fig. S3b–d,† COFBMTH-TFB, COFBMTH-TB, COFBMTH-TBT and COFBMTH-HB showed emission peaks at 450 nm, 520 nm, 564 nm, and 613 nm, respectively. Therefore, further experiments were performed at the excitation wavelength of 370 nm.Next, the fluorescence emission spectra of 2,5-bis(2-methoxyethoxy)terephthalohydrazide-based COFs were obtained at the same concentrations. As shown in Fig. 3a, the fluorescence emission intensity of COFBMTH-TFB was the highest and the fluorescence emission intensity gradually decreased from COFBMTH-TB to COFBMTH-HB to COFBMTH-TBT. The normalized fluorescence spectra of 2,5-bis(2-methoxyethoxy) terephthalohydrazide-based COFs show that the fluorescence emission peaks of COFBMTH-TFB, COFBMTH-TB, COFBMTH-TBT and COFBMTH-HB were gradually red-shifted (Fig. 3b). They emitted blue light, yellow-green light, yellow light, and orange-red light, respectively (inset in Fig. 3c). Their corresponding CIE coordinates were (0.17, 0.17), (0.29, 0.40), (0.41, 0.50) and (0.53, 0.43), respectively (Fig. 3c). The fluorescence emission spectra of solid-state 2,5-bis(2-methoxyethoxy) terephthalohydrazide-based COFs were also measured. As shown in Fig. 3d–f, the fluorescence emission intensity and emission color of the solid-state 2,5-bis(2-methoxyethoxy) terephthalohydrazide-based COFs are consistent with those in a solution. This might be due to the formation of intramolecular hydrogen bonds between the BMTH side chain and –NH– in COFs, which enhances the rigidity of the backbone structure and limits the relaxation of BMTH molecules, resulting in good emission of COFs in the solid state.
Next, the relationship between the luminescent colors and structure of 2,5-bis(2-methoxyethoxy)terephthalohydrazide-based COFs was explored. In two-dimensional COFs, the type of connecting bonds between chromophores strongly influences their fluorescence.43 The non-radiative decay of the excited state can be induced by the bond rotation. Therefore, it is crucial to limit the bond rotation in two-dimensional COFs to induce solid-state luminescence. As shown in Fig. S4a,† COFBMTH-TFB emits strong blue fluorescence due to the addition of side chains to form intramolecular hydrogen bonds which limit the rotation of the benzene ring in the BMTH monomer, thus reducing the non-radiative decay. Due to the p–π conjugation of the lone pair of electrons on the oxygen atom in the methoxy group with the benzene ring, a red-shift of the emission peak occurs (Fig. S4b†). For COFBMTH-TBT and COFBMTH-HB, the resonance effect of the oxygen atoms and the hydrogen bonding between the hydroxyl unit and the hydrazone bond enhance the planarization of the connecting unit, resulting in further red-shifting of the fluorescence emission (Fig. S4c and d†). However, COFBMTH-TBT is less redshifted than COFBMTH-HB due to the lack of imines, which prevents the self-repair during the formation of COFs and limits the long-range order of the system.46
Solid-state UV-vis diffuse reflectance spectra show a gradual redshift for COFBMTH-TFB, COFBMTH-TB, COFBMTH-TBT and COFBMTH-HB (Fig. S5a†). The corresponding band gaps of COFBMTH-TFB, COFBMTH-TB, COFBMTH-TBT and COFBMTH-HB were calculated to be 2.31 eV, 2.07 eV, 1.91 eV and 1.53 eV, respectively (Fig. S5b†). The gradual decrease in the band gap is consistent with the emission color change. In addition, the molecular orbitals of 2,5-bis(2-methoxyethoxy)terephthalohydrazide-based COFs were calculated by using density functional theory (DFT). As shown in Fig. 3g, the energy level differences between the lowest unoccupied molecular orbital (LUMO) energy and the highest occupied molecular orbital (HOMO) energy for COFBMTH-TFB, COFBMTH-TB, COFBMTH-TBT and COFBMTH-HB were 3.40 eV, 3.20 eV, 2.57 eV and 2.41 eV, respectively. Although the theoretical values are larger than their experimental values due to the limitations of the DFT method, the results show that they have a consistent trend.51 The change in the HOMO–LUMO energy gap also indicates that the electronic structure of 2,5-bis(2-methoxyethoxy)terephthalohydrazide-based COFs can be adjusted by wall perturbation,52 thus the wavelength of luminescence can be regulated precisely. The quantum yields and fluorescence lifetimes of 2,5-bis(2-methoxyethoxy)terephthalohydrazide-based COFs in the solid state were also determined (Fig. S6†). The quantum yields of COFBMTH-TFB, COFBMTH-TB, COFBMTH-TBT and COFBMTH-HB were 1.54%, 1.20%, 0.20% and 0.62%, and the fluorescence lifetimes were 3.02 ns, 1.48 ns, 0.77 ns and 0.93 ns, respectively (Table S3†). These are consistent with the above fluorescence test results, where the higher the quantum yield, the higher the fluorescence intensity.
3.3. Optimizing conditions
The solvent, COF concentration and pH were optimized before 2,5-bis(2-methoxyethoxy)terephthalohydrazide-based COFs were applied in NOR detection. As shown in Fig. S7,† the four hydrazine-linked COFs all showed better fluorescence emission in DMA, DMF, DMSO, water, acetone and methanol. The COFBMTH-TFB, COFBMTH-TB, COFBMTH-TBT and COFBMTH-HB have the strongest fluorescence emission in DMF, methanol, DMSO and water, respectively. This might be due to the best dispersion of COFBMTH-TFB, COFBMTH-TB, COFBMTH-TBT and COFBMTH-HB in DMF, methanol, DMSO and water, respectively. Therefore, DMF, methanol, DMSO and water were chosen as solvents for COFBMTH-TFB, COFBMTH-TB, COFBMTH-TBT and COFBMTH-HB, respectively. Then, the concentrations of 2,5-bis(2-methoxyethoxy) terephthalohydrazide-based COFs were optimized. As shown in Fig. S8,† the fluorescence intensity of the four hydrazine-linked COFs gradually increased with the increase in concentration. The fluorescence intensities of COFBMTH-TFB, COFBMTH-TB, COFBMTH-TBT and COFBMTH-HB were almost stable at 180 μg mL−1, 160 μg mL−1, 140 μg mL−1 and 160 μg mL−1, respectively. Therefore, in the follow-up experiment, we chose these four concentrations as the optimal concentrations. The pH value of the solution also affects the detection of NOR. As shown in Fig. S9,† the fluorescence intensities of COFBMTH-TFB and COFBMTH-TB remained stable in the range of pH 2–7, while the fluorescence intensities of COFBMTH-TBT and COFBMTH-HB remained relatively stable in the range of pH 2–6. To reduce errors, pH with stable fluorescence intensity and close to neutral were selected for subsequent experiments. Therefore, pH = 6, 6, 5 and 5 were selected as the optimal pH values for COFBMTH-TFB, COFBMTH-TB, COFBMTH-TBT and COFBMTH-HB, respectively.3.4. Sensing NOR
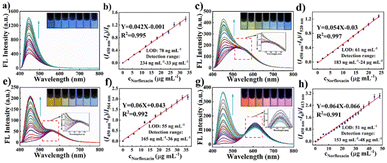
The possibility of detecting NOR with 2,5-bis(2-methoxyethoxy) terephthalohydrazide-based COFs under the optimized conditions were investigated. First, the fluorescence emission intensity of NOR in PBS with different pH was tested. As shown in Fig. S10a,† the fluorescence emission intensity of NOR decreased with the increase in solution acidity. As can be seen from Fig. S10b,† NOR in PBS emits blue fluorescence but does not emit light in water under a UV lamp. This is due to the protonation of nitrogen and oxygen atoms of NOR in an acid solution. Therefore, the ratiometric fluorescence sensing of NOR can be constructed by combining the blue emission of NOR with the emission of hydrazine-linked COFs.As shown in Fig. 4a, the fluorescence emission peak of COFBMTH-TFB at 450 nm overlaps completely with that of NOR. When (I450 nm − I0)/I0 is used as the detection signal, there is greater background fluorescence. The fluorescence emission peak of COFBMTH-TB at 520 nm is closer to that of NOR, also showing a large background fluorescence (Fig. 4c). The fluorescence emission peak of COFBMTH-TBT at 564 nm separates completely from that of NOR, with small background fluorescence (Fig. 4e). With the addition of NOR, the fluorescence intensities of COFBMTH-TB and COFBMTH-TBT were unchanged and the fluorescence emission peak of NOR at 450 nm was gradually enhanced. Therefore, the fluorescence emission peak of COFBMTH-TB and COFBMTH-TBT can be used as an internal reference to construct a single-signal change ratiometric fluorescence sensor. More excitingly, the fluorescence emission peak of COFBMTH-HB at 613 nm has a larger wavelength difference from that of NOR with the lowest background fluorescence (Fig. 4g). As the fluorescence emission peak at 450 nm was enhanced gradually, the fluorescence emission intensity at 613 nm decreased slightly. This indicates that a two-signal change ratiometric fluorescence sensor can be constructed by using COFBMTH-HB with the largest output signal. The fluorescence quenching effect of NOR on COFBMTH-HB might result from the internal filtering effect (IFE) because the excitation spectrum of COFBMTH-HB and UV-vis absorption spectrum of NOR partially overlapped (Fig. S11†). Similarly, the excitation spectra of COFBMTH-TB and COFBMTH-TBT also overlapped slightly with the UV-vis absorption spectrum of NOR, but the emission intensity of 520 nm and 564 nm remained unchanged due to the increase of the baseline.
The detection limits of fluorescence sensors based on COFBMTH-TFB (Fig. 4b), COFBMTH-TB (Fig. 4d), COFBMTH-TBT (Fig. 4f) and COFBMTH-HB (Fig. 4h) for the quantitative detection of NOR were 78 ng mL−1, 61 ng mL−1, 55 ng mL−1 and 51 ng mL−1 (S/N = 3), respectively. The linear ranges were 234 ng mL−1 to 33 μg mL−1, 183 ng mL−1 to 24 μg mL−1, 165 ng mL−1 to 36 μg mL−1 and 153 ng mL−1 to 48 μg mL−1, respectively. The results indicate that the two-signal change ratiometric fluorescence sensor showed the highest sensitivity, the lowest detection limit and the widest linear range (Table S4†). The good detection results might be ascribed to the lowest background fluorescence and the largest output signal. Next, the selectivity of NOR detection using 2,5-bis(2-methoxyethoxy)terephthalohydrazide-based COFs was studied. As shown in Fig. S12a–d,† antibiotics, such as pyrogallic acid (PA), dimetridazole (DT), amoxicillin (AMX), florfenicol (FF), ribavirin (RBV), sulfamethoxazole (SO), metringamycin (MG), aprovir (AW), furfural hydrochloride (FH), albendazole (ABZ), and furantoin (AHD), do not interfere with the detection of NOR. This is because these antibiotics do not emit fluorescence under such excitation.
Under the irradiation of a 365 nm UV lamp, with the increase in NOR concentration, the color of the COFBMTH-TFB solution gradually changed from dark blue to light blue, and only the change in the color shade was difficult to distinguish (inset in Fig. 4a). The color of the COFBMTH-TB solution gradually changed from green to blue, but the color change was relatively simple (inset in Fig. 4c). The color of the COFBMTH-TBT solution gradually changed from yellow to blue (inset in Fig. 4e), while the color of the COFBMTH-HB solution changed from orange to purple, and the rich and obvious color difference is visible to the naked eye (inset in Fig. 4g). Therefore, 2,5-bis(2-methoxyethoxy)terephthalohydrazide-based COFs can be used for the visual detection of NOR.
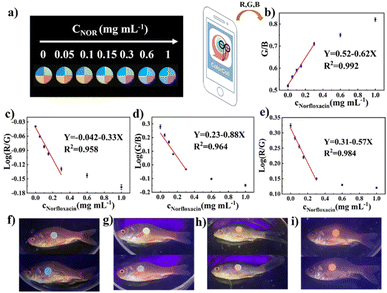
A novel fluorescence test paper based on the color change of 2,5-bis(2-methoxyethoxy)terephthalohydrazide-based COFs was developed for the visual detection of NOR. As shown in Fig. 5a and S13,† obvious color changes occurred simultaneously when NOR was dropped on the test paper, which not only made the visualization more colorful but also increased the accuracy of the visual detection results. With the increase in NOR concentration, under the irradiation of a 365 nm UV lamp, the color of the test paper based on COFBMTH-TFB, COFBMTH-TB, COFBMTH-TBT and COFBMTH-HB sections varied from dark blue to light blue, yellow-green to blue, yellow to blue and orange-red to purple, respectively. Based on the above phenomenon, the “ColorColl” APP can convert the color signal of the photo into color information (RGB value). As shown in Fig. 5b–e, the appropriate two channels from among the three channels (red channel (R), green channel (G) and blue channel (B)) were used to calculate the concentration of NOR. The detection limit and detection range of the COFBMTH-TFB section were 5.3 μg mL−1 and 15.9 μg mL−1 to 0.3 mg mL−1, respectively (Fig. 5b). The detection limit and detection range of the COFBMTH-TB section were 10 μg mL−1 and 30 μg mL−1 to 0.3 mg mL−1, respectively (Fig. 5c). The detection limit and detection range of the COFBMTH-TBT section were 3.7 μg mL−1 and 11.1 μg mL−1 to 0.3 mg mL−1, respectively (Fig. 5d). The detection limit and detection range of the COFBMTH-HB section were 5.7 μg mL−1 and 17.3 μg mL−1 to 0.3 mg mL−1, respectively (Fig. 5e) (Table S5†). Fish were cultured in water containing NOR. Since NOR would remain on the fish scales, when four kinds of test paper were pasted on the backs of the fish, the changes in the test paper from dark blue to light blue, yellow-green to blue, yellow to blue and orange-red to purple were observed, respectively (Fig. 5f–i). This method is simple and rapid and has broad application prospects in the field of real sample safety of fish food.
3.5. Multiple information encryption program
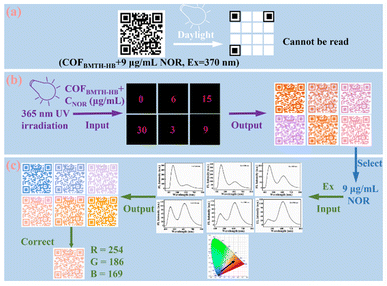
Multicolor fluorescent materials with controlled luminescence have potential application value in the fields of biological imaging, information storage and encryption.53–55 A two-dimensional code with multiple information encryption was developed by taking advantage of the obvious color change as well as the excitation dependence of COFBMTH-HB during the detection of NOR. These codes carry information that is only visible in UV light but shows similar colors under daylight conditions (the first encryption). The information is dynamic with NOR concentration and can only be read at a specific concentration (the second encryption). To obtain the complete information, it is necessary to input the correct excitation under the specific concentration (the third encryption). Finally, the hidden correct information and the correct RGB value can be obtained by scanning the smartphone.The specific operation was as follows. Firstly, the “(COFBMTH-HB + 9 μg mL−1 NOR, Ex = 370 nm)” was converted into a two-dimensional code, and the COFBMTH-HB solution was applied on the corresponding position, and the encrypted information could not be read under daylight conditions due to the colorless nature of the COFBMTH-HB solution (Fig. 6a). As the concentration of NOR increased (0, 3, 6, 9, 15, 30 μg mL−1), different color changes were displayed under 365 nm UV light irradiation. According to the pre-set concentration, only the information with 9 μg mL−1 NOR added could be output (Fig. 6b). Since COFBMTH-HB + NOR constitutes a dual-emission system exhibiting different emission colors under different excitations, the excitation wavelengths were taken as the third encrypted signal. With the increase of the excitation wavelength from 340 nm to 390 nm, the emission intensity at 450 nm gradually decreased, while that at 613 nm gradually increased, and the emission color changed from dark blue to light purple and then gradually transitioned to orange-red. For the correct excitation output of 370 nm, the final correct information was “(COFBMTH-HB + 9 μg mL−1 NOR, Ex = 370 nm)”, and the correct RGB values were 254, 186, and 169, respectively (Fig. 6c). Other NOR concentrations and excitation wavelengths were error information, which effectively improved the information security. Therefore, this system can be used for multiple information encryption.
4. Conclusions
Four hydrazine-linked COFs with different emissions were synthesized by integrating the methoxy group and different numbers of hydroxyl groups into the pore wall. These sites can trigger various π-electron effects, including resonance, hyperconjugation, and tautomerism, to change the conjugation of the framework and thus precisely regulate the emission wavelength. In addition, the fluorescence of NOR itself was combined with the fluorescence of 2,5-bis(2-methoxyethoxy) terephthalohydrazide-based COFs to achieve the ratiometric fluorescence detection of NOR. With the increase in NOR concentration, the color of these solutions changed from dark blue to light blue, from yellow-green to blue, from yellow to blue, and from orange-red to purple, respectively. A novel test paper was further designed as a real-time detection tool in combination with a smartphone APP. Four hydrazine-linked COFs responded simultaneously to NOR to achieve multiple chrominance changes, and the detection limits were 5.3 μg mL−1, 10.0 μg mL−1, 3.7 μg mL−1 and 5.7 μg mL−1, respectively. This portable paper-based sensor combined with a smartphone visual NOR detection platform provides a viable approach for rapid and simple visual NOR detection. In addition, by adjusting the ratio of COFBMTH-HB and NOR, as well as the excitation wavelength, unique and rich luminescence behaviors can be achieved for the construction of multi-information encrypted quick response codes. This work reveals the precise modulation of the emission wavelength of hydrazine-linked COFs and realizes its different applications.Author contributions
Haifei Wan: analyzed the data, resources, investigation, writing – original draft. Mengyao Li: methodology, validation. Li Wang: methodology, writing – review & editing, supervision. Yonghai Song: conceptualization, funding acquisition, supervision, writing – review & editing.Conflicts of interest
The authors declare that they have no conflict of interest.Acknowledgements
This work was financially supported by National Natural Science Foundation of China (22264016, 21964010, 21765009 and 21665012).References
- G. Zhou, P. Wang, H. Li, R. Huang, B. Hu, Y. Liu and T. Li, Appl. Catal., B, 2021, 298, 120525 CrossRef CAS.
- Y. Zhao, X. Liang, X. Hu and J. Fan, J. Colloid Interface Sci., 2021, 589, 336–346 CrossRef CAS PubMed.
- N. Fang, Q. He, L. Sheng, Y. Xi, L. Zhang, H. Liu and H. Cheng, J. Hazard. Mater., 2021, 418, 126273 CrossRef CAS PubMed.
- G. Li, J. Wu, X. Qi, X. Wan, Y. Liu, Y. Chen and L. Xu, Mater. Today Chem., 2022, 26, 101043 CrossRef CAS.
- A. Rani, S. Pan and C. Chang, Electroanalysis, 2023, 35, e202100699 CrossRef CAS.
- C. Li, Q. Tian, Y. Zhang, Y. Li, X. Yang, H. Zheng, L. Chen and F. Li, Water Res., 2022, 210, 117985 CrossRef CAS PubMed.
- J. Shen, X. Wen and Z. Fan, Sens. Actuators, B, 2023, 381, 133436 CrossRef CAS.
- C. Ye, X. Chen, D. Zhang, J. Xu, H. Xi, T. Wu, D. Deng, C. Xiong, J. Zhang and G. Huang, Electrochim. Acta, 2021, 379, 138174 CrossRef CAS.
- S. Chen, Y. Zhu, J. Han, T. Zhang, R. Chou, A. Liu, S. Liu, Y. Yang, K. Hu and L. Zou, Foods, 2023, 12, 544 CrossRef CAS PubMed.
- L. Fang, Y. Miao, D. Wei, Y. Zhang and Y. Zhou, Chemosphere, 2021, 262, 128032 CrossRef CAS PubMed.
- Y. Cheng, H. Wang, Y. Zhuo, D. Song, C. Li, A. Zhu and F. Long, Biosens. Bioelectron., 2022, 199, 113863 CrossRef CAS PubMed.
- M. Yu, Y. Xie, X. Wang, Y. Li and G. Li, ACS Appl. Mater. Interfaces, 2019, 11, 21201–21210 CrossRef CAS PubMed.
- D. Yang, Y. Shi, T. Xiao, Y. Fang and X. Zheng, Inorg. Chem., 2023, 62, 6084–6091 CrossRef CAS PubMed.
- S. Wang, X. Bao, B. Gao and M. Li, Dalton Trans., 2019, 48, 8288–8296 RSC.
- N. Zeng, L. Ren and G. Cui, CrystEngComm, 2022, 24, 931 RSC.
- Y. Ye, T. Wu, X. Jiang, J. Cao, X. Ling, Q. Mei, H. Chen, D. Han, J. Xu and Y. Shen, ACS Appl. Mater. Interfaces, 2020, 12, 14552–14562 CrossRef CAS PubMed.
- Z. Yang, H. Li, T. Xu, M. She, J. Chen, X. Jia, P. Liu, X. Liu and J. Li, J. Mater. Chem. A, 2023, 11, 2679–2689 RSC.
- J. Xiao, M. Liu, F. Tian and Z. Liu, Inorg. Chem., 2021, 60, 5282–5289 CrossRef CAS PubMed.
- Y. Xu, Y. Lin, N. Chu, Y. Xing and X. Chen, Chem. Eng. J., 2022, 435, 134907 CrossRef CAS.
- L. Yang, M. Li, L. Kuang, Y. Li, L. Chen, C. Lin, L. Wang and Y. Song, Biosens. Bioelectron., 2022, 214, 114527 CrossRef CAS PubMed.
- C. Wang, C. Wang, X. Zhang, X. Ren, B. Yu, P. Wang, Z. Zhao and H. Fu, Chin. Chem. Lett., 2022, 33, 1353–1357 CrossRef CAS.
- Y. Ye, T. Wu, X. Jiang, J. Cao, X. Ling, Q. Mei, H. Chen, D. Han, J. Xu and Y. Shen, ACS Appl. Mater. Interfaces, 2020, 12, 14552–14562 CrossRef CAS PubMed.
- L. Guo, L. Yang, M. Li, L. Kuang, L. Wang and Y. Song, Coord. Chem. Rev., 2021, 440, 213957 CrossRef CAS.
- Y. Su, B. Li, H. Xu, C. Lu, S. Wang, B. Chen, Z. Wang, W. Wang, K. Otake, S. Kitagawa, L. Huang and C. Gu, J. Am. Chem. Soc., 2022, 144, 18218–18222 CrossRef CAS PubMed.
- Y. Gao, Z. Yu, L. Huang, Y. Zeng, X. Liu and D. Tang, Anal. Chem., 2023, 95, 9130–9137 CrossRef CAS PubMed.
- Y. Su, K. Otake, J. Zheng, S. Horike, S. Kitagawa and C. Gu, Nature, 2022, 611, 289–294 CrossRef CAS PubMed.
- H. Chen, Z. Gu and J. Zhang, J. Am. Chem. Soc., 2022, 144, 7245–7252 CrossRef CAS PubMed.
- X. Cui, S. Lei, A. C. Wang, L. Gao, Q. Zhang, Y. Yang and Z. Lin, Nano Energy, 2020, 70, 104525 CrossRef CAS.
- X. Cui, L. Gao, R. Ma, Z. Wei, C. Lu, Z. Li and Y. Yang, J. Mater. Chem. A, 2021, 9, 20985 RSC.
- H. Liang, Y. Luo, Y. Xiao, J. Xiong, R. Chen, Y. Song and L. Wang, Chem. Eng. J., 2023, 460, 141740 CrossRef CAS.
- L. Wang, Y. Yang, H. Liang, N. Wu, X. Peng, L. Wang and Y. Song, J. Hazard. Mater., 2021, 409, 124528 CrossRef CAS PubMed.
- H. Peng, S. Huang, V. Garcia, D. Pakulski, H. Guo, F. Richard, X. Zhuang, P. Samori and A. Ciesielski, Angew. Chem., Int. Ed., 2023, 62, e202216136 CrossRef CAS PubMed.
- G. Das, B. Garai, T. Prakasam, F. Benyettou, S. Varghese, S. Sharma, F. Gándara, R. Pasricha, M. Baias, R. Jagannathan, N. Saleh, M. Elhabiri, M. Olson and A. Trabolsi, Nat. Commun., 2022, 13, 3904 CrossRef CAS PubMed.
- Y. Gao, Y. Zeng, X. Liu and D. Tang, Anal. Chem., 2022, 94, 4859–4865 CrossRef CAS PubMed.
- L. Kuang, S. Wang, H. Wan, L. Chen, L. Wang and Y. Song, Adv. Opt. Mater., 2023, 11, 2202975 CrossRef CAS.
- J. Yue, X. Ding, Y. Wang, Y. Wen, P. Yang, Y. Ma and B. Tang, J. Mater. Chem. A, 2021, 9, 26861–26866 RSC.
- H. Liang, Y. Luo, Y. Li, Y. Song and L. Wang, Anal. Chem., 2022, 94, 5352–5358 CrossRef CAS PubMed.
- S. Shang, S. An, H. Li, J. Li, S. Zhang, C. Peng, H. Liu and J. Hu, J. Mater. Chem. A, 2023, 11, 7539–7544 RSC.
- H. Wan, S. Wang, H. Chen, L. Chen, Y. Song and L. Wang, Mater. Today Chem., 2022, 26, 101178 CrossRef CAS.
- L. Yang, Y. Song, J. Li, W. Xu, C. Peng and L. Wang, Chemosphere, 2023, 311, 136919 CrossRef CAS PubMed.
- Y. Li, J. Sui, L. Cui and H. Jiang, J. Am. Chem. Soc., 2023, 145, 1359–1366 CrossRef CAS PubMed.
- M. Li, H. Wan, J. Xiong, L. Wang, L. Yang, L. Wang and Y. H. Song, Chem. Eng. J., 2023, 468, 143538 CrossRef CAS.
- X. Li, Q. Gao, J. Wang, Y. Chen, Z. Chen, H. Xu, W. Tang, K. Leng, G. Ning, J. Wu, Q. Xu, S. Y. Quek, Y. Lu and K. P. Loh, Nat. Commun., 2018, 9, 2335 CrossRef PubMed.
- Z. Li, K. Geng, T. He, K. Tan, N. Huang, Q. Jiang, Y. Nagao and D. Jiang, Angew. Chem., Int. Ed., 2021, 60, 19419–19427 CrossRef CAS PubMed.
- L. Wang, C. Yang and X. Yan, Sci. China: Chem., 2018, 61, 1470–1474 CrossRef CAS.
- Y. Cao, Z. Jia, J. Yang, J. Zhang, J. Wang and W. Qin, Sens. Actuators, B, 2022, 368, 132203 CrossRef CAS.
- Q. Wang, B. Lin, M. Chen, C. Zhao, H. Tian and D. Qu, Nat. Commun., 2022, 13, 4185 CrossRef CAS PubMed.
- J. Jiang, P. Zhang, Y. Tian, Z. Lin, C. Zhang, J. Cui, J. Chen and X. Chen, Sci. China Mater., 2023, 66, 1949–1958 CrossRef CAS.
- C. Gu, N. Hosono, J. Zheng, Y. Sato, S. Kusaka, S. Sakaki and S. Kitagawa, Science, 2019, 363, 387–391 CrossRef CAS PubMed.
- Y. Su, Z. Wang, A. Legrand, T. Aoyama, N. Ma, W. Wang, K. Otake, K. Urayama, S. Horike, S. Kitagawa, S. Furukawa and C. Gu, J. Am. Chem. Soc., 2022, 144, 6861–6870 CrossRef CAS PubMed.
- G. Li, W. Tian, C. Zhong, Y. Yang and Z. Lin, ACS Appl. Mater. Interfaces, 2022, 14, 21750–21757 CrossRef CAS PubMed.
- S. Wu, D. Ren, K. Zhou, H. Xia, X. Liu, X. Wang and J. Li, J. Am. Chem. Soc., 2021, 143, 10547–10552 CrossRef CAS PubMed.
- X. Yin, Y. Sun, H. Yu, Y. Cheng and C. Wen, Anal. Chem., 2022, 94, 4938–4947 CrossRef CAS PubMed.
- Y. Wang, X. Tian, H. Zhang, Z. Yang and X. Yin, ACS Appl. Mater. Interfaces, 2018, 10, 22445–22452 CrossRef CAS PubMed.
- Y. Sui, C. Li, S. Feng, Y. Ling, C. Li, X. Wu, J. Shen, J. Song, H. Peng and W. Huang, J. Mater. Chem. A, 2021, 9, 8586–8597 RSC.
Footnote |
| † Electronic supplementary information (ESI) available. See DOI: https://doi.org/10.1039/d3ta04781d |
| This journal is © The Royal Society of Chemistry 2023 |

