 Open Access Article
Conformations of polyolefins on platinum catalysts control product distribution in plastics recycling†
Mehdi
Zare
a,
Pavel A.
Kots
a,
Stavros
Caratzoulas
*a and
Dionisios G.
Vlachos
 *ab
*ab
aCenter for Plastics Innovation, University of Delaware, 221 Academy Street, Newark, Delaware 19716, USA. E-mail: cstavros@udel.edu; vlachos@udel.edu
bDepartment of Chemical and Biomolecular Engineering, University of Delaware, 150 Academy Street, Newark, Delaware 19716, USA
First published on 3rd January 2023
Abstract
The design of catalysts for the chemical recycling of plastic waste will benefit greatly from an intimate knowledge of the interfacial polymer–catalyst interactions that determine reactant and product distributions. Here, we investigate backbone chain length, side chain length, and concentration effects on the density and conformation of polyethylene surrogates at the interface with Pt(111) and relate them to experimental product distributions resulting from carbon–carbon bond cleavage. Using replica-exchange molecular dynamics simulations, we characterize the polymer conformations at the interface by the distributions of trains, loops, and tails and their first moments. We find that the preponderance of short chains, in the range of 20 carbon atoms, lies entirely on the Pt surface, whereas longer chains exhibit much broader distributions of conformational features. Remarkably, the average length of trains is independent of the chain length but can be tuned via the polymer–surface interaction. Branching profoundly impacts the conformations of long chains at the interface as the distributions of trains become less dispersed and more structured, localized around short trains, with the immediate implication of a wider carbon product distribution upon C–C bond cleavage. The degree of localization increases with the number and size of the side chains. Long chains can adsorb from the melt onto the Pt surface even in melt mixtures containing shorter polymer chains at high concentrations. We confirm experimentally key computational findings and demonstrate that blends may provide a strategy to reduce the selectivity for undesired light gases.
Introduction
Global plastic production has increased exponentially over the last few decades and reached over 400 Mt in 2017 (290 Mt of plastic waste every year).1 In 2016, 65% of the plastic waste was incinerated or landfilled and only 17% was recycled (16% mechanically and <1% chemically).2 Mechanical recycling decreases the quality of the product (downcycling) and also requires efficient collection to obtain a homogeneous plastic stream. In contrast, chemical recycling/upcycling can be applied to a wide range of plastics, relieves the pressure on the collection infrastructure, and can yield diverse final products (upcycling).3–5 For these reasons, catalytic chemical deconstruction has garnered significant attention toward a circular economy (keeping plastic in the economy and out of the environment).1,6–12A main shortcoming and opportunity in the chemical recovery of plastic waste is that its commercialization requires new technologies based on heterogeneous catalysts.13 To expedite technological developments, it is critical to understand catalyst–plastic interfacial phenomena at the molecular level under reaction conditions. Polyolefins make up a major part of the plastic waste stream and chemical recovery entails catalytic clipping of their backbone; naturally, the product distribution and value depend on the position and number of C–C bonds being cleaved. In other words, the product distribution is determined by the conformation of the polymer on the catalyst.
In this work, we employ replica-exchange molecular dynamics (REMD)14–17 and the multi-state Bennett acceptance ratio (MBAR)18 method to sample the conformational space of polymer melts in the adsorbed layer over metal surfaces. We hypothesize that the product carbon distributions obtained experimentally from various feedstocks (low-density polyethylene, LDPE; high-density polyethylene, HDPE; polypropylene, PP; etc.), catalysts and reactor residence times are related to the conformations of the adsorbed polymer chains. We study polymer chain length effects by simulating pure C20, C26, C44, C71 and C142 surrogates of PE melts, and concentration effects by simulating C142![[thin space (1/6-em)]](https://www.rsc.org/images/entities/char_2009.gif) :
:![[thin space (1/6-em)]](https://www.rsc.org/images/entities/char_2009.gif) C20 mixtures of varying concentrations over Pt(111) at 473 K. We assess and discuss how short-chain polymers forming via C–C bond cleavage impact the final product carbon distribution. In addition, we investigate branching effects on the polymer at the catalyst–polymer interface by simulating the C71 PE melt backbone branched with methyl, ethyl, and propyl groups. Finally, we discuss the simulation results in the context of our own and previously reported experimental product distributions.
C20 mixtures of varying concentrations over Pt(111) at 473 K. We assess and discuss how short-chain polymers forming via C–C bond cleavage impact the final product carbon distribution. In addition, we investigate branching effects on the polymer at the catalyst–polymer interface by simulating the C71 PE melt backbone branched with methyl, ethyl, and propyl groups. Finally, we discuss the simulation results in the context of our own and previously reported experimental product distributions.
Computational details
Molecular dynamics (MD) simulations were performed using a LAMMPS molecular dynamics simulator.19 Using the supercell approach, a clean Pt(111) surface was represented by a 12 × 14 slab for short-chain polyethylene (PE) melt simulations (C20, C26, and C44) and by a 15 × 17 slab for long-chain PE melt simulations (C71, C144, mixtures of C20 and C142, and C71 branched melts). The respective simulation boxes comprise 672 and 1020 Pt atoms. The smaller of the two simulation boxes (used for short-chain melts) has dimensions of 33.24 Å × 33.59 Å × 60.00 Å; the larger of the two (used for long-chain melts) has dimensions of 41.55 Å × 40.79 Å × 75.00 Å. The experimental PE melt density20 of ∼0.7 g cm−3 at 473 K in the middle of the box, which represents bulk PE, was fixed by packing the simulation boxes with the PE chains (see Table S1† for the number of chains used in the simulations). The dimensions of the simulation boxes along the catalyst surface normal were selected so that the PE melt layer will be at least 3 times as large as the equilibrium root-mean-square radius-of-gyration (Rg) of the PE chains in the bulk21 (see Table S2† for Rg of different PEs calculated in the bulk). The PE melts are exposed to the catalyst surface on one side and vacuum on the other side along the surface normal. All metal atoms were kept fixed during the simulations. The PE melts were initially built using the Moltemplate program package22 with the OPLS-AA force field23,24 for PE interactions. The Pt–PE interactions were represented by a Lennard–Jones Pt potential.25 The LJ cross-term of the intermolecular parameters were calculated by the geometric mixing rules, and
and  . Simulations were carried out in the canonical ensemble (NVT) with the Nosé–Hoover thermostat.26,27 Electrostatic interactions were accounted for by using a particle–particle particle–mesh (PPPM) method.28 A 12 Å cutoff radius was used for the van-der-Waals interactions and the transition between short- and long-range electrostatic interactions.
All systems were simulated in three stages. First, the bulk PE melt was equilibrated for 1 ns in the NPT ensemble, followed by a 25 ns NVT ensemble simulation. Next, the equilibrated PE melt was brought to the catalyst surface and the entire system was equilibrated for 25 ns in the NVT ensemble. Finally, the systems were equilibrated for 5 ns using replica-exchange molecular dynamics (REMD) and data were collected for another 10 ns using 9 replicas. Details of the REMD procedures can be found elsewhere.14–17 The swap between replicas was tried every 10 ps and the snapshots were recorded for each replica every 5 ps. In order to prevent possible drift or rotation of atoms by the temperature corrections, a momentum drift correction was applied every 50 ps.
In the REMD simulations, replicas were selected to obtain a ∼20% acceptance probability of swap moves (Pacc) between adjacent replicas, which ensures a free random walk in the temperature space (see Table S3† for temperatures and Pacc obtained after each simulation).15,29 For example, the time series of replica exchange simulation at 473 K, time series of temperature exchange and the total potential energy of the first replica, for the C26 melt over Pt(111) are provided in Fig. S1,† indicating a free random walk in the replica and temperature space, respectively. To achieve the optimal temperature distribution that ensures equal Pacc, we used the methodology proposed by Rathore et al.30 We used the multi-state Bennet acceptance ratio (MBAR) estimator,18 implemented in the pymbar program package, to obtain unbiased statistical distributions and averages.
Experimental methods
The Pt/Al2O3 catalyst was prepared as follows. Pural SB boehmite (provided by Sasol) was calcined in air at 600 °C to convert it to γ-alumina. A required amount of [Pt(NH3)4](NO3)2 (Sigma-Aldrich) was dissolved in DI water (1.5 g) and added to the Al2O3 support at 70 °C. The mixture was stirred with a glass rod for 2 h and then dried overnight at 100 °C in an oven. Subsequently, the sample was heated in pure He at 400 °C for 4 h (ramp rate 2 °C min−1) and then in 20% H2/He at 300 °C for 2 h.The solid polymer (PE, Mw ∼4 kDa, Mn ∼1.7 kDa, Sigma-Aldrich) or a mixture of PE and icosane (TCI) was mixed with a freshly reduced catalyst and loaded in a high-pressure stainless-steel Parr reactor with a Teflon magnetic stir bar without a liner. The reactor was sealed, purged with H2 five times, and then pressurized with 30 bar H2. Then, the reactor was heated on a hot plate using a band heater for 5 h at 300 °C (ramp rate 10 °C min−1) with magnetic stirring, starting at 110 °C, at 500 rpm setpoint. The reaction temperature was set higher than the simulation temperature. At 300 °C, the adsorbed hydrocarbons react over the Pt surface, allowing us to elucidate how the product distribution is influenced by the binding mode of the polymer or shorter alkane. We focused on low reaction times to form only primary reaction products and avoid extensive secondary hydrogenolysis typical of Pt catalysts.
After the reaction, the reactor was quenched with cold water and ice to 5–6 °C. The gas from the headspace was extracted to a 1 L Tedlar gas bag. The liquid and residual solid in the reactor were mixed with dichloromethane (DCM) solvent (Fisher Scientific) and 20 mg of octacosane (TCI) standard dissolved in DCM. Then the liquid and solid were separated using a Whatman 100 μm filter. The gaseous products were analyzed using a GC-FID with a CP-plot Q 30 m column. Gas standards were used for FID calibration and retention times. The liquid was analyzed on a GC-FID with an HP-1 30 m column using a standard alkane solution for FID calibration. The residual solid was measured gravimetrically. The carbon yield is defined as:
When PE was mixed with C20, all residual C20 was extracted with excess DCM and analyzed on a GC-FID using an octacosane standard. The residual undissolved C20 content in the solid residue was below 5 wt%.
Results and discussion
Analysis of REMD simulations
We used the standard definitions of trains, tails, and loops to analyze the conformations of PE chains on the surface.31,32 An illustration of these conformational features is given in Fig. 1: contiguous backbone carbon atoms on the surface define a train; two successive trains are connected by a loop, whose carbon atoms do not lie on the surface; and a tail succeeds a train that is not followed by another one. The length of a train, tail, or loop is defined by the number of C–C bonds. These features enable us to statistically predict which and how many C–C bonds lie at the surface and in turn infer the probability of C–C bond cleavage at some position in the chain and thus relate the conformation of the polymer at the catalyst surface to the product distribution. In our analysis, the thickness of the adsorbed layer was defined by the minimum at ∼5 Å in the density distribution along the surface normal, as shown in Fig. 2. The sharp peak at 3.2 Å indicates a region of higher-than-bulk density on account of the strong Pt–alkane interactions compared with the competing alkane–alkane interactions. It is evident from ρ(z) and the significant vestigial structure up to about 14 Å that the surface induces a long-range order in the polymer melt; farther away from the surface, the density approaches the bulk value for alkanes at 473 K (∼0.7 g cm−3). | ||
| Fig. 1 Schematic representation of trains (blue), tails (red), and loops (green). The thickness of the adsorbed layer was set to 5 Å, which was defined using the density distribution in Fig. 2. | ||
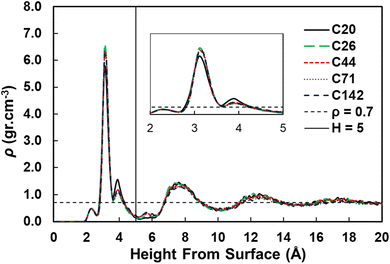 | ||
| Fig. 2 Density distributions as a function of the distance from the Pt(111) surface for pure PE surrogates. The inset shows the zoom in region from 2 to 5 Å from the surface. | ||
Chain length effects
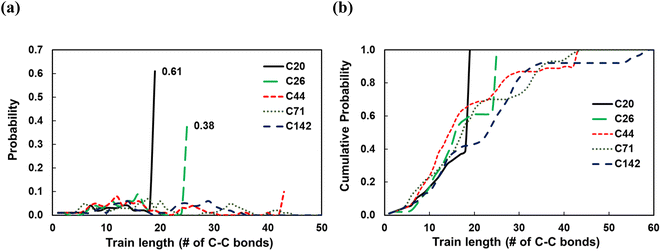
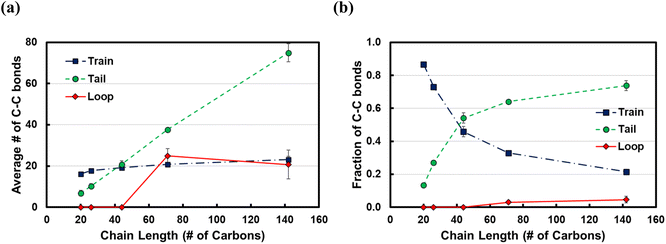
To investigate the dependence of the structural properties of surface adsorbed chains on the length of the PE chain, we simulated C20, C26, C44, C71, and C142 melts at 473 K over the Pt(111) surface. Train size, ltrain, probabilities are plotted in Fig. 3. For short chains (C20 and C26), the train distributions have a significant structure in the sense that they are peaked at ltrain equal to the size of the chain, namely, the probability of short chains lying entirely on the surface is high. This was also reported by Daoulas et al.21 in a study of the PE melt over graphite and was attributed to the enthalpy gains from full-length adsorption countering the severe entropic penalty associated with constraints on chain propagation in a direction normal to the surface. We should note that the preponderance of chains preferably adsorb with their ends as shown in Fig. S2† where we plot the probability of a chain atom to be leading a train for polymer chains of varying lengths. The distribution in ltrain becomes less structured and more dispersed with increasing chain size. This is also evident from the cumulative distributions plotted in Fig. 3b. For the C71 chain, we calculated probability values of 0.70 for ltrain ≤ 23 and 0.22 for 28 ≤ ltrain ≤ 37. For the longer C142 chain, we find a large probability of 0.42 for ltrain ≤ 18 but also an equally large probability of 0.49 for longer length trains, 20 ≤ ltrain ≤ 35. Despite these differences, the average length of trains,![[l with combining macron]](https://www.rsc.org/images/entities/i_char_006c_0304.gif) train ≈ 20, seems to be weakly dependent on the size of the adsorbed chain (see Fig. 4a), a behavior also predicted by the Scheutjens–Fleer lattice theory of polymer adsorption33,34 in the limit of zero solvent concentration.
train ≈ 20, seems to be weakly dependent on the size of the adsorbed chain (see Fig. 4a), a behavior also predicted by the Scheutjens–Fleer lattice theory of polymer adsorption33,34 in the limit of zero solvent concentration. ![[l with combining macron]](https://www.rsc.org/images/entities/i_char_006c_0304.gif) tail increases monotonically with increasing chain length, also predicted by the Scheutjens–Fleer lattice theory and reported in simulations of the PE melt over a graphite surface.21,33,34 Consistently,
tail increases monotonically with increasing chain length, also predicted by the Scheutjens–Fleer lattice theory and reported in simulations of the PE melt over a graphite surface.21,33,34 Consistently, ![[l with combining macron]](https://www.rsc.org/images/entities/i_char_006c_0304.gif) loop ≈ 0 for short-chain alkanes, while a plateau value of a
loop ≈ 0 for short-chain alkanes, while a plateau value of a ![[l with combining macron]](https://www.rsc.org/images/entities/i_char_006c_0304.gif) loop ≈ 20 is reached for longer chains.
loop ≈ 20 is reached for longer chains.
It is instructive to consider the fraction of C–C bonds that belong to trains, tails, and loops (ftrain, ftail, and floop); these are shown in Fig. 4b. Most C–C bonds of the adsorbed chains belong to trains for C20 (ftrain = 0.87) and C26 (ftrain = 0.73) since the chain statistically prefers to be entirely on the surface. Increasing the chain length to C44 decreases the dominance of trains sharply, albeit less so for longer chains. Furthermore, most of the C–C bonds of long-chain PE melts belong to tails, but this dominance reaches a plateau for very long chains. We note that the Scheutjens–Fleer lattice theory in the limit of very long chains predicts ftail = 2/3, since in polymer adsorption from the melt (i.e., in the limit of zero solvent concentration), nearly two tails are present per molecule, and the remaining 1/3, middle segment of the chain consists of trains and loops. Our simulations show ftail = 0.74 ± 0.03 for the longest chain (C142) studied here, which agrees qualitatively with the lattice theory.
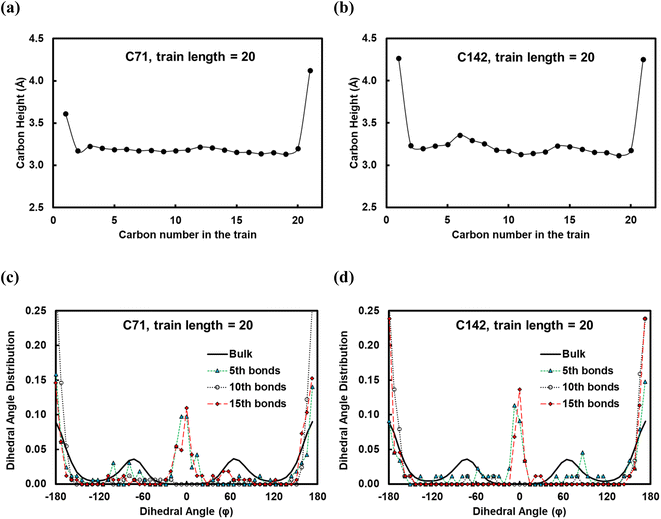
In Fig. 5, we show the results from the conformational analysis of ltrain = 20 trains for the C71 and C142 chains. In Fig. 5a and b, we plot the average distance of train carbon atoms from the surface for C71 and C142, respectively. With the exception of the two train terminal carbon atoms which interact with the fragments of the polymer chain in the melt, all train carbons are within ∼3.3 Å of the Pt surface, indicating that, on average, the trains lie flat on the surface. In Fig. 5c and d, we plot the distribution of the torsion angle, φ, about the 5th, 10th and 15th bonds of the ltrain = 20 train for C71 and C142, respectively. For comparison, we also plot the distribution of all torsion angles of the chains in the melt; clearly, the preponderance of conformations is gauche or anti, φ ≈ ±70° or ±180°, respectively. The middle of a train, the 10th bond, is primarily in an anti conformation, φ ≈ ±180°, whereas the two flanking segments, about the 5th and 15th bonds, exhibit greater conformational diversity as we see eclipsed, φ ≈ 0°, as well as anti conformations. Gauche conformations seem to be rather disfavored and we believe this is because the strong attractive interactions with the metal surface force the polymer to lie flat, presumably overcoming the slightly unfavorable intramolecular interactions which, in the gas phase, are typically relieved by assuming the gauche conformation. The distributions are remarkably similar across chain lengths and this makes intuitive sense.
To investigate the dependence of the results on the Pt potential, we decreased its strength by 50% and reported the data in Fig. S3.† We see similar trends in the average length and fraction of C–C bonds as the chain length increases. However, the longer ![[l with combining macron]](https://www.rsc.org/images/entities/i_char_006c_0304.gif) train for the weaker potential seems counterintuitive. In this context, we calculated the carbon population up to 6 Å from the surface (see Table S4 and Fig. S4†). We see that the carbon population decreases when the Pt potential becomes weaker. We argue that
train for the weaker potential seems counterintuitive. In this context, we calculated the carbon population up to 6 Å from the surface (see Table S4 and Fig. S4†). We see that the carbon population decreases when the Pt potential becomes weaker. We argue that ![[l with combining macron]](https://www.rsc.org/images/entities/i_char_006c_0304.gif) train is controlled by the interplay between the surface–alkane and alkane–alkane (lateral) interactions on the surface in that weaker surface–alkane interactions depress the carbon population on the surface and that, in turn, result in longer trains because there is less lateral repulsion from molecules on the surface. These results underscore that product distributions can be controlled by tuning the surface–polymer interactions.
train is controlled by the interplay between the surface–alkane and alkane–alkane (lateral) interactions on the surface in that weaker surface–alkane interactions depress the carbon population on the surface and that, in turn, result in longer trains because there is less lateral repulsion from molecules on the surface. These results underscore that product distributions can be controlled by tuning the surface–polymer interactions.
Mixture effects
In practice, the chemical conversion of plastics in a reactor involves a mixture of polymer chains of varying sizes. In addition, the concentration of short chains varies with time as C–C bonds keep breaking at the catalyst surface, which further influences the adsorption of the unreacted polymer and thereby the final product distribution in a batch reactor. To understand how the adsorption geometry of long chains is influenced by shorter ones, we simulated C142![[thin space (1/6-em)]](https://www.rsc.org/images/entities/char_2009.gif) :
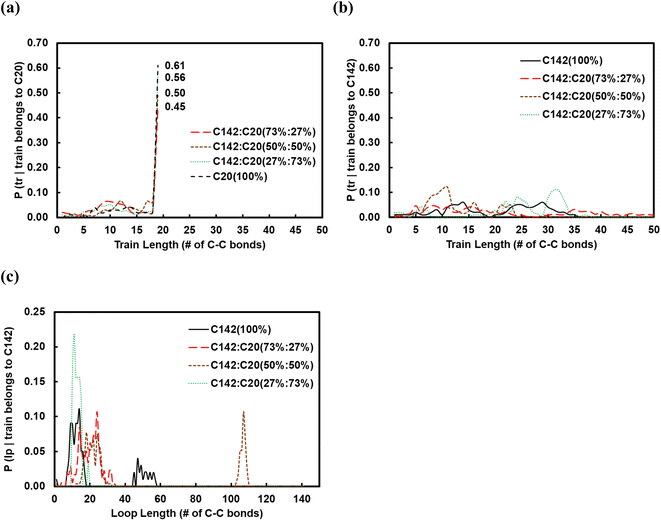
:![[thin space (1/6-em)]](https://www.rsc.org/images/entities/char_2009.gif) C20 binary mixtures containing 27, 50 and 73 wt% of C20. In Fig. 6a and b, we show the corresponding conditional probabilities of train lengths of a given chain identity (belonging either to C20 or to C142). Clearly, by having more of C20 in the mixture raises the probability of its full-length adsorption (ltrain = 19).
C20 binary mixtures containing 27, 50 and 73 wt% of C20. In Fig. 6a and b, we show the corresponding conditional probabilities of train lengths of a given chain identity (belonging either to C20 or to C142). Clearly, by having more of C20 in the mixture raises the probability of its full-length adsorption (ltrain = 19).
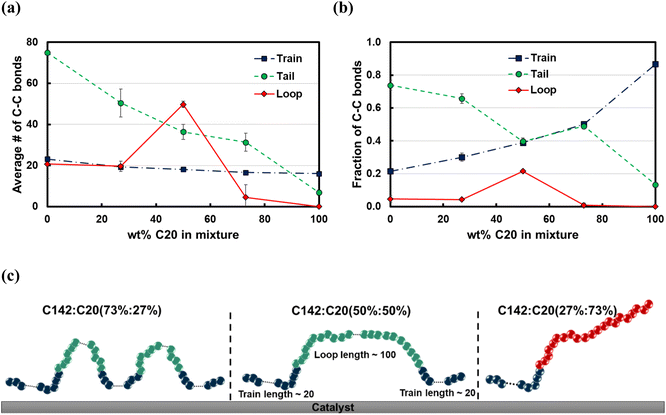
The average train length (![[l with combining macron]](https://www.rsc.org/images/entities/i_char_006c_0304.gif) train ≈ 20), shown in Fig. 7a, seems to be insensitive to the C20 concentration. Interestingly, the average loop length as a function of C20 concentration is flat (
train ≈ 20), shown in Fig. 7a, seems to be insensitive to the C20 concentration. Interestingly, the average loop length as a function of C20 concentration is flat (![[l with combining macron]](https://www.rsc.org/images/entities/i_char_006c_0304.gif) loop ≈ 20) up to 27 wt% C20, goes through a maximum (
loop ≈ 20) up to 27 wt% C20, goes through a maximum (![[l with combining macron]](https://www.rsc.org/images/entities/i_char_006c_0304.gif) loop ≈ 50) at 50 wt% and drops to a value of ∼5 at 73 wt% C20. This trend can be explained by the rather broad peak at lloop ≈ 110 in the conditional distribution corresponding to 50 wt% C20, as shown in Fig. 6c. We argue that at low C20 concentration (27 wt%), the surface is less covered by C20 molecules, which allows more C142 segments on the surface and thus a larger number of short loops should form in C142 (see Fig. 7c). Such conformations, however, are inhibited by the increased presence of C20 molecules at the surface at medium C20 concentration (50 wt%), resulting in fewer yet longer loops (lloop ≈ 100). At even higher C20 concentration (73%), the surface is highly covered in C20 and thus the simultaneous adsorption of both ends of C142 is inhibited, resulting in conformations without loops.
loop ≈ 50) at 50 wt% and drops to a value of ∼5 at 73 wt% C20. This trend can be explained by the rather broad peak at lloop ≈ 110 in the conditional distribution corresponding to 50 wt% C20, as shown in Fig. 6c. We argue that at low C20 concentration (27 wt%), the surface is less covered by C20 molecules, which allows more C142 segments on the surface and thus a larger number of short loops should form in C142 (see Fig. 7c). Such conformations, however, are inhibited by the increased presence of C20 molecules at the surface at medium C20 concentration (50 wt%), resulting in fewer yet longer loops (lloop ≈ 100). At even higher C20 concentration (73%), the surface is highly covered in C20 and thus the simultaneous adsorption of both ends of C142 is inhibited, resulting in conformations without loops. ![[l with combining macron]](https://www.rsc.org/images/entities/i_char_006c_0304.gif) tail decreases almost linearly with increasing C20 concentration in the mixture.
tail decreases almost linearly with increasing C20 concentration in the mixture.
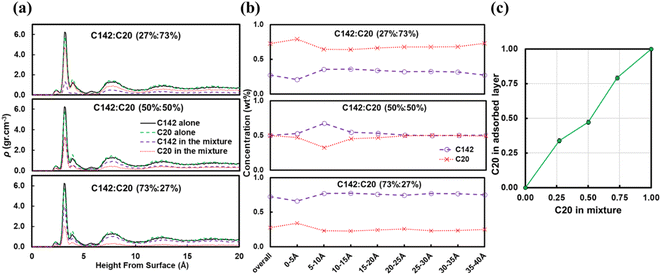
Fig. 7b presents the fraction ftrain for mixtures. It is monotonically increasing with the C20 concentration, giving additional evidence of favorable adsorption of C20. The increase in ftail at 73 wt% C20 is attributed to the absence of loops at high C20 concentration since the surface is mostly covered in C20. Also, the maximum in floop at 50 wt% is aligned with the formation of longer loops observed in Fig. 6c and 7c. Fig. 8 presents the density distribution and carbon concentration of the mixtures at different positions along the surface normal. The carbon concentration in the adsorbed layer seems to be independent of the C20 concentration and almost the same as in the bulk. This highlights that long chains can reach the surface and be cleaved/converted even at high concentrations of shorter chains. This agrees with experimental findings by Celik et al.10 for PE upcycling over a Pt/SrTiO3 catalyst and the observed decrease in dispersity (Đ = Mw/Mn) with increasing reaction time, suggesting the preferential adsorption and cleavage of longer chains. On the other hand, favorable adsorption and cleavage of lighter molecules would result in increasing Đ with time as the lighter chains undergo hydrogenolysis to even shorter chains. The decreasing Đ with reaction time was also observed in a previous study of ours investigating isotactic polypropylene (i-PP) hydrogenolysis over Ru/TiO2.7 These observations also show that C–C bond breaking in a very polydisperse polymer leads to a narrower distribution due to consumption of heavier chains.
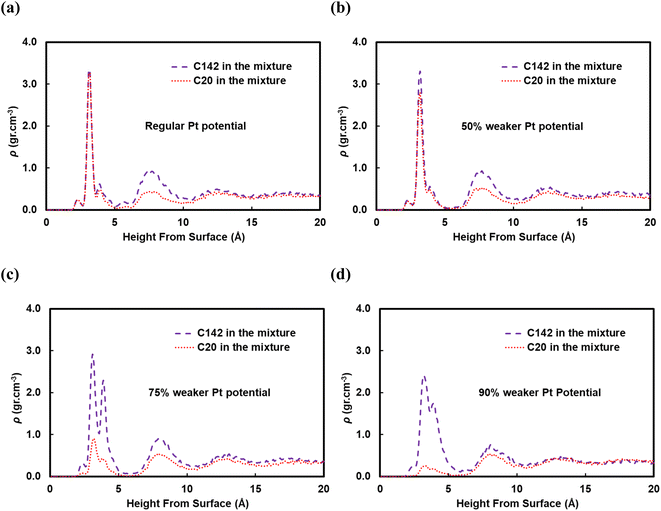
A reviewer of our manuscript brought to our attention that, in polymer blends, segregation of one of the components to the surface is possible. Yethiraj et al.35 have studied the behavior near a noninteracting solid surface of a binary blend with one component being stiffer than the other. They suggested that, at melt-like densities, the stiff chains accumulate at the surface more than the flexible ones do. It has been suggested36 that the observed segregation37,38 is caused by differences in packing and that the surface segregation is a strong function of the relative polymer–polymer and polymer–surface interactions; due to entropic confinement, long chains near weakly attractive surfaces prefer to diffuse away but strong polymer–surface attractive interactions can compensate for the entropic cost. We have investigated this behavior for our system and in Fig. 9 we plot density profiles for the 50![[thin space (1/6-em)]](https://www.rsc.org/images/entities/char_2009.gif) :
:![[thin space (1/6-em)]](https://www.rsc.org/images/entities/char_2009.gif) 50 wt% C20
50 wt% C20![[thin space (1/6-em)]](https://www.rsc.org/images/entities/char_2009.gif) :
:![[thin space (1/6-em)]](https://www.rsc.org/images/entities/char_2009.gif) C142 binary mixture for four cases: the “full” Pt–polymer potential (Fig. 9a) and three potentials in which the Pt–polymer interactions are progressively reduced by 50, 75 and 90% (Fig. 9b, c and d, respectively). Under the full-strength potential, there is no difference between the long and short chains in terms of their preferential segregation at the surface (Fig. 9a). The progressive weakening of the surface–polymer potential, however, seems to affect both the C20 and C142 chains, in the sense that the density peaks at z < 5 Å become more diffuse and less intense, but more so the former. This is an intriguing deviation from Yethiraj36 and warrants further investigation in future work.
C142 binary mixture for four cases: the “full” Pt–polymer potential (Fig. 9a) and three potentials in which the Pt–polymer interactions are progressively reduced by 50, 75 and 90% (Fig. 9b, c and d, respectively). Under the full-strength potential, there is no difference between the long and short chains in terms of their preferential segregation at the surface (Fig. 9a). The progressive weakening of the surface–polymer potential, however, seems to affect both the C20 and C142 chains, in the sense that the density peaks at z < 5 Å become more diffuse and less intense, but more so the former. This is an intriguing deviation from Yethiraj36 and warrants further investigation in future work.
Branching effects
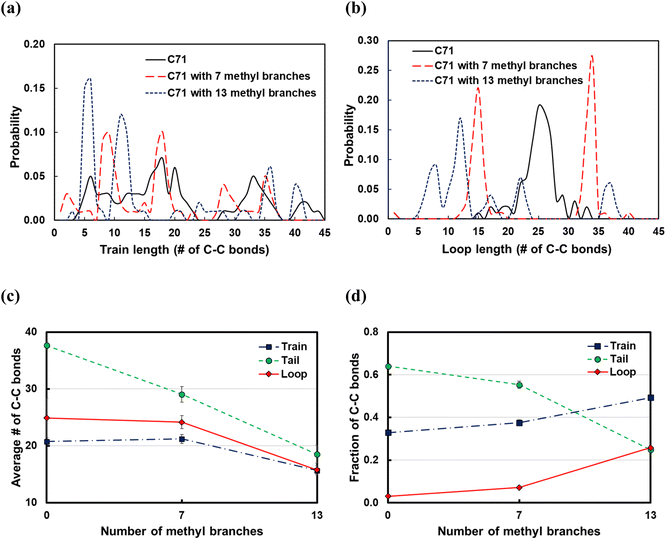
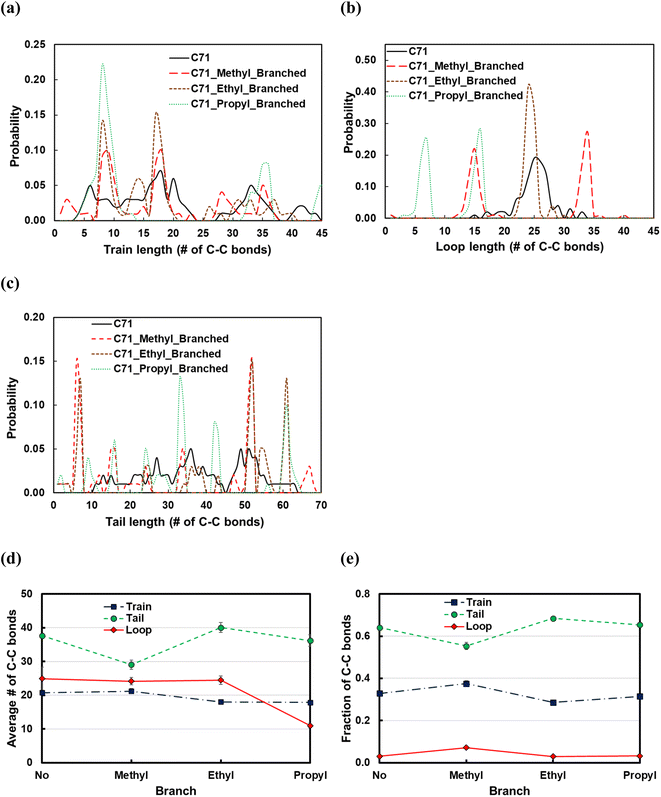
Commercial polyethylene, such as HDPE and LDPE, is a branched molecule endowed with different properties from linear alkanes. To study the effects of branching on the polymer backbone, we considered the C71 alkane and introduced 7 or 13 methyl, ethyl, propyl groups in the backbone; the branches were equally spaced along the chain. From the train and loop size distributions shown in Fig. 10a and b and specifically the sharp peaks at small ltrain and lloop values, we conclude that branching promotes polymer bending around branched carbons and that shorter trains and loops form on increasing the number of branches. As a result, as shown in Fig. 10d, the fraction of C–C bonds in trains and loops increases, and the fraction of those in tails drops. Also,![[l with combining macron]](https://www.rsc.org/images/entities/i_char_006c_0304.gif) train and
train and ![[l with combining macron]](https://www.rsc.org/images/entities/i_char_006c_0304.gif) loop do not vary when we add 7 methyl branches, but they are distributed with sharp peaks at the branching points (see Fig. 10a and b). However,
loop do not vary when we add 7 methyl branches, but they are distributed with sharp peaks at the branching points (see Fig. 10a and b). However, ![[l with combining macron]](https://www.rsc.org/images/entities/i_char_006c_0304.gif) train and
train and ![[l with combining macron]](https://www.rsc.org/images/entities/i_char_006c_0304.gif) loop decrease when we add 13 methyl branches.
loop decrease when we add 13 methyl branches. ![[l with combining macron]](https://www.rsc.org/images/entities/i_char_006c_0304.gif) tail decreases independently of the number of branches because the number of loops and trains increases. In summary, we argue that the favorable bending of the polymer around branched points can lead to a wider product distribution since different segments of the polymer can adsorb on the surface and be susceptible to C–C scissions at different positions. This agrees with previous experimental work in which hydrocracking of different polyolefin feedstocks over Pt/WO3/ZrO2 mixed with HY zeolite resulted in a wider product distribution of PP compared to PE feedstocks.6
tail decreases independently of the number of branches because the number of loops and trains increases. In summary, we argue that the favorable bending of the polymer around branched points can lead to a wider product distribution since different segments of the polymer can adsorb on the surface and be susceptible to C–C scissions at different positions. This agrees with previous experimental work in which hydrocracking of different polyolefin feedstocks over Pt/WO3/ZrO2 mixed with HY zeolite resulted in a wider product distribution of PP compared to PE feedstocks.6
Fig. 11 displays the effect of the side chain length on the structural properties of the C71 PE melt over the Pt(111) surface. Introducing the methyl branches in the C71 backbone forms more trains (short or long; see Fig. 11a and e) and loops (short or long; see Fig. 11b and e), so thereby shorter tails (see Fig. 11d). Replacing methyl side chains with ethyl groups results in longer tails (new peak at ltail = 60 in Fig. 11c), shorter trains (larger peaks at ltrain = 9 and 18 in Fig. 11b), and hence longer loops (large peak at lloop = 25 in Fig. 11b). Increasing the side chain length from ethyl to propyl results in formation of more loops of shorter length (peaks shift to the left in Fig. 11b), more yet shorter trains (large peak at ltrain = 9 in Fig. 11a), and thereby fewer tails of shorter size (see Fig. 11d). In summary, the longer the side chain, the more the loops and trains, and the fewer the tails, whose lengths are determined by the interactions between the side chains and the polymer bulk at the interface with the adsorbed layer. However, the effect for the small side chains studied is slight.
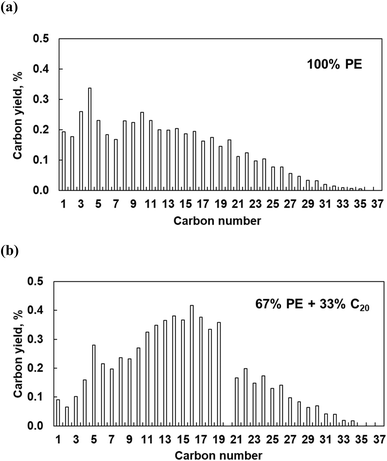
Experimental results on the effect of C20 in polyethylene decomposition over Pt
The polymer binding to the metal surface affects the C–C bond hydrogenolysis. To further elaborate on this point, we performed experiments with pure PE over Pt/Al2O3 catalysts at high Pt loading (6.4 wt%). This catalyst is active in PE hydrogenolysis, giving a broad distribution of liquid products and some light gases.10 High Pt loading ensures the formation of relatively large particles, making experimental results more relatable to the modeling. Pure PE converts to a broad distribution of C1–C35n-alkanes, at 16% conversion in 5 h (Fig. 12). The relatively high yields of light C1–C5 products are consistent with previous reports.10 When a mixture of PE and C20 reacts over Pt/Al2O3, the product distribution changes: the proportion of C1–C4 decreases while that of C11–C19 and of heavy C21+ increases. The conversion of PE and C20 reached 19 and 38%, respectively, from which we infer that additional C11–C19 products form via C–C bond breaking in C20 rather than in PE. Therefore, PE and C20 have comparable reactivities, each generating its own set of products, albeit with some overlap. This is consistent with the MD predictions that PE and the shorter molecules do not mutually exclude each other from the Pt surface, and that the PE/C20 ratio in the adsorbed layer is similar to that in the bulk.Interestingly, the addition of C20 reduces the yield of light gases. The latter probably originate from secondary hydrogenolysis of longer initial intermediates, as shown in recent work regarding ruthenium.8 C20 substitutes part of PE on the Pt surface, reducing secondary PE hydrogenolysis products. Indeed, this explanation agrees with experiments (Fig. 12) and the MD simulations, which show that C20 dramatically changes the conformation of adsorbed PE. According to the simulations (Fig. 6 and 7), short alkanes cause longer PE loops. Long trains appear to be a prerequisite for deep hydrogenolysis to C1–C4 products, while long loops and tails limit the reactivity to liquid C10+. This selectivity-altering approach is an intriguing way to generate more valuable (liquid) products from PE and avoid light gases.
Conclusions
In this work, we have employed replica-exchange molecular dynamics simulations to characterize the conformational spaces of C20, C26, C44, C71, and C142 pure melts and C142![[thin space (1/6-em)]](https://www.rsc.org/images/entities/char_2009.gif) :
:![[thin space (1/6-em)]](https://www.rsc.org/images/entities/char_2009.gif) C20 binary mixtures of varying concentrations at the interface with Pt(111) by the distributions of trains, loops, and tails and their first moments. Our analysis shows that the preponderance of short chains, in the range of 20 carbon atoms, lies entirely on the Pt surface as the enthalpic gains seem to outweigh the entropic gains associated with propagation of the chains in the direction normal to the surface. On the other hand, longer chains exhibit much broader distributions of all three conformational features. Remarkably, the average length of trains seems to be quite independent of the size of the alkane chain. Branching has a profound effect on the conformations of long chains at the interface as the favorable bending of the polymer around branched points at the surface results in train distributions that are less dispersed and more structured, and localized around short-trains, with the immediate implication of a wider carbon product distribution upon C–C bond cleavage. The degree of localization increases with the number and size of the side chains. Long chains can adsorb from the melt onto the Pt surface even in melt mixtures containing shorter polymer chains at high concentrations. This was further confirmed by experiments which showed comparable reactivity of PE and the C20 alkane. Computational results of a binary mixture of C142 and C20 with various concentrations reveal that both long and short chains can adsorb on the Pt catalyst surface for C–C scission even at high concentrations of the short chains. This observation is in line with the very high dispersity (Đ) of reaction products derived from PE over Pt/Al2O3 in prior work.10 Also, C20 addition alters the conformation of C142 on the surface, which in turn impacts reactivity. This agrees qualitatively with the formation of fewer light products (C1–C4 alkanes) when PE is mixed with C20 in the experiments, and may provide a new strategy to minimize light gases by minimizing the accessible catalyst sites. The interaction of the polymer with the surface also alters the train size, with weaker interactions leading to longer trains, and can similarly be leveraged to tune the product distribution. The quantitative relation between the structural properties of polymer chains on the surface and the experimental product distribution remains the subject of future work.
C20 binary mixtures of varying concentrations at the interface with Pt(111) by the distributions of trains, loops, and tails and their first moments. Our analysis shows that the preponderance of short chains, in the range of 20 carbon atoms, lies entirely on the Pt surface as the enthalpic gains seem to outweigh the entropic gains associated with propagation of the chains in the direction normal to the surface. On the other hand, longer chains exhibit much broader distributions of all three conformational features. Remarkably, the average length of trains seems to be quite independent of the size of the alkane chain. Branching has a profound effect on the conformations of long chains at the interface as the favorable bending of the polymer around branched points at the surface results in train distributions that are less dispersed and more structured, and localized around short-trains, with the immediate implication of a wider carbon product distribution upon C–C bond cleavage. The degree of localization increases with the number and size of the side chains. Long chains can adsorb from the melt onto the Pt surface even in melt mixtures containing shorter polymer chains at high concentrations. This was further confirmed by experiments which showed comparable reactivity of PE and the C20 alkane. Computational results of a binary mixture of C142 and C20 with various concentrations reveal that both long and short chains can adsorb on the Pt catalyst surface for C–C scission even at high concentrations of the short chains. This observation is in line with the very high dispersity (Đ) of reaction products derived from PE over Pt/Al2O3 in prior work.10 Also, C20 addition alters the conformation of C142 on the surface, which in turn impacts reactivity. This agrees qualitatively with the formation of fewer light products (C1–C4 alkanes) when PE is mixed with C20 in the experiments, and may provide a new strategy to minimize light gases by minimizing the accessible catalyst sites. The interaction of the polymer with the surface also alters the train size, with weaker interactions leading to longer trains, and can similarly be leveraged to tune the product distribution. The quantitative relation between the structural properties of polymer chains on the surface and the experimental product distribution remains the subject of future work.
Data availability
Datasets used for the analyses presented in this article are provided as ESI.†Author contributions
M. Z. performed all calculations and analysis. P. A. K. performed the experiments and associated analysis. S. C. and D. G. V. conceived the overall idea, supervised the project, and obtained the funding. The manuscript was written by M. Z. and S. C. with input from all the authors.Conflicts of interest
The authors declare no conflict of interests.Acknowledgements
This work was intellectually led and supported as part of the Center for Plastics Innovation, an Energy Frontier Research Center funded by the US Dept of Energy, Office of Science, Office of Basic Energy Sciences under Award Number DE-SC0021166. The code and data analysis were supported by Department of Energy's Office of Energy Efficiency and Renewable Energy and Advanced Manufacturing Office under Award Number DE-EE0007888-9.5. The Delaware Energy Institute gratefully acknowledges the support and partnership of the State of Delaware toward the RAPID projects.References
- M. Tsakona, E. Baker, I. Rucevska, T. Maes, L. R. Appelquist, M. Macmillan-Lawler, P. Harris, K. Raubenheimer, R. Langeard, H. Savelli-Soderberg, K. O. Woodall, J. Dittkrist, T. A. Zwimpfer, R. Aidis, C. Mafuta and T. Schoolmeester, Drowning in Plastics–Marine Litter and Plastic Waste Vital Graphics, United Nations Environment Programme, 2021 Search PubMed.
- R. Geyer, Plastic Waste and Recycling, ed. T. M. Letcher, Academic Press, 2020, DOI:10.1016/B978-0-12-817880-5.00002-5, pp. 13–32.
- N. Singh, D. Hui, R. Singh, I. P. S. Ahuja, L. Feo and F. Fraternali, Composites, Part B, 2017, 115, 409–422 CrossRef CAS.
- M. Solis and S. Silveira, Waste Manage., 2020, 105, 128–138 CrossRef CAS PubMed.
- T. Thiounn and R. C. Smith, J. Polym. Sci., 2020, 58, 1347–1364 CrossRef CAS.
- S. Liu, P. A. Kots, B. C. Vance, A. Danielson and D. G. Vlachos, Sci. Adv., 2021, 7, eabf8283 CrossRef CAS PubMed.
- P. A. Kots, S. Liu, B. C. Vance, C. Wang, J. D. Sheehan and D. G. Vlachos, ACS Catal., 2021, 11, 8104–8115 CrossRef CAS.
- C. Wang, T. Xie, P. A. Kots, B. C. Vance, K. Yu, P. Kumar, J. Fu, S. Liu, G. Tsilomelekis, E. A. Stach, W. Zheng and D. G. Vlachos, JACS Au, 2021, 1, 1422–1434 CrossRef CAS PubMed.
- A. Tennakoon, X. Wu, A. L. Paterson, S. Patnaik, Y. Pei, A. M. LaPointe, S. C. Ammal, R. A. Hackler, A. Heyden, I. I. Slowing, G. W. Coates, M. Delferro, B. Peters, W. Huang, A. D. Sadow and F. A. Perras, Nat. Catal., 2020, 3, 893–901 CrossRef CAS.
- G. Celik, R. M. Kennedy, R. A. Hackler, M. Ferrandon, A. Tennakoon, S. Patnaik, A. M. LaPointe, S. C. Ammal, A. Heyden, F. A. Perras, M. Pruski, S. L. Scott, K. R. Poeppelmeier, A. D. Sadow and M. Delferro, ACS Cent. Sci., 2019, 5, 1795–1803 CrossRef CAS PubMed.
- F. Zhang, M. Zeng, R. D. Yappert, J. Sun, Y.-H. Lee, A. M. LaPointe, B. Peters, M. M. Abu-Omar and S. L. Scott, Science, 2020, 370, 437–441 CrossRef CAS PubMed.
- B. C. Vance, P. A. Kots, C. Wang, Z. R. Hinton, C. M. Quinn, T. H. Epps, L. T. J. Korley and D. G. Vlachos, Appl. Catal., B, 2021, 299, 120483 CrossRef CAS.
- P. A. Kots, B. C. Vance and D. G. Vlachos, React. Chem. Eng., 2022, 7, 41–54 RSC.
- K. Hukushima and K. Nemoto, J. Phys. Soc. Jpn., 1996, 65, 1604–1608 CrossRef CAS.
- Y. Sugita and Y. Okamoto, Chem. Phys. Lett., 1999, 314, 141–151 CrossRef CAS.
- Y. Sugita, A. Kitao and Y. Okamoto, J. Chem. Phys., 2000, 113, 6042–6051 CrossRef CAS.
- D. J. Earl and M. W. Deem, Phys. Chem. Chem. Phys., 2005, 7, 3910–3916 RSC.
- M. R. Shirts and J. D. Chodera, J. Chem. Phys., 2008, 129, 124105 CrossRef PubMed.
- A. P. Thompson, H. M. Aktulga, R. Berger, D. S. Bolintineanu, W. M. Brown, P. S. Crozier, P. J. in 't Veld, A. Kohlmeyer, S. G. Moore, T. D. Nguyen, R. Shan, M. J. Stevens, J. Tranchida, C. Trott and S. J. Plimpton, Comput. Phys. Commun., 2022, 271, 108171 CrossRef CAS.
- G. T. Dee, T. Ougizawa and D. J. Walsh, Polymer, 1992, 33, 3462–3469 CrossRef CAS.
- K. C. Daoulas, V. A. Harmandaris and V. G. Mavrantzas, Macromolecules, 2005, 38, 5780–5795 CrossRef CAS.
- A. I. Jewett, D. Stelter, J. Lambert, S. M. Saladi, O. M. Roscioni, M. Ricci, L. Autin, M. Maritan, S. M. Bashusqeh, T. Keyes, R. T. Dame, J.-E. Shea, G. J. Jensen and D. S. Goodsell, J. Mol. Biol., 2021, 433, 166841 CrossRef CAS PubMed.
- W. L. Jorgensen and J. Tirado-Rives, J. Comput. Chem., 2005, 26, 1689–1700 CrossRef CAS PubMed.
- J. A. Rackers, Z. Wang, C. Lu, M. L. Laury, L. Lagardère, M. J. Schnieders, J.-P. Piquemal, P. Ren and J. W. Ponder, J. Chem. Theory Comput., 2018, 14, 5273–5289 CrossRef CAS PubMed.
- H. Heinz, R. A. Vaia, B. L. Farmer and R. R. Naik, J. Phys. Chem. C, 2008, 112, 17281–17290 CrossRef CAS.
- S. Nosé, J. Chem. Phys., 1984, 81, 511–519 CrossRef.
- W. G. Hoover, Phys. Rev. A, 1985, 31, 1695–1697 CrossRef PubMed.
- R. W. Hockney and J. W. Eastwood, Computer Simulation Using Particles, Adam Hilger, New York 1989 Search PubMed.
- A. Kone and D. A. Kofke, J. Chem. Phys., 2005, 122, 206101 CrossRef PubMed.
- N. Rathore, M. Chopra and J. J. d. Pablo, J. Chem. Phys., 2005, 122, 024111 CrossRef PubMed.
- A. N. Semenov, J. Bonet-Avalos, A. Johner and J. F. Joanny, Macromolecules, 1996, 29, 2179–2196 CrossRef CAS.
- C. A. J. Hoeve, E. A. DiMarzio and P. Peyser, J. Chem. Phys., 1965, 42, 2558–2563 CrossRef CAS.
- J. M. H. M. Scheutjens and G. J. Fleer, J. Phys. Chem., 1979, 83, 1619–1635 CrossRef CAS.
- G. J. Fleer, J. M. H. M. Scheutjens and M. A. C. Stuart, Colloids Surf., 1988, 31, 1–29 CrossRef CAS.
- A. Yethiraj, S. Kumar, A. Hariharan and K. S. Schweizer, J. Chem. Phys., 1994, 100, 4691–4694 CrossRef CAS.
- A. Yethiraj, Phys. Rev. Lett., 1995, 74, 2018–2021 CrossRef CAS PubMed.
- U. Steiner, J. Klein, E. Eiser, A. Budkowski and L. J. Fetters, Science, 1992, 258, 1126–1129 CrossRef CAS PubMed.
- M. Sikka, N. Singh, A. Karim, F. S. Bates, S. K. Satija and C. F. Majkrzak, Phys. Rev. Lett., 1993, 70, 307–310 CrossRef CAS PubMed.
Footnote |
† Electronic supplementary information (ESI) available: Time series of REMD of the C26 melt over Pt(111). Effects of Pt potential strength on structural properties of single chain alkanes and on density distributions. Number of chains and simulation boxes used, radius of gyration of the investigated PE melts in the bulk, replicas (temperatures) selected for REMD simulations, and acceptance probability of swaps. Effects of the Pt potential strength on ![[l with combining macron]](https://www.rsc.org/images/entities/i_char_006c_0304.gif) tr and carbon populations of the pure PE chains. See DOI: https://doi.org/10.1039/d2sc04772a tr and carbon populations of the pure PE chains. See DOI: https://doi.org/10.1039/d2sc04772a |
| This journal is © The Royal Society of Chemistry 2023 |


