DOI:
10.1039/D2LC01185A
(Paper)
Lab Chip, 2023,
23, 2411-2420
Measurement of cellular thermal properties and their temperature dependence based on frequency spectra via an on-chip-integrated microthermistor
Received
27th December 2022
, Accepted 15th February 2023
First published on 7th March 2023
Abstract
To understand the mechanism of intracellular thermal transport, thermal properties must be elucidated, particularly thermal conductivity and specific heat capacity. However, these properties have not been extensively studied. In this study, we developed a cellular temperature measurement device with a high temperature resolution of 1.17 m °C under wet conditions and with the ability to introduce intracellular local heating using a focused infrared laser to cultured cells on the device surface. Using this device, we evaluated the thermal properties of single cells based on their temperature signals and responses. Measurements were taken using on-chip-integrated microthermistors with high temperature resolution at varying surrounding temperatures and frequencies of local infrared irradiation on cells prepared on the sensors. Frequency spectra were used to determine the intensities of the temperature signals with respect to heating times. Signal intensities at 37 °C and a frequency lower than 2 Hz were larger than those at 25 °C, which were similar to those of water. The apparent thermal conductivity and specific heat capacity, which were determined at different surrounding temperatures and local heating frequencies, were lower than and similar to those of water at 37 °C and 25 °C, respectively. Our results indicate that the thermal properties of cells depend on both temperatures and physiological activities in addition to local heating frequencies.
Introduction
Temperature is an important physical parameter affecting living organisms, resulting in phenomena such as the body temperature returning to homeostasis to counteract unusual hot or cold external temperatures,1 fever during illnesses,2 and hot flashes experienced under social anxiety.3 Cells, the smallest systems that constitute a living organism, are also affected by temperature in a similar manner. Accordingly, studies have attempted to clarify certain mechanisms in living organisms through temperature measurements of single cells; however, most of them remain unexplained. The 105-gap issue is representative of these unexplained matters in intracellular thermal transport.4–7 In a previous study, the authors indicated a 105-order difference in temperature between the experimentally obtained and calculated values of heat production per cell based on the conventional heat conduction (eqn (4)). Some published reports proposed solutions to this issue. One such report stated that this gap can be explained by considering the heat production, the distance between the heat source and thermometer, and intracellular thermal properties,5 and another study approached the problem by determining the quantitative thermal conductivity. Furthermore, another study7 claimed that the conventional heat conduction equation should not be applied to intracellular thermal transport. Several intracellular thermal mechanisms, including the 105-gap issue, have not been satisfactorily studied and require further research.
Notably, since the introduction of fluorescent nanoparticle thermometers in early 2010, these measurement methods focusing on single cells have undergone significant developments.8–13 Fluorescent nanoparticle thermometers enable intracellular temperature mapping, with a spatial resolution of a few hundred nanometers. Thus far, using this approach, it has been ascertained that the temperature distributions in cells are nonuniform, temperatures of nuclei and mitochondria are slightly higher than those of other organelles, and certain proteins are expressed or activated under excessive heat.14–19 Moreover, the thermal conductivity of cells has also been determined.20–24 The performance of cellular temperature measurement methods can be characterized by temperature, time resolution, and spatial resolution. A fine spatial resolution offers detailed information on temperature distribution, and higher temperature and time resolutions contribute to the capture of small and short-term changes. Regarding fluorescent thermometers, the maximum temperature and time resolution that can be achieved are 10 m °C (with a time resolution of 4 s)25 and 50 ms (with a temperature resolution of 0.1 °C),26 respectively, although they are dependent on the nanoparticles used. These parameters are inversely related because the fluorescence properties are evaluated based on the accumulation of photons. Thermal conductivity can be determined using these optical methods. Sotoma et al. introduced diamond nanoparticle thermometers inside the cells and determined the thermal conductivity based on the spatial temperature distributions around the particle.23 Song et al. used transient microscopy imaging and demonstrated transient heat dispersions with a temporal resolution of 5 μs using intracellular-introduced photothermal gold nanoparticles.24 Elafandy et al. performed non-invasive measurements of cells on their surface based on the phenomenon of temperature dependence on photoluminescence using gallium nitride nanomembranes.21 The thermal conductivity of the cell reported in these studies is lower than that of water and has a variation of 0.1–0.6 W m−1 K−1 depending on the type of cell.
As an alternative to nanoparticle thermometers, temperature measurements of single cells using microfabricated sensors and lab-on-chip systems have been reported.27–30 Unlike the fluorescent nanoparticle method that measures intracellular temperatures, these microfabricated sensors measure the temperatures on cell surfaces. Notably, this approach offers high temperature and time resolutions in addition to the non-invasive measurement of cells. The fluorescent nanoparticle and microfabricated sensor methods have their advantages and disadvantages. For instance, introducing fluorescent nanoparticles confers less damage to the cells and, more importantly, enables clear visualization of the intracellular temperatures with a high spatial resolution. Moreover, extracellular non-invasive approaches enable the observation and measurement of cellular signals without requiring the introduction of chemical substances into the cells. Previous studies employed thermocouple arrays to detect the temperature of hydrogen peroxide decomposition in a single mouse hepatocyte27 and to chemically stimulate frog kidney cells.28 In another previous study, the authors measured intracellular temperatures by inserting a thermocouple nanoneedle into a cell.29,30 However, these studies applied fabricated sensors to well-known phenomena that had been observed in bulk measurements using cell suspensions and did not focus on the thermal properties of cells.
In our previous research, we successfully measured unique temperature signals from cells using mechanical and electrical on-chip devices. These signals have not been reported thus far through research involving conventional bulk measurements or fluorescent nanoparticle thermometers.31–34 Specifically, the temperature-dependent behaviours of brown fat cells were determined using a mechanical resonant thermal sensor, and the gradual but prolonged increase in temperature with respect to uncoupling responses was observed by adding the noradrenaline solution.31–33 Occasional pulsed increases in temperature without chemical stimulation were also noted. Furthermore, using microfabricated thermistors, we demonstrated that the temperature signals of single COS-7 cells under a steady state include a frequency spectrum with high intensity at frequencies lower than 4 Hz.34 This spectrum also exhibits temperature dependence; at a frequency lower than 4 Hz, high and low intensities were observed at 37 °C and 25 °C, respectively. A temperature signal with high temperature and time resolutions was measured using microfabricated sensors; these resolutions of the microfabricated thermistor were 2.1 m °C and <100 ms, respectively.34 Importantly, these cellular temperature measurements also detected the natural heat production of cells owing to the individual differences in heat production; this, however, makes it difficult to quantitatively evaluate the thermal properties of cells.
As mentioned above, several studies have been conducted to clarify the mechanism of intracellular thermal transport. However, the dependence between the temperature signals and the thermal properties of cells has not been thoroughly investigated. Specific heat capacity, which is an important parameter that relates thermal transport and thermal conductivity, requires further investigation. In this study, the thermal properties of single cells were evaluated using microfabricated thermistors integrated on-chip, which offer the advantages of highly sensitive temperature and time resolutions, under locally quantitative heating realized using an infrared (IR) laser. To this end, we microfabricated vanadium dioxide (VO2) thermistors and cultured the COS-7 cells on them; thereafter, we monitored the thermal responses of the cells under varying surrounding temperatures and modulation frequencies of IR laser irradiation. We also reported on the thermal conductivity and specific heat capacity of cells, including their temperature dependence.
Experimental device and methods
Temperature measurement device and measurement setup
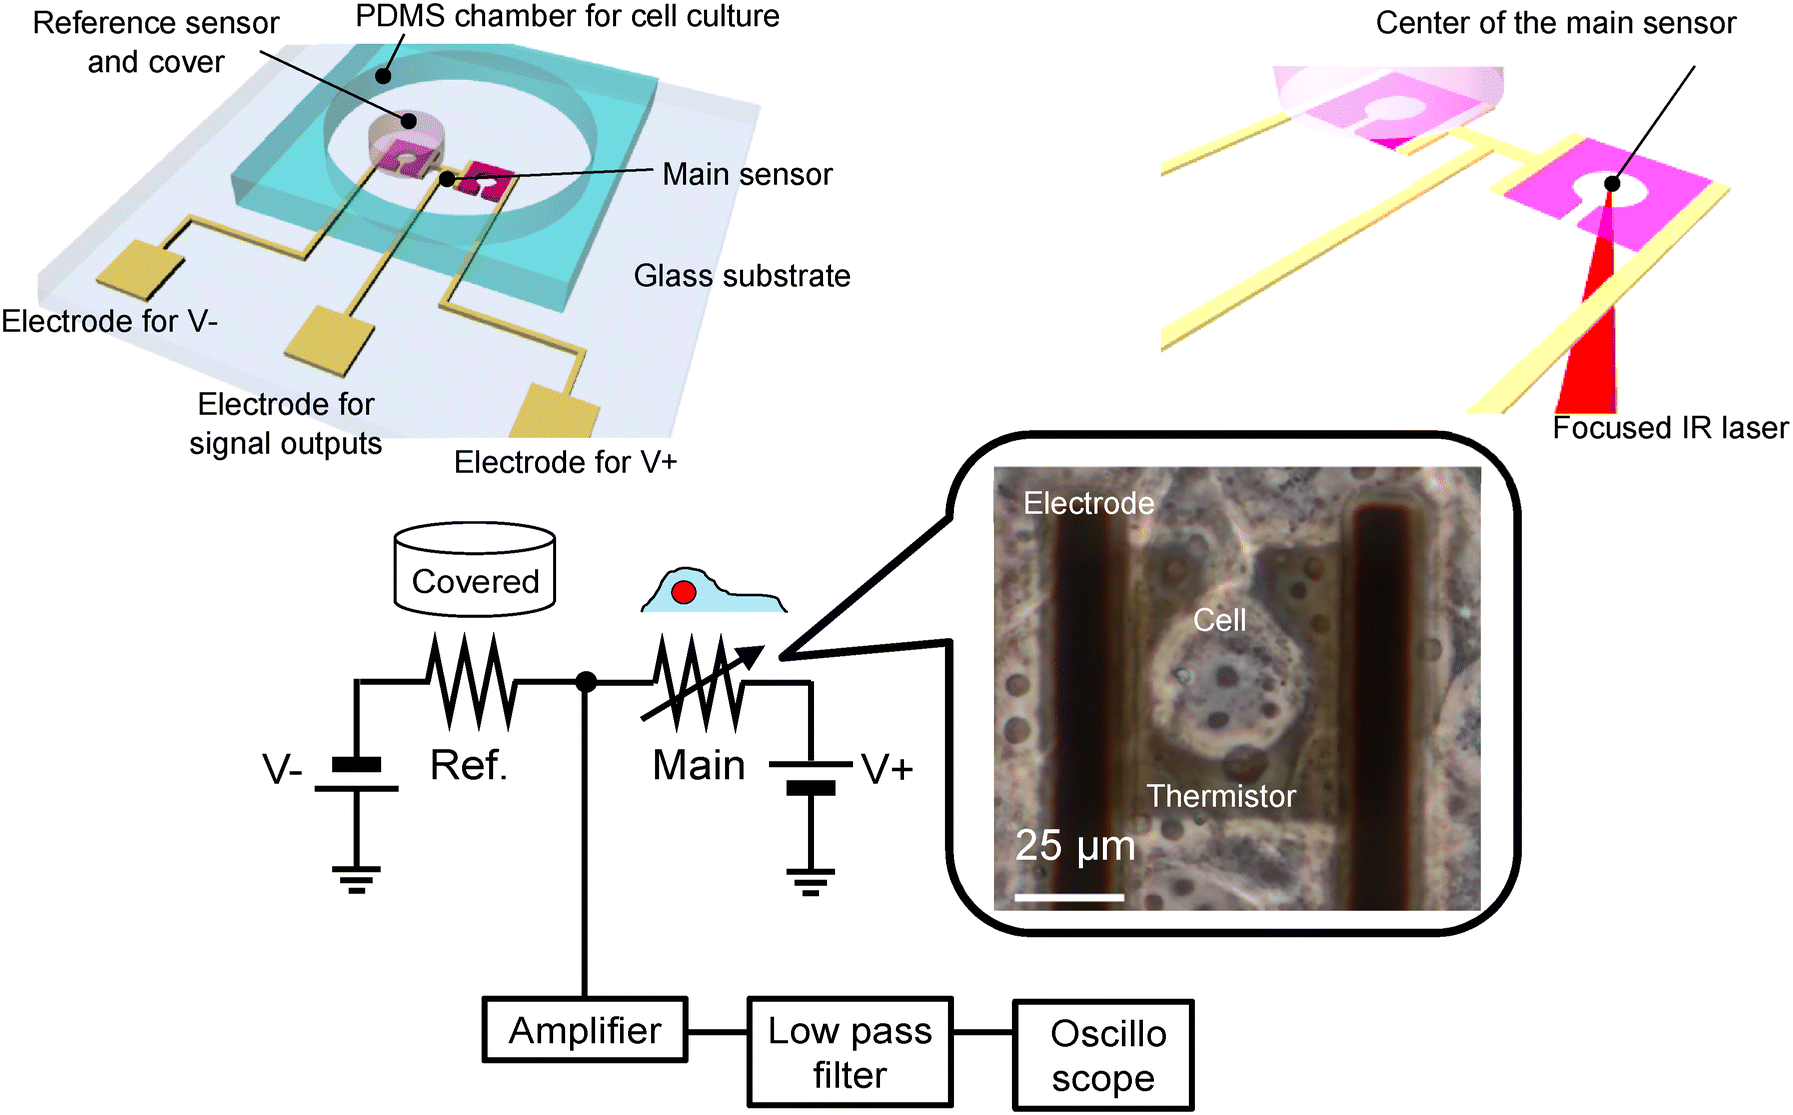
Fig. 1 shows a schematic of the device and experimental setup. The advantages of our device include high temperature resolution, ability to culture cell on the surface of the device, and ability to introduce intracellular local heating using a focused IR laser. In particular, this intracellular local heating is effective to determine the thermal properties of cells, while it has not been achieved on conventional microfabricated on-chip devices. On-chip-integrated microthermistors, comprising thin films made of VO2, were fabricated on quartz wafers. Cell culturing on sensor-integrated chips ensures effective adhesion on the surface of the device, whereas mounting external sensors on cultured cells entails problems pertaining to insufficient contact.21 The thermistors featured dimensions of 50 × 50 μm2, accounting for the size of a single COS-7 cell; the centres of these thermistors were hollowed out with a keyhole to enable irradiation with the IR laser. The temperature coefficient of resistance (TCR) was 2.0% °C−1,30 which was considerably larger than that of conventional materials such as platinum (0.8% °C−1).35 Reference sensors, which were paired with the main sensors, were covered with a photosensitive polymer to prevent the cells from mounting on them. The outputs of the main sensors varied with respect to the changes in the temperatures of the cells. The differential signals between the main and reference sensor outputs were used to eliminate environmental noise (Fig. 1). Furthermore, COS-7 cells were cultured on wafers. We measured the temperature of the cells positioned over the main sensors. The surrounding temperature of cells was changed using a feedback-controlled Peltier device attached under the fabricated device. Additionally, the cells were locally heated via a focused IR laser.
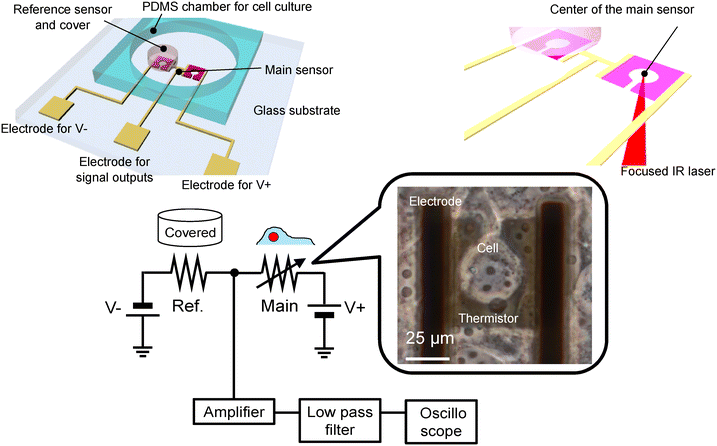 |
| | Fig. 1 Schematic of the device and experimental setup; a cell positioned on the microfabricated thermistor. | |
Device preparation and characterization
A VO2 film with a thickness of 100 nm was deposited on a quart substrate (30 × 30 mm) via the sol–gel method reported in a previous study.34 We mixed 92 g vanadyl oxalate n-hydrate (VOC2O4·nH2O) and 100 ml ethyl alcohol (0.5 mol L−1) at 150 °C for 300 min. After cooling, the material was spin-coated on the wafer at 1000 rpm for 20 s and dried at 200 °C for 10 min on a hot plate. We repeated the spin-coating and drying process three times and obtained a thickness of 100 nm. The prepared film was baked at 500 °C in steps of 265 °C per hour in a nitrogen atmosphere under 350 sccm (FT-02VAC-50, FULL-TECH CO., LTD). The film was then annealed at 600 °C for 3 min in a 0.2 sccm oxygen atmosphere after evacuating to 1.4 Pa. The VO2 film was patterned using a photoresist mask and H2O2 wet etching. Thereafter, the electrodes and pads (Ti: 200 nm and Au: 20 nm) were formed using the lift-off process. A SiO2 layer with a thickness of 200 nm was deposited over the entire surface using P-TEOS CVD. The SiO2 area on the electrical pads was opened using wet etching. A photosensitive polymer (thickness: 50 μm; SU-83050, Nippon Kayaku Co., LTD.) was patterned on the reference sensors. The chamber was composed of a polydimethylsiloxane (PDMS) block (with approximate dimensions of 13 × 13 × 5 mm3). A through hole with a diameter of 8 mm was established. Subsequently, the PDMS chambers and wafer were bonded. The resistance change of the fabricated VO2 thermistor was evaluated by changing the temperature of the device. The measurements were conducted using the two-terminal method with a source meter (Model 2410, Keithley Instruments). The resistivity decreased as the temperature increased, and the metal–insulation transition was observed after 50 °C (Fig. 3(a)). The temperature coefficient of the thermistor was 3.9% °C−1 in the temperature range of 20–45 °C. This fabrication process was similar to that described in a previous study.34
We conducted a theoretical simulation of the frequency response of our fabricated device using the finite element method software (COMSOL Multiphysics 6.0, COMSOL. Inc.). The simulation was based on the dimensions of our fabricated device and considered a water layer of 5 μm thickness on the sensor and wafer. The results were obtained for three different frequencies (0.25, 0.60, and 1.0 Hz) at a constant surrounding temperature of 37 °C, as well as three different surrounding temperatures (25, 37, and 45 °C) at a constant frequency of 0.60 Hz. The heat source was represented by a flat cylinder (3.0 × 1.0 μm) 2.0 μm above the centre of the sensor; further, a square wave with the target frequencies was applied on the sensor, imitating the laser spot with an input power of 0.3 mW to produce an observable temperature increase on the sensor. The set parameters and surface conditions included a heat quantity of 9 × 10¹³ W m−3, a substrate surface temperature of 37 °C, and a water surface with a heat transfer coefficient of 1000 W m−2 K−1 on convective heat flux. The average temperature of the sensor part was calculated in the time domain, and the frequency spectra were obtained by transforming the temperature change into a frequency domain signal. The material properties of SiO2, VO2, Ti, and water (including density, thermal conductivity, and specific heat capacity) were determined to be (2200 kg m−3, 1.4 W m−1 K−1, 0.73 J g−1 K−1), (3357 kg m−3, 5.8 W m−1 K−1, 0.58 J g−1 K−1),36 (4506 kg m−3, 21.9 W m−1 K−1, 0.52 J g−1 K−1), and (1000 kg m−3, 0.61 W m−1 K−1, 0.42 J g−1 K−1), respectively. The results shown in Fig. 2 indicate that the temperature increments of the sensor did not show a significant difference under different conditions, implying that the device itself has no frequency dependence.
 |
| | Fig. 2 The frequency dependence of theoretical device characteristics is shown through: (a) cross-section schematics of the simulation, (b) frequency spectra at 37 °C for each input frequency, and (c) the constant frequency of 0.60 Hz at a temperature of 25 °C and (d) 45 °C. | |
Measurements
Positive (V+) and negative (V−) voltages were applied to the main and reference sensors, respectively, and an output voltage was obtained between the sensors. The applied voltages were adjusted to ensure that the output voltage was approximately 0 at the initial setting. This output voltage varied depending on the change in the resistance of the main sensor under temperature variations. The output signal was amplified 100 times (CA-271F4, NF Corporation) and filtered using a low-pass filter of 10 Hz (FV-628B, NF Corporation). The monitored signal was then converted into a frequency-domain signal via the fast Fourier transform. The maximum noise level under wet conditions was 84.0 μV under DC (Fig. 3(b)).
 |
| | Fig. 3 Characterization of the fabricated device: temperature coefficient of resistance of the fabricated VO2 thermistor (a) and noise level of the device (b). | |
The temperature resolution was determined based on the noise level without any input to the main sensor, as expressed below:
where
Rs (2.14 MΩ) and
RR (2.00 MΩ),
Vsup (0.0737 V), TCR (3.90%), Δ
T, and
α represent the resistances of the main and reference sensors, total applied voltage (
V+ −
V−), the absolute value of the TCR, temperature change, and resistance ratio of the main and reference sensors, respectively. The temperature resolution of the fabricated device was then calculated to be 1.17 m °C. The experimentally obtained voltage signals (
Vsignals) were similarly transformed into temperature changes by changing
Vnoise to
Vsignals in the equation.
Laser irradiation
An IR laser was employed to irradiate the cells via an objective lens with IR-LEGO (SIGMAKOKI Co., LTD; wavelength: 1480 nm). The output power of the laser was adjusted to 1 mW, which decreased to 0.1 mW as the laser rays passed through the objective lens. The laser irradiation time was controlled using an optical chopper. The duty cycle was 1![[thin space (1/6-em)]](https://www.rsc.org/images/entities/char_2009.gif) :1.
:1.
Experiments and results
Spontaneous thermogenesis signals of COS-7 cells under a steady state without external thermal stimulation
The aim of measurement was to monitor a cell culture that was occasionally pointed on the thermistor. The cells were grown in a densely populated manner on the substrate. The temperature of the cell was detected solely via the thermistor with a hole at the centre. At surrounding temperatures of 25, 37, and 45 °C, temperature signals were measured using the fabricated device. As shown in the upper row of Fig. 4(a)–(c), the peak-to-peak temperature fluctuations in the time domain were 0.4, 1.5, and 0.2 °C at surrounding temperatures of 25, 37, and 45 °C, respectively. Fig. 4(d) presents the results without the cells at 37 °C. At 37 °C, the fluctuations on the sensors without the cells were extremely small, amounting to 0.03 °C. This implies that the signals obtained from the cell-mounted sensors were derived from the cells. Consequently, these time-domain signals were converted into frequency-domain signals via the fast Fourier transform. In particular, the intensities at frequencies lower than 4 Hz were larger than those at other frequencies; this was evident at 37 °C. Specifically, the temperature fluctuation and intensity in the frequency spectrum were the largest at 37 °C, indicating high activity, whereas those at 25 °C and 45 °C were almost similar, suggesting limited activity. As aforedescribed, fluctuations in the temperatures of cells were mainly dependent on the surrounding temperature. Additionally, the frequency spectra of the temperature signals showed large intensities at frequencies in the range lower than 4 Hz. Our findings on the repeatability of measurement results in the spontaneous thermogenesis of COS-7 cells align with the results that were previously reported and discussed in our earlier work.34 We are delighted to demonstrate the repeatability of our measurement results.
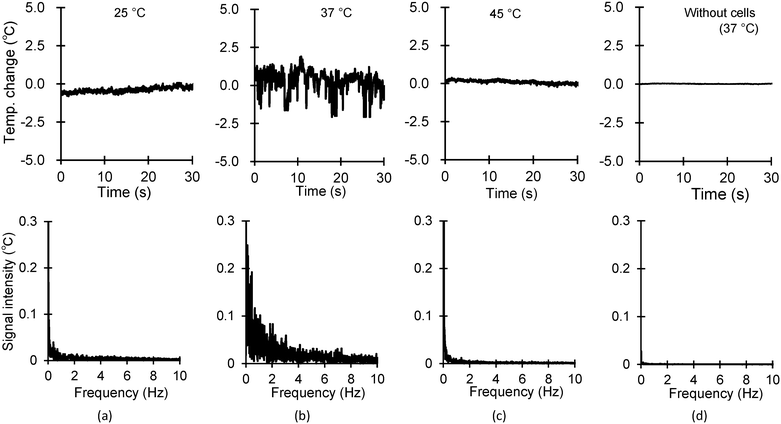 |
| | Fig. 4 Time- and frequency-domain signals of spontaneous thermogenesis from cells at varying ambient temperatures without external heating (top: time domain and bottom: frequency domain). The ambient temperature was set as (a) 25 °C, (b) 37 °C, and (c) 45 °C. (d) The results without the cell on the sensor at 37 °C. | |
Temperature signals of COS-7 cells with external heating
Subsequently, we measured the increase in the temperature of cells and evaluated the thermal responses by changing the local heating cycles along with the frequency modulation of the IR laser. The IR laser rays were focused on the centre of the hole in the thermistor, which heated the cell inside. The temperature of the cell was detected solely via the thermistor around the IR-irradiated point, as shown in Fig. 1. The modulation frequency of the IR laser was increased from 0.25 Hz to 7.0 Hz, with increments of 0.25 Hz. The duty ratio was set as 1:1, ensuring that the on/off times of local heating were identical in a cycle. The changes in the temperatures of the cells were measured at surrounding temperatures of 25 °C and 37 °C. Additionally, temperature fluctuations of water at 37 °C were considered as a reference for comparison. The time-domain signals obtained were converted into frequency-domain signals, and the signal intensities at modulated frequencies are plotted in Fig. 5(d)–(f). Fig. 5(a)–(f) show measurement examples of the following: (a) and (d) show the cell at 25 °C with 0.25 Hz, (b) and (e) show the cell at 37 °C with 3.0 Hz, and (c) and (f) show the water at 37 °C with 5.0 Hz. The signal intensities (which, in this case, indicate the changes in temperature) of the cells were higher at lower frequencies, linearly decreasing up to 2 Hz and remaining almost constant above 2 Hz at the surrounding temperatures of 25 and 37 °C. Furthermore, the signal intensity at 37 °C was higher than that at 25 °C at frequencies in the range lower than 2 Hz. A lower modulation frequency corresponded to a longer heating time. The signal intensities of water were almost constant at approximately 2 °C in the measured frequency range.
 |
| | Fig. 5 Variation in temperature changes and signal intensities of the cells in the time and frequency domains with the surrounding temperature and laser irradiation frequency. (a) Measured temperature change in the cell under local irradiation using the IR laser with 0.25 Hz at 25 °C, (b) with 3.0 Hz at 37 °C, and (c) that of water with 5.0 Hz at 37 °C. (d) Frequency spectrum of the signal intensity of the cell under local irradiation with the IR laser at 0.25 Hz, (e) 3.0 Hz, and (f) that of water at 5.0 Hz. Signal intensity for each modulated frequency of the cell at a temperature of (g) 25 °C, (h) 37 °C and (i) those of water at a temperature of 37 °C. | |
The saturated temperature, with an increase in the irradiation time, was obtained. Fig. 6 shows an increase in the temperature signal through IR laser irradiation to heat the subjected cell as a measurement example at a surrounding temperature of 37 °C and modulation frequency of 0.25 Hz. Here, the time constant is defined as the time required for the cells to reach 63.2% of the saturated temperature. The increase in the saturated temperature and time constant at surrounding temperatures of 25 and 37 °C with 0.25, 0.60, and 3.0 Hz, and 45 °C at frequencies of 0.6 and 3.0 Hz are summarized in Table 1. The temperature increase did not saturate at a frequency of 5.0 Hz (Fig. 6(d)); hence, this frequency was eliminated from the thermal response results.
 |
| | Fig. 6 Measured temperature changes of the cells irradiated using the IR laser. (a) Measured temperature change in the cell at a surrounding temperature of 37 °C under local irradiation with the IR laser at 0.25 Hz and the enlarged image with the IR laser turned on. (b) Temperature changes for each modulated frequency of the cell at 25 °C with 0.6 Hz, (c) 37 °C with 3.0 Hz, and (d) 37 °C with 5.0 Hz. | |
Table 1 Experimentally obtained saturated temperature and time constant at each temperature and laser input frequency
|
|
Temp. |
25 °C |
37 °C |
45 °C |
|
|
Frequency (Hz) |
0.25 |
0.60 |
3.0 |
0.25 |
0.60 |
3.0 |
0.60 |
3.0 |
| Cell |
Saturated temp. (°C) |
3.52 |
2.56 |
3.02 |
4.73 |
5.90 |
5.00 |
3.02 |
2.89 |
| Deviation (°C) |
0.30 |
0.2 |
0.30 |
0.35 |
0.31 |
0.30 |
0.16 |
0.24 |
| Time constant (ms) |
63 |
57 |
48 |
58 |
51 |
44 |
49 |
47 |
| Deviation (ms) |
13 |
10 |
4.9 |
10 |
7.8 |
3.6 |
5.1 |
4.4 |
| Water |
Saturated temp. (°C) |
3.39 |
2.71 |
3.28 |
3.35 |
3.55 |
4.43 |
4.09 |
4.00 |
| Deviation (°C) |
0.31 |
0.50 |
0.14 |
0.36 |
0.61 |
0.30 |
0.15 |
0.16 |
| Time constant (ms) |
61 |
59 |
50 |
60 |
59 |
47 |
60 |
58 |
| Deviation (ms) |
10 |
13 |
29 |
7.6 |
6.7 |
4.0 |
3.4 |
3.5 |
The thermal conductivity and specific heat capacity were calculated based on the increase in the saturated temperature and time constants. The definition for thermal conductivity α can be expressed as
| |  | (1) |
where
W,
L, Δ
T, and
A denote the input heat, length of the heat propagation path, temperature difference between the input and output along the path, and cross-sectional area, respectively. The thermal conductivities of the cell and water can be expressed as follows:
| |  | (2) |
| |  | (3) |
For the experiments conducted in this study,
W,
L, and
A are approximately equal because the dimensions of the sensor and experimental system were similar; thus, we obtained the following:
| |  | (4) |
The thermal resistance of an object can be expressed, as shown in
eqn (5), considering the definition of thermal conductivity as
| |  | (5) |
Similarly, the heat capacitance of an object can be expressed, as in
eqn (6), based on the definition of specific heat capacity as
| | | C(J K−1) = cp(J g−1 K−1)·ρ(g m−3)·V(m3). | (6) |
Here,
Cp,
ρ, and
V denote the specific heat capacity, density, and volume of the material, respectively. The time constant, which was experimentally obtained by periodic local heating
via IR laser irradiation, can be expressed as follows:
| | | τ(s) = R(K W−1)·C(J K−1). | (7) |
The ratio of time constants for the cell and water is given as,
| |  | (8) |
Thereafter, assuming that the densities of the cell and water are the same (
i.e.,
ρcell =
ρwater), we obtained
| |  | (9) |
It is important to note that the density of cells and water has a 4% difference;
37 however, in this study, we assumed that they are the same. This assumption could impact the accuracy of the measurement results. Furthermore, the thermal conductivity and specific heat capacity can be calculated by substituting the experimental results with the temperature changes and time constants of the cell and water as well as the thermal properties (thermal conductivity: 0.61 W m
−1 K
−1 and specific heat capacity: 4.217 J g
−1 K
−1) in
eqn (8).
Fig. 7 shows the obtained thermal conductivities and heat capacities at each temperature and heating frequency. At a surrounding temperature of 25 °C, the spontaneous thermogenesis signals and responses were limited, and the thermal conductivity and specific heat capacity ranged from 0.61–0.66 W m
−1 K
−1 and 4.5–4.6 J g
−1 K
−1, respectively, which were almost identical to those of water. Of note, these thermal properties were calculated under the assumption that the entire input heat was diffused within the cell
via thermal conduction. At a temperature of 37 °C with large spontaneous thermogenesis responses, the thermal conductivities and specific heat capacities obtained under the aforementioned assumption (referred to as apparent thermal properties) were 0.45, 0.37, and 0.55 W m
−1 K
−1 and 2.92, 2.21, and 3.6 J g
−1 K
−1 with 0.25, 0.6, and 3.0 Hz, respectively. At a temperature of 45 °C, the values of 0.81–0.82 W m
−1 K
−1 and 0.43–0.45 J g
−1 K
−1 were obtained.
 |
| | Fig. 7 Variation of thermal properties of the cells with the surrounding temperature and laser irradiation frequency: (a) apparent thermal conductivities at each temperature and laser input frequency and (b) heat capacities at each temperature and local heating frequency. | |
Discussion
In this study, we measured the temperature signals of cells with and without external local heating. Subsequently, the frequency spectra of the signals and their temperature dependence were determined.
First, we acknowledge the measurement errors in our experiments. The main cause is the influence of the culture medium that surrounds and is in between the cell and sensor. The cells were cultured densely on the device surface, which means that the sensors were not directly exposed to the medium. The distance between the cells and substrate is reported to be 100 nm,38,39 while the average height of the cells is approximately 3 μm.40–42 The thickness rate in volume of the cell and water layers can result in an error of 3% in our measurements. Considering the differences in height and adhesion conditions of each cell, the actual error range could be conceivable. The apparent thermal properties we reported here also consider the effect of the cell membrane and the interface between the cell and the surrounding water.
The modulation frequency under local heating corresponded with the duration of local heating, and the signal intensities depended on the frequency. In particular, stronger signals were observed in a frequency range lower than 2 Hz at 37 °C, whereas that of water is almost constant at any given frequency, as shown in Fig. 5. These results indicate that the heat propagation is dependent on frequency, which is a different result from that of water. The researchers assume that the unique effects of periodic local heating on different physiological temperatures in the whole cell have an important role in cell functions; however, a method for examining the intracellular phenomena that occur is required. The differences in the thermal conductivity and specific heat capacity at each surrounding temperature and heating frequency were clearly observed. The apparent thermal conductivity at 37 °C was lower than that of water. Similar results for thermal conductivity (0.1–0.6 W m−1 K−1) have been reported using several types of cells.21–24 At 25 °C, both these thermal properties and the frequency spectrum of the cell were similar to those of water at each frequency. Considering these results, we conclude that the thermal properties of cells do not differ significantly from those of water. Previous studies have reported the thermal conductivity of dead cells to be approximately 0.6 W m−1 K−1.24,43 This value is similar to that of water and to our results at 25 °C. However, the mechanism leading to this thermal conductivity in both the inactivated cells at 25 °C and dead cells are likely different as cells do not die at 25 °C. This suggests that the cellular conditions related to low physiological activity can be obtained without chemical fixing, which accompanies cellular denaturation, by decreasing the temperature. Nevertheless, it is assumed that, at 37 °C, certain functions of cells are initiated, and some intracellular reactions are activated. Additionally, the frequency dependence of the apparent thermal properties possibly shows the frequency of the activated reactions. The spontaneous thermogenesis signal under a steady state is considerably larger at 37 °C than that at other temperatures. Periodic external heating induces reactions, and the thermal fluxes inside the cells are somehow disturbed resulting in smaller thermal conductivity and heat capacities. Previously reported thermal conductivities,44–47 which were lower than those of water, were likely influenced by the heat balance and responses related to the cell's activity. It is possible that the spontaneous thermogenesis signals at the physiological temperature of 37 °C were induced by the cell's functions and that the intracellular heat flow was disturbed by interactions, such as protein denaturation or other biochemical reactions along the path of heat propagation. These results possibly aid in clarifying the 105-gap issue by highlighting the spontaneous thermogenesis changes of cells via simple thermal conduction.4–7 At 45 °C, a larger thermal conductivity was measured at approximately 0.8 W m−1 K−1. Song et al. have reported similar results of large thermal conductivity at high temperatures through the pulsed heating of cells.24 At this non-physiological temperature, cellular activity is reduced and protective mechanisms are likely to be triggered. The larger thermal conductivity contributes to the heat dispersion and cooling of the cell. This is reasonable, considering that a temperature greater than 37 °C would damage the cells and fast cooling is required.
Specific heat capacities generally increase with the atomic and molecular weights or as the molecular structure and degrees of freedom become more complicated, owing to the increase in the amount of energy that can be stored.48,49 Cells contain not only water but also several types of proteins at varying amounts; they are, therefore, expected to exhibit heat capacities exceeding those of water owing to their hydrogen bonds and proteins with complicated structures. However, in this study, the heat capacity determined via experiments was lower than that of water at 37 °C. These results correspond to those reported in previous studies on the specific heat capacities of human and animal tissues.44–47 Notably, this low heat capacity indicates that energy storage and release are convenient. Fast energy conversion is advantageous for cells because they are continuously involved in biochemical reactions. The specific heat capacities of general proteins and lipids are approximately a third of that of water,50 while that of certain lipids such as DMPC, which is one of the representative lipids, is 125 J kg−1 at 25 °C.51 Despite the lower heat capacities of most cell components, the presence of some components with higher values could result in a specific heat capacity for cells similar to that of water at 25 °C. Furthermore, the heat capacity of cells at 45 °C was similar to that of water, whereas the thermal conductivity increased remarkably. At 37 °C, both thermal properties varied from those of water. We assumed that this was because the periodic local heating induced an intracellular reaction related to the disturbance of intracellular heat fluxes. The intracellular heat dispersion process that occurred at 45 °C was different from the heat generation process that occurred at 37 °C, likely because the heat capacity was the same as that of water. However, this study could not clarify why the heat capacity of the cells was lower than that of water. To clarify this, another method to evaluate the alterations in intracellular materials, among other functionalities, is required. Nevertheless, the results of this study indicate that the cells feature unique thermal characteristics that do not conform to the laws of conventional thermal engineering. It is remarkable that the frequency spectrum of spontaneous thermogenesis responses from the cells corresponds to those of periodic external heating. This possibly indicates that the unique frequency-related signals were caused by the thermal functions of cells and shows the time scales of intracellular reactions.
Conclusions
In summary, we evaluated the temperature signals of cells using a microfabricated thermistor under varying local heating times in addition to surrounding temperatures, in contrast to previous studies, which have primarily focused on the surrounding temperature. The frequency responses of the cells varied depending on the surrounding temperatures; high signal intensities were noted at lower modulation frequencies (local heating times) at 37 °C, and the spectra were similar to those of water at 25 °C. Furthermore, we quantitively evaluated the thermal conductivity and, for the first time, the specific heat capacity of the cells. The apparent thermal conductivity and specific heat capacity were similar to those of water at 25 °C, and both values decreased with the increasing dependence of local heating frequency at 37 °C; only the thermal conductivity increased at 45 °C. The dependence of surrounding temperature and local heating frequency possibly shows that the thermal properties are similar to those of water and reflects the influences of intracellular reactions at each temperature, such as for metabolic heat generation at 37 °C and protective mechanisms at 45 °C.
Author contributions
Conceptualization and methodology, N. I.; investigation, N. I. and T. M.; data analysis, N. I., T. M., and K. O.; writing, N. I., K. O. and T. O.; funding acquisition, N. I.; supervision, N. I. and T. O.
Conflicts of interest
The authors declare no competing interests.
Acknowledgements
Part of this work was performed in the Micro/Nano machining Research Education Center (MNC) of Tohoku University. This work was partly supported by JSPS KAKENHI JP20H02588.
References
- C. L. Tan and Z. A. Knight, Neuron, 2018, 98, 31–48 CrossRef CAS PubMed.
- J. Roth,
et al.
, Neurol. Clin., 2006, 24, 421–439 CrossRef PubMed.
- N. Kataoka,
et al.
, Science, 2020, 367, 1105–1112 CrossRef CAS PubMed.
- G. Baffou,
et al.
, Nat. Methods, 2011, 11, 899–901 CrossRef PubMed.
- M. Suzuki,
et al.
, Nat. Methods, 2015, 12, 802–803 CrossRef CAS PubMed.
- S. Uchiyama,
et al.
, Chem. Commun., 2017, 53, 10976–10992 RSC.
- K. Okabe and S. Uchiyama, Commun. Biol., 2021, 4, 1377 CrossRef CAS PubMed.
- J. M. Yang,
et al.
, ACS Nano, 2011, 5, 5067–5071 CrossRef CAS PubMed.
- K. Okabe,
et al.
, Nat. Commun., 2012, 3, 705 CrossRef PubMed.
- G. Kucsko,
et al.
, Nature, 2013, 500, 54–58 CrossRef CAS PubMed.
- T. Bai and N. Gu, Small, 2016, 12, 4590–4610 CrossRef CAS PubMed.
- M. Nakano and T. Nagai, J. Photochem. Photobiol., C, 2017, 30, 2–9 CrossRef CAS.
- K. Okabe,
et al.
, Pflugers Arch., 2018, 470, 717–731 CrossRef CAS PubMed.
- N. L. Kedersha,
et al.
, J. Cell Biol., 1999, 147, 1431–1442 CrossRef CAS PubMed.
- Y. Kamei,
et al.
, Nat. Methods, 2009, 6, 79–81 CrossRef CAS PubMed.
- K. Richter,
et al.
, Mol. Cell, 2010, 40, 253–266 CrossRef CAS PubMed.
- M. Preußner,
et al.
, Mol. Cell, 2017, 67, 433–446.e4 CrossRef PubMed.
- K. Castillo,
et al.
, Phys. Biol., 2018, 15, 021001 CrossRef PubMed.
- S. M. Hirsch,
et al.
, Nat. Methods, 2018, 15, 921–923 CrossRef CAS PubMed.
- B. Kyoo Park,
et al.
, Appl. Phys. Lett., 2013, 102, 203702 CrossRef.
- R. T. Elafandy,
et al.
, Small, 2017, 13, 1603080 CrossRef PubMed.
- A. R. N. Bastos,
et al.
, Adv. Funct. Mater., 2019, 29, 1905474 CrossRef CAS.
- S. Sotoma,
et al.
, Sci. Adv., 2021, 7, eabd7888 CrossRef CAS PubMed.
- P. Song,
et al.
, Chem, 2021, 7, 1569–1587 CAS.
- S. Uchiyama,
et al.
, Analyst, 2015, 140, 4498–4506 RSC.
- M. Nakano,
et al.
, PLoS One, 2017, 12, e0172344 CrossRef PubMed.
- E. A. Johannessen,
et al.
, Appl. Phys. Lett., 2002, 80, 2029–2031 CrossRef CAS.
- K. Verhaegen,
et al.
, Sens. Actuators, A, 2000, 82, 186–190 CrossRef CAS.
- V. Zeeb,
et al.
, J. Neurosci. Methods, 2004, 139, 69–77 CrossRef PubMed.
- C. Wang,
et al.
, Cell Res., 2011, 21, 1517–1519 CrossRef PubMed.
- N. Inomata,
et al.
, Appl. Phys. Lett., 2012, 100, 154104 CrossRef.
- T. Yamada,
et al.
, Jpn. J. Appl. Phys., 2016, 55, 027001 CrossRef.
- N. Inomata,
et al.
, Lab Chip, 2016, 16, 3597–3603 RSC.
- N. Inomata,
et al.
, Sens. Bio-Sens. Res., 2020, 27, 100309 CrossRef.
-
R. A. Serway, Principles of Physics, Saunders College Publishing, Philadelphia, 1998 Search PubMed.
- N. Inomata,
et al.
, Jpn. J. Appl. Phys., 2016, 55, 037201 CrossRef.
- M. Takeuchi,
et al.
, J. Phys. Chem. Lett., 2017, 8, 5241–5245 CrossRef CAS PubMed.
- P. Böhm,
et al.
, Langmuir, 2019, 35, 513–521 CrossRef PubMed.
- D. E. Arawi,
et al.
, Biophys. Rep., 2021, 1, 1000021 Search PubMed.
- P. D. Antonio,
et al.
, Biochim. Biophys. Acta, 2012, 1818, 3141–3148 CrossRef PubMed.
- Y. Fang,
et al.
, Sci. Rep., 2014, 4, 7074 CrossRef PubMed.
- M. Cascione,
et al.
, Microsc. Res. Tech., 2017, 80, 109–123 CrossRef PubMed.
- B. K. Park,
et al.
, Appl. Phys. Lett., 2013, 102, 203702 CrossRef.
- K. Giering,
et al.
, Thermochim. Acta, 1995, 251, 199–205 CrossRef CAS.
- B. Byeon,
et al.
, Biocatal. Agric. Biotechnol., 2018, 14, 338–356 CrossRef.
- K. Giering,
et al.
, Proc. SPIE, 1996, 2624, 188–197 CrossRef.
- K. Giering,
et al.
, Proc. SPIE, 1995, 45–65 Search PubMed.
- A. Einstein, Ann. Phys., 1907, 22, 180–190 CrossRef.
- P. Debye, Ann. Phys., 1912, 344, 789–839 CrossRef.
- J. Gómez,
et al.
, Proteins, 1995, 22, 404–412 CrossRef PubMed.
- P. Losada-Pérez,
et al.
, Adv. Condens. Matter Phys., 2015, 2015, 479318 Search PubMed.
|
| This journal is © The Royal Society of Chemistry 2023 |
Click here to see how this site uses Cookies. View our privacy policy here. 
 Open Access Article
 This Open Access Article is licensed under a Creative Commons Attribution-Non Commercial 3.0 Unported Licence
 *a,
Takumi
Miyamoto
a,
Kohki
Okabe
*a,
Takumi
Miyamoto
a,
Kohki
Okabe