 Open Access Article
Creative Commons Attribution 3.0 Unported Licence
Doppler-free ablation fluorescence spectroscopy of Ca for high-resolution remote isotopic analysis
Masabumi
Miyabe
 *a,
Masaaki
Kato
a and
Shuichi
Hasegawa
b
aCollaborative Laboratories for Advanced Decommissioning Science, Japan Atomic Energy Agency, 2-4, Shirakata, Tokai, Ibaraki 319-1195, Japan. E-mail: miyabe.masabumi@jaea.go.jp
bNuclear Professional School, The University of Tokyo, 2-22 Shirane, Shirakata, Tokai, Ibaraki 319-1188, Japan
First published on 17th January 2023
Abstract
To develop remote isotopic analysis for the nuclides with small isotope shifts, Doppler-free fluorescence spectroscopy of Ca was performed using laser ablation plumes. Counter-propagating laser beams from two external cavity diode lasers were used to irradiate the plume in order to excite the ground-state Ca atoms to the 1D2 state through a double resonance scheme of 1S0 → 1P1 → 1D2. Subsequently, we measured fluorescence spectra associated with the relaxation from the 1D2 to 1P1 states. The linewidth measured at 1 ms delay after ablation under helium gas pressure of 70 Pa was found to be less than 70 MHz, which was about 1/30 of the linewidth of the Doppler-limited fluorescence spectrum. A broad Gaussian pedestal was observed at less than 600 μs delay in the temporal variation in fluorescence spectra, and it was most likely due to the velocity-changing collision. Additionally, the pressure broadening rate coefficient for the second-step 1P1 → 1D2 transition was determined to be 46.0 MHz per torr from the spectra measured under various gas pressures. We evaluated analytical performances such as linearity of the calibration curve, limit of detection, and measurement accuracy using fluorescence signals of three naturally occurring Ca isotopes (i.e., 40Ca, 42Ca, and 44Ca). The limit of detection of isotopic abundance was estimated to be 0.09% from the 3σ criteria of the background. These results suggest that this spectroscopic technique is promising for remote isotopic analysis of nuclides with small isotope shifts.
Introduction
Generally, an atomic source that can stably produce a gaseous sample of interest is required for atomic spectroscopy. There are various types of atomic sources, such as resistively heated crucibles, furnaces, flames, ion sputtering, and glow discharge. Among them, laser ablation sources have the advantage of being applicable to samples of various chemical forms, such as refractory metals and liquids. Owing to this versatility, the ablation process has been used for spectroscopic analysis in many studies for a long time.1,2 However, the transient and spatially inhomogeneous nature of laser plasmas requires a comprehensive understanding of plasma mechanisms, such as plume expansion dynamics and gas-phase chemistry, all of which still require numerous fundamental studies.3–11High spectral resolution and sensitivity are crucial for using the ablation process in spectroscopic analysis, particularly isotopic analysis. There are two types of spectroscopic analyses that use laser ablation: one is emission spectroscopy from a hot laser plasma (laser-induced breakdown spectroscopy; LIBS), and the other is resonance absorption and fluorescence spectroscopy for light transmitted through a cooled laser plasma. LIBS is widely known to have a major disadvantage of broadened spectral linewidth due to Stark and Doppler broadening caused by highly dense charged particles and their energetic motion in hot plasma. Furthermore, LIBS spectrometers have a trade-off between sensitivity and resolution. Thus, there are very few isotopes that can be analyzed by emission spectroscopy, and their analytical performances are extremely limited.12–17
In contrast, absorption and fluorescence spectroscopy for cooled laser plasma can readily achieve high-resolution measurements when a narrow bandwidth tunable laser is used as a probe light source. Many previous studies on absorption and fluorescence spectroscopy have focused on determining the optimum experimental conditions under which laser plasmas are adequately confined by ambient gas to maintain a moderate particle density and effectively cool the plasma.18 Consequently, it is possible to reduce the kinetic temperature of ablated species to around room temperature under optimum conditions, permitting the isotopic analysis of nuclides with large isotope shifts, such as uranium and plutonium.7,19,20
However, it is still challenging to identify individual isotope peaks for many other nuclides with small isotope shifts, even when the Doppler width is narrowed to the linewidth of the room temperature.21 In addition, the demand for high-resolution spectroscopic analysis of various nuclides is increasing in many fields.22–24 Thus, in this study, we used a Doppler-free technique to perform laser ablation spectroscopy on nuclides with small isotope shifts.
To the best of our knowledge, Lynds et al. are the only researchers who have published a study demonstrating sub-Doppler spectroscopy using laser ablation sources.25 In their study, an ablation plume was produced in a vacuum, and the Doppler broadening of the fluorescence peak was narrowed by observing the fluorescence only from a limited geometrical area of the plume. However, it had a drawback of low sensitivity because the number of atoms contributing to the fluorescence signal was extremely small owing to the spatial limitation.
In addition to laser ablation sources, various types of Doppler-free techniques involving the saturation effect, multiphoton excitation effect, etc., have been developed for a long time to cancel Doppler broadening in the field of laser spectroscopy.26 The most popular Doppler-free technique is saturated absorption spectroscopy. In this method, a single laser beam is divided into two beams to irradiate atomic species, and a Lamb dip in the population distribution of the lower level, which is produced with an intense pump beam, is observed with a weak counter-propagating probe beam. However, even with this method, the sensitivity is not very high since only atoms with zero velocity along the beam direction can interact with the laser beams, and most of the remaining atoms do not contribute to the signal. Thus, this technique has never been used with a laser ablation source.
In this study, we focused on two-photon spectroscopy, a Doppler-free technique that allows atoms of almost all velocity classes to interact with a laser beam. Similar to saturated absorption spectroscopy, nonresonant two-photon spectroscopy uses two counter-propagating laser beams with the same wavelength. Although nonresonant two-photon spectroscopy requires a high-power laser source because of the nonlinear dependence of two-photon transition probability on laser power, the perfect compensation of the Doppler shifts for both beams allows all atoms to interact with the beams regardless of their velocities.27–29 Conversely, resonance-enhanced two-photon spectroscopy, which uses two different-wavelength tunable lasers, can provide an intense signal even at low laser powers, even though the Doppler broadening is not completely eliminated.30–38 In this study, we used two resonance lasers to observe fluorescence from the second excited state of atomic Ca populated through the 1S0 → 1P1 → 1D2 scheme39–41 to evaluate various analytical performances. Our main aim was to use laser ablation-based remote analysis to the decommissioning of Fukushima's failed reactors. Herein, we demonstrate that ablation-based remote isotopic analysis is applicable to both actinide elements (such as U and Pu) and elements with small isotope shifts.
Experimental
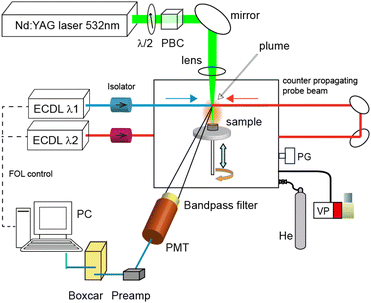
Fig. 1 shows a schematic of the experimental apparatus. This apparatus consists of three parts: (i) a Q-switched neodymium![[thin space (1/6-em)]](https://www.rsc.org/images/entities/char_2009.gif) :
:![[thin space (1/6-em)]](https://www.rsc.org/images/entities/char_2009.gif) yttrium aluminum garnet (Nd
yttrium aluminum garnet (Nd![[thin space (1/6-em)]](https://www.rsc.org/images/entities/char_2009.gif) :
:![[thin space (1/6-em)]](https://www.rsc.org/images/entities/char_2009.gif) YAG) laser (LOTIS TII, LS-2134N; a pulse length of 15 ns and a repetition rate of 10 Hz), (ii) two external cavity diode lasers (ECDLs; center wavelengths of 422 nm and 732 nm and a typical output power of 10 mW) for two-step resonance excitation, and (iii) a fluorescence detection system. The second harmonic radiation (532 nm) of the Nd
YAG) laser (LOTIS TII, LS-2134N; a pulse length of 15 ns and a repetition rate of 10 Hz), (ii) two external cavity diode lasers (ECDLs; center wavelengths of 422 nm and 732 nm and a typical output power of 10 mW) for two-step resonance excitation, and (iii) a fluorescence detection system. The second harmonic radiation (532 nm) of the Nd![[thin space (1/6-em)]](https://www.rsc.org/images/entities/char_2009.gif) :
:![[thin space (1/6-em)]](https://www.rsc.org/images/entities/char_2009.gif) YAG laser was used to irradiate the target sample set on a rotating table in a vacuum chamber via a biconvex lens with a focal length of 200 mm in order to generate an ablation plume. The beam diameter of the Nd
YAG laser was used to irradiate the target sample set on a rotating table in a vacuum chamber via a biconvex lens with a focal length of 200 mm in order to generate an ablation plume. The beam diameter of the Nd![[thin space (1/6-em)]](https://www.rsc.org/images/entities/char_2009.gif) :
:![[thin space (1/6-em)]](https://www.rsc.org/images/entities/char_2009.gif) YAG laser on the surface was estimated to be about 200 μm by the laser microscope analysis of the irradiation marks. A capacitance manometer (MKS, Baratron 626) and a gas handling system were used to fill the vacuum chamber with helium gas (purity 99.9%, 8 Pa–800 Pa) after it had been evacuated with a rotary pump. The pulse energy of the YAG laser was set to 0.30 mJ using a λ/2 plate and a polarizing beam splitter cube, and it was monitored using a joule meter (OPHIR, PE25SH). The target pellet (10 mm diameter and 6 mm thick) was made using a tabletop press (NPa system TB-200H) to compress Portland cement powder (about 1 g) containing a calcium content of about 60 wt% at a hydrostatic pressure of about 5 MPa.
YAG laser on the surface was estimated to be about 200 μm by the laser microscope analysis of the irradiation marks. A capacitance manometer (MKS, Baratron 626) and a gas handling system were used to fill the vacuum chamber with helium gas (purity 99.9%, 8 Pa–800 Pa) after it had been evacuated with a rotary pump. The pulse energy of the YAG laser was set to 0.30 mJ using a λ/2 plate and a polarizing beam splitter cube, and it was monitored using a joule meter (OPHIR, PE25SH). The target pellet (10 mm diameter and 6 mm thick) was made using a tabletop press (NPa system TB-200H) to compress Portland cement powder (about 1 g) containing a calcium content of about 60 wt% at a hydrostatic pressure of about 5 MPa.
The plume was irradiated with two counter-propagating diode laser beams at a height of about 6 mm from the sample surface, and the fluorescence generated from the plume was detected by a photomultiplier (Hamamatsu, R1894) through an interference filter with a transmission band of 730 ± 5 nm (Edmund Optics). The wavelengths of the diode lasers were actively controlled by a fringe offset locking system that consisted of a wavelength-stabilized HeNe laser (Thorlabs, HRS015), a scanning Fabry–Perot interferometer with a free spectral range of 300 MHz, and a computer for running the control program. Their actual wavelengths and longitudinal modes were continuously monitored using a wavemeter (HighFinesse, WS-7). The current pulse signal from the photomultiplier was converted into a voltage signal via a preamplifier (Femto, DHPCA-100, bandwidth: 3.5–12 MHz), and its integrated signal was measured using a digital oscilloscope (Iwatsu, DS-5414A, bandwidth: 100 MHz).
Usually, this pulsed fluorescence signal overlaps with the residual plasma emission pulse transmitted through the interference filter. In general, the plasma emission is mainly generated from the central portion of the laser plasma, while the fluorescence is generated from the contact layer between the laser plasma and surrounding gas, where many neutral atoms in the ground-state are produced through recombination and relaxation processes.42 Thus, we carefully optimized the position and viewing angle of the photomultiplier to increase the ratio of fluorescence to emission intensity. Moreover, the gate of a boxcar integrator (Stanford Research, SRS200) was set at an appropriate delay time to obtain the fluorescence spectra, and the integrated signals were recorded by a computer.
Fig. 2 shows the double resonance excitation scheme of calcium used in this study. The ground-state (1S0) atoms were excited to the first excited state (1P1) with a 422 nm laser beam and subsequently excited to the second excited state (1D2) with a 732 nm laser beam. This second excited state can decay to triplet states (3P1,2,3F2) as well as to the singlet states (1P1, 1D2). In this study, we observed fluorescence arising from the relaxation from the 1D2 state to the 1P1 state, of which branching ratio is reported to be 99.73%50 (wavy arrow). Table 1 lists the reported isotope shifts for these transitions.
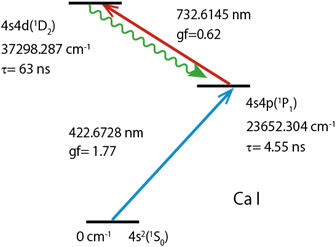 | ||
| Fig. 2 Two-color two-step resonance excitation and fluorescence observation scheme of atomic Ca. Lifetimes (τ) of 1P1 and 1D2 levels were cited from ref. 43,44, oscillator strengths (gf) of the first and second transitions from ref. 45,46, level-energies, and transition wavelengths (in air) and configurations from ref. 47,48. | ||
| Symbols | Wavelength (nm) | Transition | 42–40IS (MHz) | 44–40IS (MHz) |
|---|---|---|---|---|
| λ1 | 422.6728 | 4s2(1S0)–4s4p(1P1) | 393.13 | 773.83 |
| λ2 | 732.6145 | 4s4p(1P1)–4s4d(1D2) | 875.54 | 1672.37 |
3. Results and discussion
3.1 Time dependence of two-color two-step LIF signals
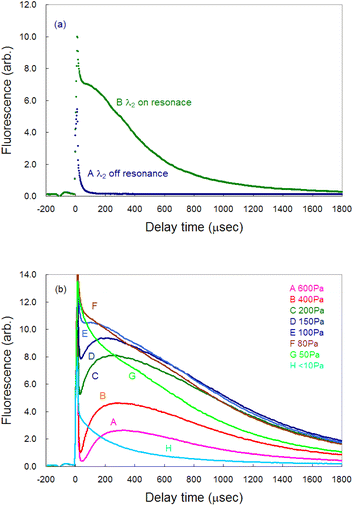
Time-resolved measurements are required for analyzing the fluorescence signal from the plasma because of the transient nature of the laser plasma. Fig. 3(a) shows a typical temporal variation in the measured fluorescence signal. Curve A represents the signal measured when the second-step laser wavelength was far from resonance, whereas curve B represents the signal measured when both the first-step and second-step lasers were in resonance. Immediately after ablation, a nonnegligible amount of plasma emission passed through the interference filter being used and overlapped with the fluorescence signal as a sharp peak of about 15 μs width (curve B). Thus, in this study, the gate delay of the boxcar integrator was set to 200 μs or more after ablation onset to discriminate the fluorescence component from the emission one. Additionally, the gate width was set to 20 μs throughout to measure the time-resolved fluorescence spectra.In our previous ablation absorption/fluorescence spectroscopy analysis of Pu and Gd,19,42 the persistence of atomic species in the ablation plume was measured to be several tens of microseconds, whereas the persistence of Ca was found to be significantly longer. Such a large difference in the persistence of ground-state atoms in the plume may arise from the difference in the ease of oxidation of these elements. Skrodki et al. systematically studied the short persistence of ground-state uranium atoms in a plume using laser ablation absorption spectroscopy (LAAS) and LIBS and discovered that it does not arise from plume confinement and variations in fundamental plasma properties but from the formation of uranium oxides.51 Considering that lanthanide/actinide elements and Ca have different chemical properties, the long persistence of Ca may be due to the difficulty in oxidizing Ca.
Fig. 3(b) shows the pressure dependence of the fluorescence signal. The signal reached its maximum intensity around 100 Pa (curves E and F). Since the plume required much time to reach the probe laser irradiation region (6 mm height) at high pressures, the peak of the fluorescence signal was delayed, and the intensity decreased. However, the intensity immediately after ablation was high at a pressure lower than 100 Pa (curves G and H), whereas the intensity decreased more rapidly because of the decrease in atomic density due to a weak plume confinement under low gas pressure.
3.2 Laser power dependence on the fluorescence signal
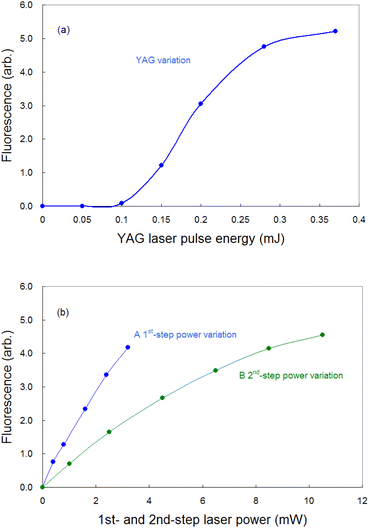
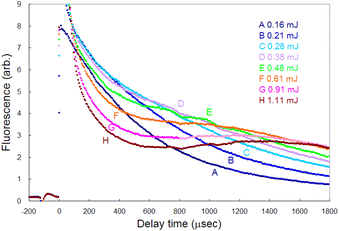
To detect the fluorescence signal sensitively, the dependences of the probe laser power and ablation pulse energy on the fluorescence signal were investigated at 1 ms-delay under helium gas pressure of 100 Pa (Fig. 4). Fig. 4(a) shows that the ablation threshold is about 0.1 mJ and that the signal is saturated at 0.3 mJ or more. The saturation of the fluorescence signal may be caused by the generation mechanisms of various ablated species, photoacoustic effects, etc. Among them one of the major causes is the start of generation of singly charged ions. In fact, considering the beam diameter, the pulse energy of 0.3 mJ corresponds to the fluence of about 1 J cm−2, which is close to the reported threshold value for the production of singly charged species of aluminium (0.8 J cm−2 (ref. 52)). To clarify the mechanism of the saturation, the temporal variation in the fluorescence signals measured with various ablation energies is shown in Fig. 5. The fluorescence intensity around 500 μs starts to decrease with increasing ablation energy when the energy exceeds 0.3 mJ, while the intensity around 1800 μs increases consistently. This temporal behavior suggests that an ion formation decreases the number of neutral atoms in the early stage of plume evolution, and that the recombination of ions and subsequent cascading relaxation lead to an increase in the ground state atoms in the later stage of plume evolution. Based on this result, the ablation energy in this study was set to about 0.3 mJ to maximize the neutral atomic signal while minimizing interference from ionic species.Conversely, as shown in Fig. 4(b), the fluorescence intensity increased consistently as the first-step and second-step laser powers increased. This result suggests that a relatively high detection sensitivity can be obtained when a very intense probe laser is used for fluorescence spectroscopy. According to previous studies on multistep resonance ionization spectroscopy using atomic Ca beams and continuous-wave lasers,40,41 the saturation powers of the first-step and second-step transitions of this excitation scheme are reported to be about 0.07 mW and 0.48 mW, respectively. Their beam diameters are almost the same as that used in this study. Nevertheless, the fluorescence signal shown in Fig. 4(b) is not saturated. One of the reasons is that the atomic beam is a system with a negligibly low collision frequency, whereas the laser plasma undergoes collisional relaxation of the excited state as frequently as radiative relaxation. Another reason is that the spatial intensity distribution of the probe beam used in this study is closer to the Gaussian distribution than the flat top. In this case, an increase in the intensity causes the transition to saturate rapidly near the center of the beam, but the fluorescence intensity increases further in the periphery, which can result in nonuniform saturation of the signal. Therefore, considering such collisional relaxation and spatially nonuniform saturation, the laser powers of the first and second steps were set to about 3 mW and 10 mW, respectively, in this study.
3.3 Linewidth of the Doppler-free fluorescence spectrum
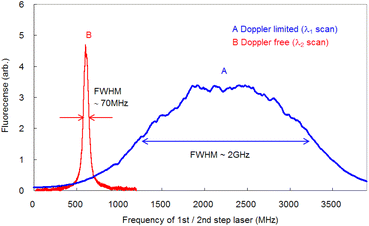
To compare the linewidths of the Doppler-free and Doppler-limited spectra, we first measured the fluorescence spectra arising from 1P1–1S0 relaxation by blocking the second-step laser and scanning the first-step laser wavelength under 70 Pa of helium at 1 ms delay. We conducted this measurement using an interference filter with a transmission range of 420 ± 5 nm. Fig. 6 shows a typical Doppler-limited spectrum (curve A). The fitting of the Voigt profile function shown in eqn (1) to this curve revealed that the Lorentzian width was negligible, and the full width at half maximum (FWHM) of the Gaussian profile was about 2 GHz. | (1) |
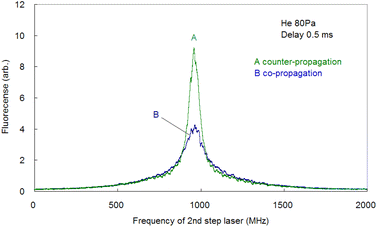
Since the Doppler width of 2 GHz corresponds to a Ca kinetic temperature of about 300 K, the ablated Ca atoms are likely to be cooled to around room temperature, which is consistent with our previous findings for other elements (such as Pu,19 Ti,21 and Gd53). Second, the fluorescence spectra associated with the 1D2–1P1 relaxation were measured using counter-propagating first-step and second-step laser beams and by tuning the first-step laser on resonance and scanning the second-step laser across the resonance. The typically measured spectrum is depicted in Fig. 6 (curve B). It is apparent that in high-resolution spectroscopy, the linewidth is narrowed to less than 70 MHz, which is about 1/30 of that observed with Doppler-limited spectroscopy. Furthermore, a flapper-mounted knife-edge mirror located in the second-step laser path was used to reverse the beam propagation direction in order to compare the spectra for counter-propagation and co-propagation configurations, as shown in Fig. 7. This figure shows that the co-propagation configuration has a wider and weaker line shape than the counter-propagation configuration. It is worth noting that the spectra shown in Fig. 7 have higher wings (pedestals) than the Doppler-free spectrum shown in Fig. 6. This difference is due to the difference in the observation timing, which will be discussed later. In addition, it is also noteworthy that the counter-propagation and co-propagation spectra have almost the same wing line shape. This suggests that this wing is due to a process independent of the beam propagation direction (e.g., the collisional process in laser plasmas).
Resonance-enhanced two-color two-photon excitation using two narrow bandwidth ECDLs is a spectroscopic technique that combines the high-resolution of (single-color) two-photon spectroscopy and the high sensitivity of two-step resonance excitation. Salomaa and Stenholm theoretically studied the detailed behavior of the spectra using the density matrix formalism.32 If the first-step laser is tuned to the resonance wavelength during the second-step laser scanning, the spectral linewidth Γ was derived from previous studies:30,34–37
 | (2) |
Temporal variations in the spectral line shape were investigated to gain an improved understanding of the underlying line-broadening mechanism. Fig. 8(a) shows the spectrum of 200 μs delay measured by scanning the second-step laser wavelength in the vicinity of the resonance wavelength. Notably, the spectrum shows a narrow peak on a broad pedestal. Eqn (3) was used to least-square-fit the spectrum based on the assumption that this line shape arises from Lorentzian and superimposed Gaussian peaks with an identical resonance wavelength:
 | (3) |
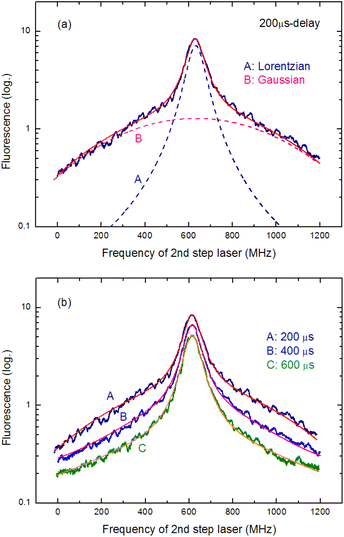 | ||
| Fig. 8 (a) Fluorescence spectrum measured at 200 μs delay. (A) Lorentzian and (B) Gaussian components obtained from least-square-fitting with eqn (3). (b). Fluorescence spectra measured at three different delay times along with the fitted curves. As the delay time increases, the Gaussian component disappears, whereas the Lorentzian component remains visible. | ||
In Fig. 8(a), the broken curves represent the fitted Lorentzian (curve A; ΔνH = 90 MHz) and Gaussian (curve B; ΔνD = 780 MHz) components, whereas the solid curve represents their summation (y in eqn (3)). In addition, Fig. 8(b) shows the spectra measured at three different delay times along with their fitted curves. Clearly, the Gaussian component disappears as the delay time increases, whereas the Lorentzian component remains visible. Thus, the latter is the peak with the linewidth described in eqn (2), and the former is most likely due to the velocity-changing collision that causes the velocity redistribution of atoms during their persistence in the ablation plume.54,55 The decrease in the collisional frequency of the ablated species is what causes this Gaussian component to decrease as the delay time increases.
3.4 Pressure broadening observed in the fluorescence spectrum
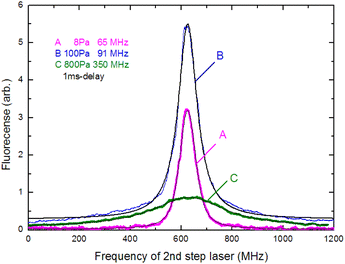
In Section 3.3, we analyzed the line-broadening mechanism with a particular focus on the Gaussian component and discovered that the component became negligible at delay times later than 800 μs. In this section, we focus on the pressure broadening of the remaining Lorentzian component. Fig. 9 shows the typical spectra measured at 1 ms delay under various helium gas pressures. Notably, their intensities and linewidths varied with pressure, and the highest peak intensity occurred at about 100 Pa. Such pressure dependence is most likely due to van der Waals broadening, which occurs when the radiative lifetime of the excited state of Ca atoms is shortened by collisions with gas molecules. Although the van der Waals interaction is generally accompanied by a shift in the resonance wavelength, it is negligibly small for this transition. These results reveal that a low pressure is generally preferable for high-resolution, whereas a pressure of about 100 Pa is preferable for high sensitivity.The measured spectra were least-square-fitted using the Voigt function. The resulting fitted curves are shown as a solid line in Fig. 9. Fig. 10 shows the relationship between the linewidths (FWHMs) and gas pressures determined based on the fitting parameters obtained for many spectra. This line shape analysis reveals that the Lorentzian component is predominant and that the Lorentzian width is proportional to the gas pressure. Based on the extrapolation of the fitted line in Fig. 10, the linewidth at zero pressure was found to be 58 MHz, which is larger than 28.2 MHz (the value calculated from eqn (2)). The main causes of this difference are probably the power broadening for the first-step transition and the Stark broadening caused by the charged species in the laser plasma.
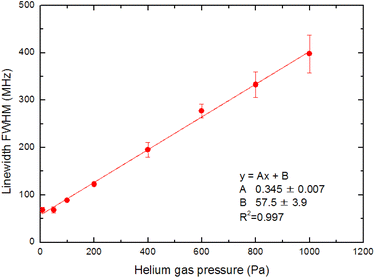 | ||
| Fig. 10 Pressure dependence on the fluorescence spectrum linewidth. The Gaussian component is negligible, and the Lorentzian width is proportional to the gas pressure. | ||
The pressure broadening rate coefficient (γ) for the second-step transition (1P1 → 1D2) was determined to be 46.0 MHz per torr from the slope of the fitted straight line in Fig. 10. This value has temperature dependence, and the plume temperature at a 1 ms delay is estimated to be about 300 K from the line widths of the Doppler-limited fluorescence spectra of Fig. 6 (curve A). This γ value is apparently larger than the reported γ value of the first-step transition (1S0 → 1P1) (9.8 MHz per torr)56 even when the temperature differences in atomic sources are considered. To the best of our knowledge, there are no reports about the γ of the second-step transitions of alkaline earth elements thus far. However, the γ of several second-step transitions for alkali metal elements have been measured by two-color two-photon resonance absorption spectroscopy using a gas cell and two tunable lasers. The reported broadening coefficients of the second-step transitions show the same tendency as that observed in this study, which is that the coefficient of the second-step transition (P → D)57,58 is larger than that of the first-step transition (S → P).59 For example, the broadening coefficients of the first-step (52S1/2 → 52P1/2) and second-step (52P1/2 → 52D3/2) transitions for Rb atoms under helium buffer gas are reported to be 20.8 MHz per torr59 and 54.64 MHz per torr,57 respectively. Qualitatively, this difference in γ value is explained by the fact that the mean radius of the valence d-electron orbital is larger than that of the p-electron orbital, making the frequency of the phase-changing collisions with helium atoms higher for the D state than for the P state.
A study on the determination of γ using an ablation source has only recently demonstrated in the use of Doppler-limited absorption spectroscopy for the first time.60 In that study, a significant variation in the gas pressure was required to vary the linewidth of the Doppler-broadened absorption peaks. It was reported that the large variation in the gas pressure varies the plasma temperature and that the correction of the temperature variation is required to precisely determine the broadening rate coefficient. In contrast, when Doppler-free spectroscopy is used, it is not necessary to vary the ambient pressure significantly, and this makes the temperature variation of the laser plasma negligible.
Laser ablation Doppler-free spectroscopy is expected to provide a sensitive characterization of laser plasmas since pressure broadening and shift coefficients provide sensitive indicators of the plasma temperature and particle density. In addition, due to the high versatility of the laser ablation source, laser ablation Doppler-free spectroscopy is believed to be useful for studying pressure broadening and shifts in the transitions associated with highly excited states of elements other than alkali metals, which have rarely been explored.
3.5 Isotope-selective fluorescence spectra and isotopic interferences
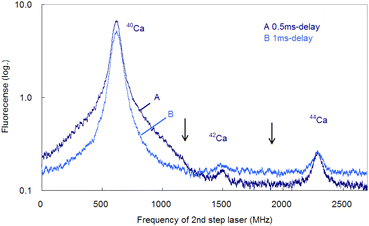
In the former sections, we analyzed the line-broadening mechanism mainly from the viewpoint of atomic and plasma physics. Here, we analyze their influence on the isotopic analysis. Fig. 11 shows the spectra simultaneously measured at delay times of 0.5 ms and 1 ms using two boxcar integrators with a single frequency scan. As shown in this figure, the second-step laser frequency was scanned from about −600 MHz of the resonance of 40Ca to a high frequency, and the first-step laser frequency was rapidly switched from the resonance of 40Ca to those of 42Ca and 44Ca at about 1.2 GHz and 2.0 GHz, respectively. In this figure, the switching positions are marked with arrows, and there is a discreet step at the wing of the 40Ca peak measured at 0.5 ms delay. The reported isotope shifts (λ1) in Table 1 were used for this switching. Since the natural abundances of 42Ca and 44Ca are as small as 0.647% and 2.086%, respectively,61 the vertical axis of these spectra was plotted on a logarithmic scale. The 42Ca peak measured at 0.5 ms delay appears more clearly than 1 ms delay, but the pedestal of the 40Ca peak appears to be slightly overlapped.Fig. 12 shows similar spectra measured at a delay time of 1 ms under helium gas pressures of 100 and 50 Pa. At 100 Pa, the wing of the 40Ca peak slightly overlaps the 42Ca peak because of pressure broadening, whereas at 50 Pa, the overlap is negligible. Note that these minor isotope peaks are difficult to observe in the Doppler-limited spectra, as shown in Fig. 6. Thus, these figures indicate that these minor Ca isotopes in the cement samples can be analysed with negligible isotopic interference when Doppler-free spectroscopy is used under suitable experimental conditions (50–70 Pa; 1 ms delay). Also, from Fig. 12, the isotope shifts of the second-step transition were determined to be 42–40IS = 877(2) MHz and 44–40IS = 1670(3) MHz. These values are in agreement with the reported values listed in Table 1 within the estimated error.
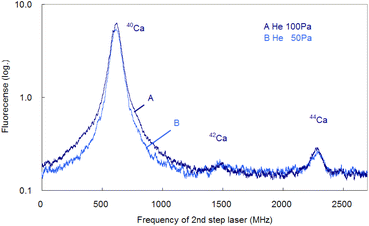 | ||
| Fig. 12 Isotope-selective fluorescence spectra measured at a delay time of 1 ms under helium gas pressures of 100 and 50 Pa. | ||
3.6 Evaluation of the analytical performance
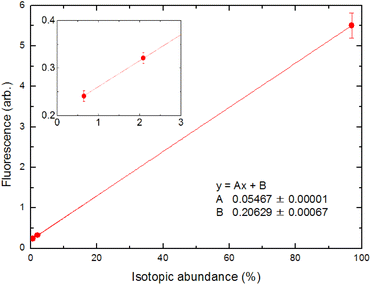
The analytical performance of ablation fluorescence spectroscopy was evaluated using cement pellet samples. First, we constructed a calibration curve between the fluorescence intensities of three naturally occurring isotopes, namely 40Ca, 42Ca, and 44Ca, and their natural isotopic abundances in order to confirm the linearity of the fluorescence signal.In Fig. 13, the fluorescence intensities at a delay time of 1 ms for the transition at 732.6 nm under a 50 Pa helium ambient atmosphere are averaged over 200 laser shots. Unless stated otherwise, the fluorescence intensity was determined in this manner throughout the evaluation of the analytical performance. The inset is a magnified view of the 42Ca and 44Ca signals. The straight line is due to the least-squares fitting of these points, and a good correlation coefficient was obtained. Fig. 13 shows that the fluorescence signal contains a minor offset component. This is due to the stray light of the second-step laser, which could not be blocked by the interference filter, and we confirmed that this offset could be reduced to zero by blocking the second-step laser beam. This offset depends on the intensity of the second-step laser and the geometric arrangement of the laser beam; thus, its magnitude varied from day-to-day measurements.
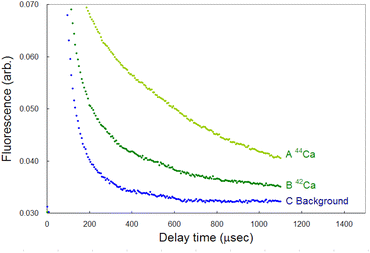
Compared to LIBS, ablation-induced fluorescence spectroscopy has the advantage of low background noise because it involves the use of cooled plasma. Fig. 14 shows the typical temporal profiles of the 42Ca and 44Ca fluorescence signals and a background signal, each of which was measured by accumulating the signals over 3000 laser shots. The wavelengths of the first-step and second-step lasers were detuned from the resonance wavelength of 40Ca to −600 MHz and +2.1 GHz, respectively, in order to measure the background. The signal-to-noise ratio of the 44Ca signal was estimated to be 70 at a 1 ms delay from these curves. Furthermore, the limit of detection (LOD) was determined from the standard deviation (σ) of the background and conversion factor (K) between the fluorescence intensity and isotopic abundance using the 3σ criterion:
| LOD = 3σ/K | (4) |
Consequently, the LOD of the isotopic abundance was evaluated to be 0.09% at a 1 ms delay. This value was limited because of the background fluctuation caused by the stray light of the second-step laser. Thus, it is necessary to find another scheme with different excitation/observation transitions to improve this performance.
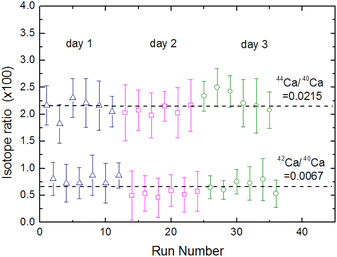
Fig. 15 shows the fluorescence intensity ratio that was measured by simultaneously switching the two laser wavelengths many times in the order of the 40Ca → 42Ca → 44Ca → background and by integrating the signal with a boxcar integrator. In this figure the error bars represent uncertainties of 2σ in the individual measurements, whereas the broken lines represent the natural isotope ratios of 44Ca/40Ca and 42Ca/40Ca.61 Based on these results, the weighted means of the 44Ca/40Ca and 42Ca/40Ca intensity ratios were calculated to be 0.0221 ± 0.0017 and 0.0067 ± 0.0014, respectively, and the relative standard deviation (RSD) of the isotopic analysis of 44Ca using cement sample was estimated to be 8%. Considering the difference in the concentration of the target element in the sample, these analytical performances are not significantly different from those of LAAS, which we previously evaluated using plutonium samples.19 Therefore, the proposed method can improve the spectral resolution by a factor of 30 or more without significantly degrading the analytical performance and allows for the isotopic analysis of nuclides with small isotope shifts.
4. Conclusion
High-resolution isotopic analysis of calcium was demonstrated by applying Doppler-free two-color two-photon resonance fluorescence spectroscopy to a laser ablation plume. Counter-propagating laser beams from two ECDLs were irradiated on the plume to excite the ground-state Ca atoms through a double resonance scheme of 1S0 → 1P1 → 1D2, and fluorescence from the 1D2 excited state was observed. The findings of this study are as follows.(1) The line shape of the measured fluorescence spectrum consisted of a narrow Lorentzian component superimposed on a broad Gaussian pedestal. The latter decreased as the delay time increased and was most likely due to velocity-changing collision.
(2) The linewidth of the Lorentzian component observed at 1 ms delay varied with the helium gas pressure. The pressure broadening rate coefficient was determined to be 46.0 MHz per torr, and the linewidth at zero pressure was 58 MHz.
(3) The isotope-selective fluorescence spectra exhibited three peaks corresponding to naturally occurring isotopes of 40Ca, 42Ca, and 44Ca, which were unidentified in the conventional Doppler-limited spectra.
(4) The calibration curve with the three isotopes showed good linearity. The LOD of isotopic abundance was estimated to be 0.09% from the 3σ criteria of the background. The relative standard deviation was estimated to be 8% based on the reproducibility of the 44Ca/40Ca intensity ratio with a natural isotope ratio of 0.0215.
Author contributions
Conceptualisation and writing of original draft: M. M.; funding acquisition: M. M. and S. H.; investigation: M. M. and M. K.; writing (review and editing): M. M. and S. H.Conflicts of interest
There are no conflicts to declare.Acknowledgements
This work was partially supported by JSPS KAKENHI Grant number JP22H02011 and the JAEA Nuclear Energy S&T and Human Resource Development Project through concentrating wisdom Grant No. JPJA18B18072148.References
- F. Leis, W. Sdorra, J. B. Ko and K. Niemax, Basic investigations for laser microanalysis: I. Optical emission spectrometry of laser-produced sample plumes, Mikrochim. Acta, 1989, 11, 185–199 CrossRef.
- K. Niemax, Laser ablation – reflection on a very complex technique for solid sampling, Fresenius. J. Anal. Chem., 2001, 370, 332–340 CrossRef PubMed.
- S. Amoruso, R. Bruzzese, N. Spinelli and R. Velotta, Characterization of laser-ablation plasmas, J. Phys. B: At., Mol. Opt. Phys., 1999, 32, R131–R172 CrossRef.
- A. Kuwahara, K. Murakami, H. Tomita, K. Sawada and Y. Enokida, Doppler splitting and expansion dynamics of laser-produced plasma plume under a high vacuum ambience, J. Anal. At. Spectrom., 2022, 37, 2033–2041 RSC.
- S. S. Harilal, M. C. Phillips, D. H. Froula, K. K. Anoop, R. C. Issac and F. N. Beg, Optical diagnostics of laser-produced plasmas, Rev. Mod. Phys., 2022, 94, 035002 CrossRef.
- J. Merten, Laser-ablation absorption spectroscopy: Reviewing an uncommon hyphenation, Spectrochim. Acta, Part B, 2022, 189, 106358 CrossRef.
- S. S. Harilal, C. M. Murzyn, M. C. Phillips and J. B. Martin, Hyperfine structures and isotopic shifts of uranium transitions using tunable laser spectroscopy of laser ablation plumes, Spectrochim. Acta, Part B, 2020, 169, 105828 CrossRef CAS.
- E. J. Kautz, E. N. Weerakkody, M. S. Finko, D. Curreli, B. Koroglu, T. P. Rose, D. G. Weisz, J. C. Crowhurst, H. B. Radousky, M. DeMagistris, N. Sinha, D. A. Levin, E. L. Dreizin, M. C. Phillips, N. G. Glumac and S. S. Harilal, Optical spectroscopy and modeling of uranium gas-phase oxidation: Progress and perspectives, Spectrochim. Acta, Part B, 2021, 185, 106283 CrossRef CAS.
- N. L. LaHaye, S. S. Harilal and M. C. Phillips, Early- and late-time dynamics of laser-produced plasmas by combining emission and absorption spectroscopy, Spectrochim. Acta, Part B, 2021, 179, 106096 CrossRef CAS.
- G. Hull, E. D. McNaghten, P. Coffey and P. Martin, Isotopic analysis and plasma diagnostics for lithium detection using combined laser ablation-tunable diode laser absorption spectroscopy and laser-induced breakdown spectroscopy, Spectrochim. Acta, Part B, 2021, 177, 106051 CrossRef CAS.
- G. Hull, E. D. McNaghten, C. A. Sharrad and P. A. Martin, Combined laser ablation-tunable diode laser absorption spectroscopy and laser-induced breakdown spectroscopy for rapid isotope analysis of uranium, Spectrochim. Acta, Part B, 2022, 190, 106378 CrossRef CAS.
- H. Niki, T. Yasuda and I. Kitazima, Measurement technique of boron isotopic ratio by laser-induced breakdown spectroscopy, J. Nucl. Sci. Technol., 1998, 35, 34–39 CrossRef CAS.
- W. Pietsch, A. Petit and A. Briand, Isotope ratio determination of uranium by optical emission spectroscopy on a laser-produced plasma - basic investigations and analytical results, Spectrochim. Acta, Part B, 1998, 53, 751–761 CrossRef.
- C. A. Smith, M. A. Martinez, D. K. Veirs and D. A. Cremers, Pu-239/Pu-240 isotope ratios determined using high resolution emission spectroscopy in a laser-induced plasma, Spectrochim. Acta B: At. Spectrosc., 2002, 57, 929–937 CrossRef.
- D. A. Cremers, A. Beddingfield, R. Smithwick, R. C. Chinni, C. R. Jones, B. Beardsley and L. Karch, Monitoring uranium, hydrogen, and lithium and their isotopes using a compact laser-induced breakdown spectroscopy (LIBS) probe and high-resolution spectrometer, Appl. Spectrosc., 2012, 66, 250–261 CrossRef CAS.
- G. C.-Y. Chan, I. Choi, X. Mao, V. Zorba, O. P. Lam, D. K. Shuh and R. E. Russo, Isotopic determination of uranium in soil by laser induced breakdown spectroscopy, Spectrochim. Acta, Part B, 2016, 122, 31–39 CrossRef CAS.
- C. Rinaldi, M. Pozzi, N. Boggio and J. Vorobioff, Isotopic analysis of uranium by laser induced breakdown spectroscopy, Spectrochim. Acta, Part B, 2020, 167, 105841 CrossRef CAS.
- M. Miyabe, M. Oba, H. Iimura, K. Akaoka, Y. Maruyama, H. Ohba, M. Tampo and I. Wakaida, Absorption spectroscopy of uranium plasma for remote isotope analysis of next-generation nuclear fuel, Appl. Phys. A, 2013, 112, 87–92 CrossRef CAS.
- M. Miyabe, M. Oba, K. Jung, H. Iimura, K. Akaoka, M. Kato, H. Otobe, A. Khumaeni and I. Wakaida, Laser ablation absorption spectroscopy for isotopic analysis of plutonium: Spectroscopic properties and analytical performance, Spectrochim. Acta, Part B, 2017, 134, 42–51 CrossRef CAS.
- Y. Hao, H. Yin-Bo, W. Chen, L. Guo-Rong, L. Xing-Ji, C. Zhen-Song, H. Yao, Q. Gang and M. Hai-Ping, Measurement of uranium isotope ratio by laser ablation absorption spectroscopy, Acta Phys. Sin., 2021, 70, 163201 CrossRef.
- K. Jung, M. Miyabe, K. Akaoka, M. Oba and I. Wakaida, Expansion characteristics of particles in ablation plume measured with resonance absorption spectroscopy – Comparison of neutral atoms of Titanium and Hafnium, JAEA-Research 2017-008, 2017 (in Japanese) Search PubMed.
- S. S. Harilal, N. L. LaHaye and M. C. Phillips, High-resolution spectroscopy of laser ablation plumes using laser-induced fluorescence, Opt. Express, 2017, 25, 2312–2326 CrossRef CAS.
- M. Burger, L. A. Finney, L. Garrett, S. S. Harilal, K. C. Hartig, J. Nees, P. J. Skrodzki, X. Xiao and I. Jovanovic, Laser ablation spectrometry for studies of uranium plasmas, reactor monitoring, and spent fuel safety, Spectrochim. Acta, Part B, 2021, 179, 106095 CrossRef CAS.
- A. Kuwahara, Y. Aiba and M. Matsui, Plasma atomization of strontium chloride powder by a supersonic plasma jet and measurement of its efficiency using diode laser absorption spectroscopy, ACS Omega, 2021, 6, 11750–11755 CrossRef.
- L. Lynds and B. A. Woody, Sub-Doppler spectroscopy of 89Y, J. Appl. Phys., 1996, 79, 565–569 CrossRef.
- R. C. Thompson, High resolution laser spectroscopy of atomic systems, Rep. Prog. Phys., 1985, 48, 531–578 CrossRef.
- F. Biraben, B. Cagnac and G. Grynberg, Experimental Evidence of Two-Photon Transition without Doppler Broadening, Phys. Rev. Lett., 1974, 32, 643–645 CrossRef.
- M. D. Levenson and N. Bloembergen, Observation of the Two-Photon Absorption without Doppler Broadening on the 3S–5S Transition in Sodium Vapor, Phys. Rev. Lett., 1974, 32, 645–648 CrossRef.
- T. W. Hänsch, K. C. Harvey, G. Meisel and A. L. Schawlow, Two-photon spectroscopy of Na 3s–4d without Doppler broadening using a cw dye laser, Opt. Commun., 1974, 11, 50–53 CrossRef.
- J. E. Bjorkholm and P. F. Liao, Line shape and strength of two-photon absorption in an atomic vapor with a resonant or nearly resonant intermediate state, Phys. Rev. A: At., Mol., Opt. Phys., 1976, 14, 751–760 CrossRef CAS.
- J. E. Bjorkholm and P. F. Liao, Line shape and atomic efficiency of two-photon absorption using counter-propagating beams to reduce Doppler effects, IEEE J. Quantum Electron., 1976, QE-10, 906–908 Search PubMed.
- R. Salomaa and S. Stenholm, Two-photon spectroscopy: effect of a resonant intermediate state, J. Phys. B: At. Mol. Phys., 1975, 8, 1795–1805 CrossRef.
- R. Salomaa and S. Stenholm, Two-photon spectroscopy II: Effect of residual Doppler broadening, J. Phys. B: At., Mol. Opt. Phys., 1976, 9, 1221–1235 CrossRef CAS.
- T. T. Grove, V. Sanchez-Villicana, B. C. Duncan, S. Maleki and P. L. Gould, Two-photon two-color diode laser spectroscopy of the Rb 5D5/2 state, Phys. Scr., 1995, 52, 271–276 CrossRef CAS.
- C. Fort, M. Inguscio, P. Raspollini, F. Baldes and A. Sasso, Doppler-free two-color spectroscopy of the 62S1/2–82S1/2 cesium transition using semiconductor diode lasers, Appl. Phys. B, 1995, 61, 467–472 CrossRef.
- A. Kortyna, N. A. Masluk and T. Bragdon, Measurement of the 6d 2DJ hyperfine structure of cesium using resonant two-photon sub-Doppler spectroscopy, Phys. Rev. A: At., Mol., Opt. Phys., 2006, 74, 022503 CrossRef.
- C. Perrella, P. S. Light, J. D. Anstie, T. M. Stace, F. Benabid and A. N. Luiten, High-resolution two-photon spectroscopy of rubidium within a confined geometry, Phys. Rev. A: At., Mol., Opt. Phys., 2013, 87, 013818 CrossRef.
- L. Jia, C. Jing, Z. Zhou and F. Lin, Hyperfine structure and isotope shifts of high-lying odd-parity levels of Gd I by resonantly enhanced Doppler-free two-photon spectroscopy, J. Opt. Soc. Am. B, 1993, 10, 2269–2272 CrossRef CAS.
- W. Noertershauser, N. Trautmann, K. Wendt and B. A. Bushaw, Isotope shifts and hyperfine structure in the 4s2 1S0 – 4s 4p 1P1–4s4 d 1D2 transitions of stable calcium isotopes and calcium-41, Spectrochim. Acta, Part B, 1998, 53, 709–721 CrossRef.
- C. Geppert, Resonanzionisation zum Nachweis und zur Erzeugung radioaktiver Ionenstrahlen: Vom hochselektiven Ultraspurennachweis zur selektiven on-line Laserionenquelle, Dissertation, Johannes Gutenberg-Universitaet, Mainz, 2005 Search PubMed.
- D. M. Lucas, A. Ramos, J. P. Home, M. J. McDonnell, S. Nakayama, J.-P. Stacey, S. C. Webster, D. N. Stacey and A. M. Steane, Isotope-selective photoionization for calcium ion trap, Phys. Rev. A: At., Mol., Opt. Phys., 2004, 69, 012711 CrossRef.
- M. Miyabe, M. Oba, H. Iimura, K. Akaoka, A. Khumaeni, M. Kato and I. Wakaida, Ablation plume structure and dynamics in ambient gas observed by laser-induced fluorescence imaging spectroscopy, Spectrochim. Acta, Part B, 2015, 110, 101–117 CrossRef CAS.
- P. S. Doidge, A compendium and critical review of neutral atom resonance line oscillator strengths for atomic absorption analysis, Spectrochim. Acta, Part B, 1995, 50, 209–263 CrossRef.
- L. R. Hunter, G. M. Watson, D. S. Weiss and A. G. Zajone, High-precision measurement of lifetimes and collisional decay parameters in Ca 1D states using the two-photon Hanle effect, Phys. Rev. A: At., Mol., Opt. Phys., 1985, 31, 2268–2278 CrossRef CAS PubMed.
- D. C. Morton, Atomic data for resonance absorption lines. III. Wavelengths longward of the Lyman limit for the elements Hydrogen to Gallium, Astrophys. J., Suppl. Ser., 2003, 149, 205–238 CrossRef CAS.
- G. Smith, Oscillator strengths for neutral calcium lines of 2.9 eV excitation, J. Phys. B: At., Mol. Opt. Phys., 1988, 21, 2827–2834 CrossRef CAS.
- P. L. Smith, C. Heise, J. R. Esmond and R. L. Kurucz, Atomic spectral line database from CD-ROM 23 of R. L. Kurucz Cambridge, Mass, Smithonian Astrophysical Observatory, 1995 Search PubMed.
- Y. Ralchenko, A. E. Kramida, J. Reader and NIST ASD Team, NIST Atomic Spectra Database, NIST standard Reference Database 78 version 5.9, 2022 Search PubMed.
- A. Kramida, Isotope shifts in neutral and singly-ionized calcium, At. Data Nucl. Data Tables, 2020, 133–134, 101322 CrossRef.
- Y. Yu and A. Derevianko, Transition rates and radiative lifetimes of Ca I, At. Data Nucl. Data Tables, 2018, 119, 263–286 CrossRef.
- P. J. Skrodki, N. P. Shah, N. Taylor, K. C. Hartig, N. L. LaHaye, B. E. Brumfield, I. Jovanovic, M. C. Phillips and S. S. Harilal, Significance of ambient conditions in uranium absorption and emission features of laser ablation plasmas, Spectrochim. Acta, Part B, 2016, 125, 112–119 CrossRef.
- J. I. Apinaniz, B. Sierra, R. Martinez, A. Longarte, C. Redondo and F. Castano, Ion kinetic energy distributions and mechanisms of pulsed laser ablation on Al, J. Phys. Chem., 2008, C112, 16556–16560 Search PubMed.
- M. Miyabe, M. Oba, H. limura, K. Akaoka, Y. Maruyama, I. Wakaida and K. Watanabe, Ablation-initiated Isotope-selective Atomic Absorption Spectroscopy of Lanthanide Elements, AIP conference series, CP1104, International Conference on Laser Probing – LAP 2008, ed. T. Iguchi and K.Watanabe, 2009 Search PubMed.
- P. W. Smith and T. Haensch, Cross-relaxation effects in the saturation of the 6328-A neon-laser line, Phys. Rev. Lett., 1971, 26, 740–743 CrossRef.
- A. Sasso, G. M. Tino, M. Inguscio, N. Beverini and M. Francesconi, Investigation of collisional lineshape of neon transitions in noble gases' mixtures, Il Nuovo Cimento D, 1988, 10, 941–957 CrossRef.
- G. Smith, Collision broadening and shift in the resonance line of calcium, J. Phys. B: At. Mol. Phys., 1972, 5, 2310–2319 CrossRef CAS.
- T. M. True, C. A. Rice and G. P. Perram, Rubidium excited state line shapes from 5P to 5D and 7S broadened by helium, J. Quant. Spectrosc. Radiat. Transfer, 2021, 274, 107879 CrossRef CAS.
- T. M. True, C. A. Rice and G. P. Perram, The cesium 62P3/2 to 82S1/2 line shape broadened by He, Ar, and Kr, J. Quant. Spectrosc. Radiat. Transfer, 2020, 250, 107010 CrossRef CAS.
- G. A. Pitz, A. J. Sandoval, T. B. Tafoya, W. L. Klennert and D. A. Hostutler, Pressure broadening and shift of the rubidium D1 transition and potassium D2 transitions by various gases with comparison to other alkali rates, J. Quant. Spectrosc. Radiat. Transfer, 2014, 140, 18–29 CrossRef CAS.
- S. S. Harilal, E. J. Kaut and M. C. Phillips, Time-resolved absorption spectroscopic characterization of ultrafast laser-produced plasmas under varying background pressures, Phys. Rev. E, 2021, 103, 013213 CrossRef CAS PubMed.
- CRC Handbook of chemistry and physics, ed. W. M. Haynes, D. R. Lide and T. J. Bruno, CRC Press, 97th edn, 2016 Search PubMed.
| This journal is © The Royal Society of Chemistry 2023 |

