 Open Access Article
Development of a microsampler suitable for aerial collection of aerosol particles
Meng-Dawn
Cheng
 *a,
Chih-Hsiang
Chien
a,
David E.
Graham
 b and
Andrew
Harter
 c
c
aEnvironmental Sciences Division, Oak Ridge National Laboratory, Oak Ridge, TN 37831-6036, USA. E-mail: chengmd@ornl.gov; Tel: +1-865-241-5918
bBiosciences Division, Oak Ridge National Laboratory, Oak Ridge, TN 37831, USA
cGeospatial Science and Human Security Division, Oak Ridge National Laboratory, Oak Ridge, TN 37831, USA
First published on 12th January 2023
Abstract
A microsampler for collecting aerosol particles on an unmanned aerial system (UAS) was designed and evaluated in the laboratory for dry (no condensed water) and wet (foggy, misty, or rainy) air conditions. This microsampler was produced using a customized impactor design to minimize size, weight, and power requirements uniquely suitable for aerial applications, also maximize the collection efficiency above a specific cut-off size in a short time and concentrate particles for future automated analysis using microfluidics. The computational fluid dynamics (CFD) results suggested a design that provided a higher sampling efficiency with minimal inlet loss. The microsampler was experimentally evaluated using fluorescent polystyrene latex (PSL) particles at four nominal sizes. The experimental results at the four PSL particle sizes agree reasonably well with the collection efficiencies predicted by CFD. We found no effect of humidity on the collection efficiency of the microsampler under conditions at 80% relative humidity. However, when condensed water exists, significant biases on the collection efficiencies were found suggesting that this microsampler should not be used under conditions where there is condensed water in the atmosphere, e.g., foggy, misty, and rainy conditions.
Environmental significanceAn unmanned aerial system (UAS) can seek out and selectively collect aerosol particles in situ to significantly increase the signal for source identification, apportionment, and improving understandings of atmospheric science. A microsampler for collecting aerosol particles onboard the UAS would have light weight, small size, low power requirement, and have robust performance under all flight conditions. The microsampler was designed and performed reasonably well, and its collection efficiency agreed with the collection efficiencies predicted by CFD. We found that below 80% relative humidity the collection efficiency was not impacted. However, when condensed water exists, the collection efficiencies could be affected suggesting that this microsampler should not be used under conditions where there is condensed water in the atmosphere, e.g., foggy, misty, or rainy conditions. |
1. Introduction
Sampling airborne particles or particulate matter (PM), simply called “aerosols,” from an unmanned aerial system (UAS), quadcopter, balloon, airship, drone, and dropsonde requires a small and high efficiency sampler or collector. There are many commercial aerosol samplers in the market, but none that we know of meets all the requirements for being an aerial aerosol sampler. Small footprint, light weight, and low power consumption are three basic requirements. A number of air quality measurements using UASs have been reported, deploying portable gas analysers and simple particle counters or spectrometers for continuous measurements.1 However, few aerosol sampling platforms that concentrate and collect particles for specific analyses have been reported, and they are mostly used in specialized applications.Aerosol samplers designed for personal exposure studies are typically small. For example, the commercially available sioutas five-stage cascade impactor (SKC, Inc.) was designed to collect respirable particles ranging from 0.25 to 10 μm at a flow rate of 9 litres per minute (LPM).2 The impactor is reasonably small with overall dimensions of 8.6 cm × 5.5 cm and a mass of 159 g (https://www.skcinc.com/products/sioutas-five-stage-cascade-impactor; US Patent 6786105). The impactor (i.e., the main collector body itself) is suitable for applications involving monitoring human respiratory health in which case power requirement is less of an issue. Such a collector would not be desirable for an aerial aerosol sampling application3 that requires a device with overall volumetric dimensions of less than 8 cm3 and weighs less than 75 g, for example, in addition to low power requirement.
Furthermore, the sioutas impactor, like all aerosol collectors, requires a vacuum pump which in turn requires a considerable amount of current through an AC or DC power source (battery). A portable, battery-powered pump, in general, would occupy a great portion of the overall system weight and size, because of the power requirement for the impactor operation. Power supply limitations often control the cost and capabilities of UASs;4 therefore, a low pow requirement is another important consideration in the design of an aerosol sampler for aerial UAS applications.
A few miniature aerosol sizers have been designed to meet the need for extremely small and lightweight systems; thereby, these would be good candidates for aerial particle sampling. For example, a miniature virtual impactor designed to sample aerosol particles smaller than 2.5 μm was incorporated into an air-microfluidic sensor system.5 Several chip-based microfluidic sensors have been developed and tested for the toxicity measurements of aerosol particles, particularly when the toxic agents cause oxidative stress. Koehler et al.6 developed a microfluidic electrochemical sensor for measurement of the aerosol oxidative load, which could have the potential to be further developed for sensing other aerosol components. Brubaker et al.7 developed and applied a microfluidic device to investigate freezing properties of ice-nucleating particles. Liu et al.8 also explored the use of microfluidic online assay for aerosol oxidative potentials. Mei and Goldberger developed an 8-channel filter sampler for aerosol collection on a UAS platform for offline, ground-based analysis.9 Crazzolara et al. designed a 0.6 kg particle collection system composed of an air inlet, impactor, and electric blower to collect pollen and large spores (>20 μm) with an airflow of 200 LPM using a multicopter.10 Bieber et al. used both a cascade impactor (0.69 kg) and an impinger (0.57 kg) particle collector for UAS-based analyses of ice nucleation particles.11 Vacuum pumps sampled air at flow rates from 1 to 9 LPM. Alternatively, Schrod et al.12 built a programmable electrostatic aerosol collector (0.6 kg) to collect ice nucleating particles in a UAS using a pump to sample air at 5 LPM.
Microfluidic sensors require substantially smaller volumes of samples than traditional sensors for analysis and can provide near real-time results. They are ideal for autonomous airborne aerosol research applications. There has been limited development in micro aerosol samplers or collectors. A quarter-sized miniature aerosol cyclone was designed to classify particles larger than 1 μm and 0.3 μm at 300 mL min−1.13 Novosselov et al.14 developed a micro-channel collector and reported its performance at higher than 90% collection efficiency on particles greater than 1 μm using their single-loop micro-collector. Damit demonstrated a droplet-based microfluidic sensor for bioaerosol detection, with bioaerosol particles directly deposited into a droplet at the interface on a chip.15 With the advances in microfluidics detectors in the past couple of decades,16 future development of microfluidics sensors that can be coupled to a microsampler is also expected to increase.
In this paper, we report a microsampler that was developed specifically for UAS applications. The size and weight are two main constraints of the collector, which is also required to collect aerosol particles of a size greater than 1 μm but less than 10 μm in aerodynamic diameter. The UAS is to be guided and directed into a target area of interest, remotely by wireless control. We shall discuss the design and experimental evaluation of the microsampler in this paper without reference to the specific application, except to mention that we limited the weight of the microsampler for our application to no more than 25 g and overall dimensions of 2.5 cm × 2.5 cm × 1 cm. Our impactor weighs approximately 10 g in an aluminium body. The sampling flow rate is restricted to 1 LPM using a coreless brush DC diaphragm pump, a 12V DC-powered micropump (Parker Model A.1F17N1.G12VDC). The weight of the overall system (the collector plus pump and electrical wires) is 63 g. These physical dimensions of this microsampler are tabulated in Table 1.
2. Methodology
2.1 Sampler design concept
Fig. 1a displays the schematic diagram of the microsampler. The concept of the design is adopted from right-angle cascade impactors.17,18 Conventional impactor samplers such as the micro-orifice uniform deposition impactor (MOUDI) have an inlet and outlet on opposite sides, and the aerosol is forced to make a 180-degree change in direction. However, the right-angle impactor has an unconventional flow pattern, and the flow must make two 90-degree turns to leave the system. For meeting the ultrasmall footprint and weight limitation, our microsampler described in this paper needs only a one-stage impaction as compared to previous right-angle impactors that were slightly bulkier and heavier for our applications. Fig. 1b shows a 3D rendition of the cut-away view of the microsampler above the plane of the collection well and micro exit flow channel.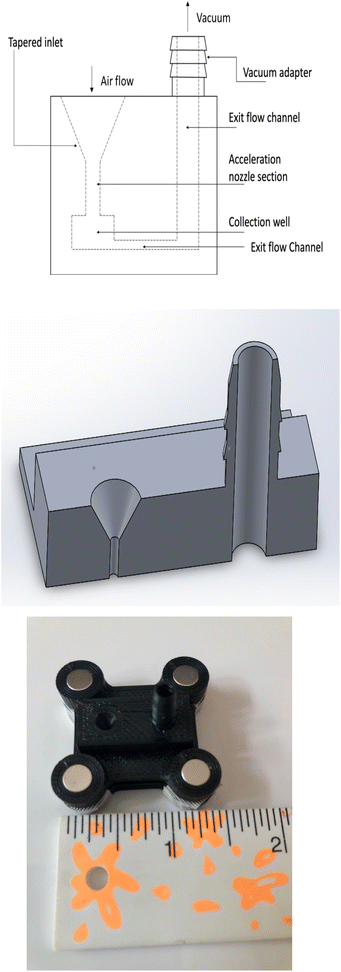 | ||
| Fig. 1 (a) Schematic diagram of a prototype micro aerosol sampler. (b) 3D rendition of the tapered inlet. (c) Photo showing a 3D-printed microsampler. The ruler is on the cm scale. | ||
Fig. 1c displays a fabricated microsampler that has a separated upper body (above the collector plane) and a lower body containing an exit microchannel and a collection well was magnetically attached. Four round N95 permanent magnets sealed both bodies and found no air leak during the evaluation process. It is important for the design of a right-angle impactor that after the flow leaves the impaction surface, the exit reduces the flow to achieve a lower velocity and prevent potential wall loss.17–21 The following sections discuss the design of the impactor and the orifice.
where St is the Stokes number, ρp is particle density, dp is the particle size, U is the free-stream jet velocity relative to the jet radius
 of the impactor, and Cc is the Cunningham correction factor accounting for the particle slippage as their size becomes smaller than the mean free path of the air molecule, e.g., 0.6 μm at 20 °C.
If the surface of the collection substrate is rigid, the Stokes number for 50% collection efficiency (St50) is 0.24 for a circular jet. The cut size or cut diameter of the impactor for the particle having a 50% collection efficiency (d50) can then be derived as:
At a design flow rate (Q) of 1.0 LPM, the sampler with a circular jet diameter (Dj) of 0.8 mm will have a jet velocity of 3316 cm s−1, and the jet Reynolds number (Re) is 1759. At 20 °C, the air viscosity is 1.81 × 10⁴ poise while the air density is 1.2 × 10⁻³ g cm−3. Therefore, the designed cut size can be calculated to be 0.97 μm, accordingly.
The impactor geometry, such as the dimensions of the jet-to-plate distance (S), can also influence the cut size and the collection efficiency curve.19 They also presented a detailed account of how an efficiency curve was affected by the particle size, jet Reynolds number, and or the ratio of the jet-to-plate distance to the nozzle dimeter (S/Dj). However, if the S/Dj was designed in the range from 1 to 10 and the Reynolds number is in the 500 to 3000 range, then the penetration curve is less sensitive to the S/Dj. Accordingly, our design value for the parameter S/Dj was chosen to be 1.875 to achieve the sharpest cut-off characteristics possible.
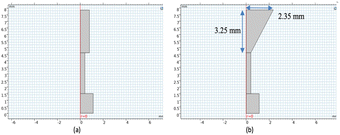
The flow field and particle tracking analyses were conducted using the computational fluid dynamics (CFD) module of the COMSOL Multiphysics V5.5 software. COMSOL solves the stationary general flow field by using a finite element method and fluid dynamics modules. The flow has a Reynolds number estimated to be 1759. Particle tracking analysis was applied to produce the theoretical collection efficiency and visualize the particle flow inside the collector. Using a symmetric, 2-D axisymmetric geometry as shown in Fig. 2, the CFD modelling domain was discretized with a fine tetrahedral mesh. Additional studies using an extra fine-resolution mesh provided by COMSOL were also conducted to investigate the impact of mesh cell resolution on the simulation result.
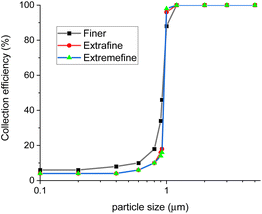
The results are shown in Fig. 3. The extra-fine resolution composed of 20![[thin space (1/6-em)]](https://www.rsc.org/images/entities/char_2009.gif) 064 tetrahedral node elements was generated automatically by COMSOL but it did not yield significant differences in the estimated collection efficiency as shown in Fig. 3. Mesh element quality and size (i.e., resolution) affect the accuracy of the numerical solution. A mesh quality of 1 indicates a perfect regular element and 0 is a degenerated element. The mesh average quality for the simulations was 0.87. The minimum quality acceptable was 0.21. Normal inflow velocity was applied to the inlet, and the design inlet flow rate was 1 LPM. Free boundary conditions were prescribed at the outlet.23 A no-slip boundary condition was applied to the wall. The flow field was solved in a steady state. To capture the major and minor flow features, the quantitative convergence tolerance was achieved at 10−6.24
064 tetrahedral node elements was generated automatically by COMSOL but it did not yield significant differences in the estimated collection efficiency as shown in Fig. 3. Mesh element quality and size (i.e., resolution) affect the accuracy of the numerical solution. A mesh quality of 1 indicates a perfect regular element and 0 is a degenerated element. The mesh average quality for the simulations was 0.87. The minimum quality acceptable was 0.21. Normal inflow velocity was applied to the inlet, and the design inlet flow rate was 1 LPM. Free boundary conditions were prescribed at the outlet.23 A no-slip boundary condition was applied to the wall. The flow field was solved in a steady state. To capture the major and minor flow features, the quantitative convergence tolerance was achieved at 10−6.24
After the steady-state flow field was constructed, a time-dependent particle tracking analysis was conducted using the COMSOL particle tracking module. The particle trajectory is calculated by integrating the particle force balance equation and the drag force and gravity force were included in the calculations. Drag force (FD) is defined as
The particle motion can be expressed as
In 1-D flow for example, the trajectory can be expressed as25
Therefore, the time step size needs to be carefully selected in the scale of particle relaxation time to ensure good simulation accuracy. In this study, the computational time step was set to be equivalent to particle relaxation time.
The 50% collection efficiency cut-off was estimated at 0.97 μm as shown in Fig. 3, consistent with the design value for a micro virtual impactor.
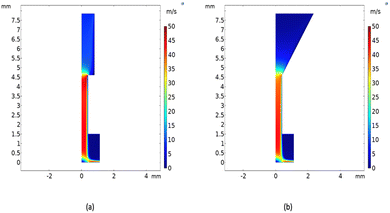
Fig. 4 shows the comparison between the velocity distributions of the two inlets. The flow fields of both inlets appear to be very similar, visually. However, a subtle difference exists and appears to be that a straight orifice led to a higher velocity (as shown in the darker red color) as the gas flow converged into the nozzle section. A higher flow velocity produces a larger inertia for larger particles, e.g., those larger than 50 μm, which could cause blockage to the micro inlet over a short time. Also, larger particle inertia could lead to particle bounce from the substrate as they impact during the collection. The higher converging velocity in the straight inlet could produce a higher loss of particles at the transition from the inlet section to the nozzle section, as we will discuss in the subsequent sections during particle tracing analyses.
 | (1) |
Fig. 5a shows the collection efficiency (ηnumerical) curves numerically constructed for the two inlet designs. For both straight and tapered inlets, the estimated 50% efficiency cut-off size was between 0.9 and 1 μm, within the tolerance of the designed value of 0.97 μm.
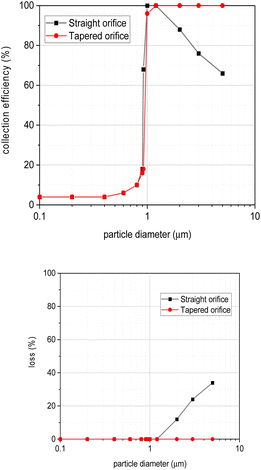 | ||
| Fig. 5 (a) The collection efficiency curves for the straight and tapered orifice inlets. (b) Calculated particle loss for the two inlet designs. | ||
The difference in the geometry of the straight inlet causes insignificant impacts on the collection efficiency compared to that of the tapered inlet as shown in Fig. 5a. Furthermore, the collection efficiency of the straight inlet decreases as the particle size (Dp) increases to be larger than the design cut size (Dpc) (see Fig. 5a). The decrease in the collection efficiency for Dp > Dpc is dramatic. As shown in Fig. 5a, it decreases from 100% for 1 μm particles to less than 70% for 5 μm particles, which is a 30% loss of collection efficiency. The loss of particles displayed in Fig. 5b is another way to suggest that the microsampler should not be used for particles of a size greater than the design cut off.
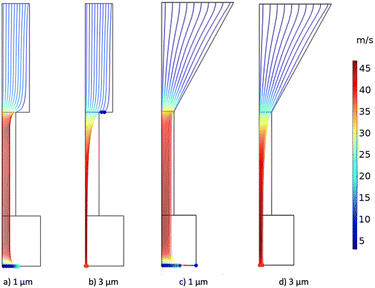 | ||
| Fig. 6 1 μm and 3 μm particle trajectories for straight and tapered inlets (the color represents the velocity magnitude). | ||
The particle trajectories in Fig. 6b illustrate that 3 μm particles were indeed deposited on the wall at the 90-degree angle turn during the transition from the inlet section to the acceleration nozzle section. This led to the particle loss we saw in the early section. The tapered inlet allows the particles to make a smooth transition into the acceleration nozzle section from the inlet section; therefore, all 3 μm particles were able to be collected on the center region of the substrate without random spreading on the substrate (see Fig. 6d).
3. Experimental
The performance of the microsampler was evaluated, experimentally. We will describe the experimental setup in the following sections. Then, we will discuss the collector performance evaluation using polystyrene latex spherical particles.3.1 Aerosolization of polystyrene latex (PSL) particles
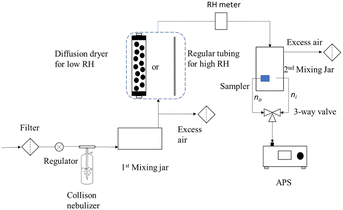
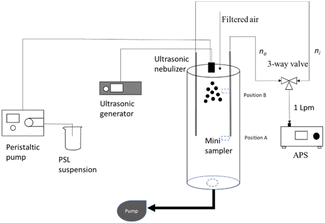
Commercially available fluorescent polystyrene latex (PSL) particles (Fluoresbrite®, Yellow Green Microspheres) from Polysciences, Inc. were used. The nominal diameters of the four monodisperse PSL particles were 0.5 μm, 0.75 μm, 1.0 μm, and 3.0 μm. These geometric sizes were taken as reported by the vendor, with typical coefficients of variation of 5–10%; sizes were not verified further in our lab. The sizes were benchmarked, however, using a TSI Model 3021 aerodynamic particle sizer (APS) in the aerosol state. Fluorescent particles were used in our study because the particle deposition pattern on the substrate in the sampler can be observed under UV light.Fig. 7 shows the experimental setup for this study. The commercial fluorescent PSL suspension was diluted with distilled, deionized water (18 MΩ) to approximately 107 particles per mL and atomized in a 3-jet Collison nebulizer. HEPA-filtered building air was supplied to a collison nebulizer to atomize the suspension to generate droplets. The relative humidity (RH) in the building air was generally 4%. 26-psi HEPA-filtered air was supplied to the collison nebulizer to generate droplets with a mass-median-diameter (MMD) of approximately 2.5 μm containing the PSL particles.26 Therefore, the supply pressure was reduced to 20 psi to generate larger than 2.5 μm droplets that could effectively contain 3 μm solid PSL particles. Other than this, 26 psi supply pressure was used throughout for generating PSL particles of 0.5, 0.75, and 1 μm.
The nebulized aerosol flow was then directed to a diffusion dryer (TSI Model 3062) to remove water from the PSL particles in the process of forming dry solid PSL test particles. A 1st mixing jar was used to trap excess water before the diffusion dryer, and also excess air was vented through a HEPA filter into a hood. A hygrometer (the RH meter in Fig. 7) was used to monitor the RH condition in the aerosol flow.
The aerosol particles after they pass the diffusion dryer were directed into a 2nd mixing jar that houses the microsampler. The number concentration measured using the APS in the 2nd mixing jar (ni) was used as the input concentration, while the number concentration measured at the outlet of the microsampler was used as no for the collection efficiency calculations [eqn (2)]. Note that an APS pump was used to draw the aerosol particles into the 2nd mixing jar and through the microsampler if a 3-way valve was turned to permit flow through the microsampler.
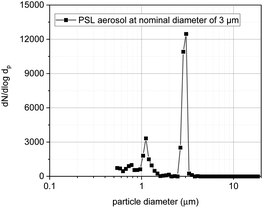
Again, the diffusion dried PSL particles were directed into a 2nd mixing jar for number concentration and size measurements using the APS (TSI model 3321). As an example, the 3 μm PSL particle population showed an APS-measured size distribution as shown in Fig. 8 as the main peak. There was a smaller peak, with a number concentration of about ¼ the size of the main peak, located at the proximity of 1 μm. We believe the small peaks could be attributed to the impurity of the prepared PSL suspension.
The pressure drop through the sampler was measured with a differential pressure gauge (Dwyer Instruments, Inc.) to be approximately 30.5 cm of water at 1 LPM. The flow rate Qo of the microsampler was set at 1 LPM. The jar flow rate Qi was slightly larger than Qo, typically less than 1%. A correction factor (CF), Qo/Qi, was used to correct the calculated collection efficiency. However, the CF value is virtually identical to unity. By applying the correction factor CF, the experimental collection efficiency (ηexperimental) was then computed as follows:
 | (2) |
3.2 Generation of mists
To investigate the performance of the microsampler under a misty condition, a separate experimental setup was established. A misty condition refers to atmospheric fog, drizzle, or rain drops. The collison nebulizer used in the previous experiments generates liquid droplets with sizes much smaller than those found in the natural environment,27 ranging from 1 micron to a few millimetres, and at a number concentration, for example, 104 cm−3.We evaluated the impacts of mists with a different generation technique that allowed the production of larger liquid droplets in the size range that mimic those of natural liquid droplets in the atmosphere. Fig. 9 shows the general setup for producing super-micrometre droplets for the experiments using an ultrasonic generator (Sono-Tek Corp.) with the 0.5 μm fluorescent PSL particles.
The median droplet size (dd) produced by the ultrasonic generator can be estimated from the following equation:28
Smaller droplets in the micron or submicron size range can rapidly evaporate, when mixed with dried purified air (water content at approximately 200 ppbv available from a ultradry air generator - the Parker Balston Model UDA-300 Compressed Air Dryer) and disappear, while the sizes of large droplets were reduced somewhat as they travel down the chamber. Two positions (labelled as position A and B in Fig. 9) were used to cursorily test the effects of different droplet sizes on the collector performance. Position A is further down in the chamber than position B; thus, evaporation of water droplets will make the liquid droplets smaller at position A than at position B, creating two size conditions for testing the interference of mists on the microsampler. Note that the tests were not designed to quantitatively evaluate the impacts on efficiency, but to learn if the impact exists.
4. Results and conclusions
4.1 Experimental evaluation of collection efficiency using dried PSL aerosol particles
This section reports the experimental collection efficiency curve and compares it to the CFD results. The nominal PSL size reported by the vendor was slightly different from the aerodynamic diameter measured by the APS. Nominal diameters of 0.75, 1.0, and 3.0 μm were measured as 0.81, 1.1, and 2.9 μm in aerodynamic diameter, respectively. The measured nominal diameters were within the 5–10% coefficient of variation for size distribution estimated by the vendor. The lower detection of the APS (TSI Model 3321) limits its ability to accurately measure the nominal 0.5 μm PSL particles. The APS was reported to have consistency issues between summing and correlated modes except for bin 1 (i.e., < 0.523 μm).29 Therefore, the counts in bins 2 and 3 (i.e., 0.542 μm and 0.583) were selected and averaged to represent the particle counts at the size of 0.56 μm.The experiments were conducted in the chamber under RH conditions of less than 30% at room temperature (ca. 20 °c). The predicted collection efficiency curve and collection efficiency calculated using experimental data for the microsampler are shown in Fig. 10. The testing results for 1.1 μm particles showed a collection efficiency of 48 ± 6% (n = 18), which was close to the designed cut size Dp50 at 0.96 μm. For particles with an aerodynamic diameter of 2.9 μm, the collection efficiency was 97 ± 0.3% (n = 5). The collection efficiency for 0.56 μm particles was 9 ± 9% (n = 4) because of high penetration of particles smaller than the design cut size of 0.96 μm.
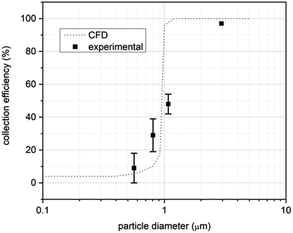 | ||
| Fig. 10 Particle collection efficiency curve from CFD and experimental data for the microsampler at ≤ 30% RH. | ||
Although Fig. 10 also shows that the experimental data generally agree with the predicted collection efficiency curve, the experimental collection efficiency for the 0.81 μm particles was 29 ± 10% (n = 22) while 10% collection efficiency was predicted. The efficiency for 0.96 μm was predicted to be 50% while the experimental value was at 48 ± 6% for the APS diameter of 1.1 μm. Knowing the variation of 5–10% in the vendor's manufactured nominal size, we would argue that the experimental efficiency of the impactor agrees well with the design value.
4.2 The effect of high RH on the collection efficiency
Due to the small transport channel passage in this sampler, droplets in misty, foggy, or cloudy air could pose detrimental effects on the sampler's performance. Furthermore, if a significant temperature gradient exists between the ambient air and the interior transport channel in the sampler, water vapor could condense on the channel wall and form droplets, potentially blocking the passageway, and thereby degrading the performance of the sampler. Thus, investigation of the humidity effect on the sampler performance is warranted.The experimental setup for the investigation of humidity effects was similar to that of the experiment described in Section 3.1. A regular stainless-steel tube (see Fig. 8) was used to replace the diffusion drier and maintain the RH in the aerosol stream at roughly 80%. Fig. 11 shows an example of the particle size distribution for the low (≤30%) and high (80%) RH conditions. Under lower humidity conditions (≤30% RH), only one peak was observed for the particle size distribution, and all particles larger than a nominal size of approximately 0.5 μm were virtually unobservable. On the other hand, particles in the size range between 0.5 and 1.0 μm were observed using the APS under the conditions of 80% RH (see Fig. 11) indicating that the PSL particles were able to adsorb water vapor onto their surface thereby growing in size. Alternatively, the particles in the size range from 0.5 to 1.0 μm could simply be the water droplets that were unable to evaporate prior to sampling and measurement by the APS since the humidity condition in the aerosol stream was high (80% RH). These results demonstrate the aerosol population that exists under two different RH conditions given the same amount of PSL particles used in the suspension fed to the atomizer.
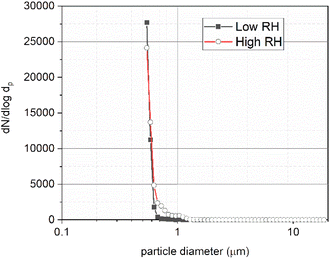 | ||
| Fig. 11 Size distribution of the PSL aerosol at a nominal diameter of 0.5 μm for the low (≤30%) and high (80%) RH conditions. | ||
The collection efficiency of 0.5 μm PSL aerosols was compared under high RH conditions against the same system operated under low RH conditions. The collection efficiency was found to be 9 ± 9% (n = 4) for the low RH conditions, while the collection efficiency was 9 ± 10% (n = 6) for the high RH conditions. Therefore, the collection efficiency of this sampler for the 0.5 μm PSL particles appears to be statistically independent of atmospheric humidity up to 80% of our experimental boundary.
Furthermore, the computational results, as displayed in Fig. 5, show that the highest gas velocity inside the sampler was about 40 m s−1, which is much slower than the speed of sound of 343 m s−1 at 20 °C. Thus, it is highly unlikely that the effect of aerodynamic cooling exists in this microsampler.30 We do not expect water vapor to condense inside the microsampler in a normal atmospheric environment where RH is less than 80%. The sampler should maintain a collection efficiency close to that predicted for environmental humidity conditions of less than or equal to 80% RH.
4.3 The effects of mists on the collection efficiency
In the previous sections, no condensed water exists in the aerosol stream in our experimental system. We now discuss the impacts of mists (condensed water) on the sampler performance in this section. APS counts for particles with 0.56 μm aerodynamic diameter were used to determine the collection efficiency. Recall that the collection efficiency of this microsampler for the particle size of 0.56 μm was 9 ± 9% in the absence of mists. The collection efficiency for the particles increased to 38 ± 3% (n = 6) at position B (farther away from the exit of the chamber), while the collection efficiency increased to 95% (n = 2) at position A (closer to the exit of the chamber). The same 0.56 μm PSL aerosol population has another sub-population that is in the supermicron size range in a greater quantity at position B than that at position A as shown in Fig. 12. Thus, the results suggest that the sampler performance was impacted and biased by this subpopulation. In other words, the presence of condensed water in the air could significantly affect the sampling performance of this microsampler. We think the wetted wall reduced the size of the inlet and thus increased the travelling speed of the particles through the nozzle thereby artificially increasing the collection efficiency. Use of this microsampler thus should be restricted to conditions where there is no condensed water existing in the atmosphere; simply, no fog, no mist, and no rain in the air.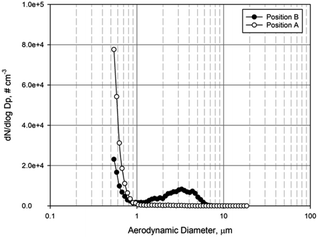 | ||
| Fig. 12 The size distribution of test aerosol populations in the test chamber at two sampling locations (Note: (A) is the location closer to the chamber exit, while (B) is close to the inlet). | ||
5. Conclusions
A microsampler for collection of aerosol particles on an aerial platform was designed and evaluated in the laboratory for dry (no condensed water) and wet (foggy, misty, or rainy) air conditions. The CFD results suggested a design that provided a higher sampling efficiency with minimal inlet loss. The microsampler was experimentally evaluated using fluorescent PSL particles at four nominal sizes. The experimental results at the four PSL particle sizes agree reasonably well with the collection efficiencies predicted by CFD. We found no impacts on the collection efficiency of the microsampler under conditions at 80% RH. However, when condensed water exists, biases on the collection efficiencies were found suggesting that this microsampler should not be used under conditions where there is condensed water in the atmosphere, e.g., foggy, misty, and rainy conditions.Disclaimer
This manuscript has been authored by UT-Battelle, LLC, under contract DE-AC05-00OR22725 with the US Department of Energy (DOE). The US government retains and the publisher, by accepting the article for publication, acknowledges that the US government retains a nonexclusive, paid-up, irrevocable, worldwide license to publish or reproduce the published form of this manuscript, or allow others to do so, for US government purposes. DOE will provide public access to these results of federally sponsored research in accordance with the DOE Public Access Plan (https://energy.gov/downloads/doe-public-access-plan).Conflicts of interest
There are no conflicts to declare.Acknowledgements
This research was supported by the Department of Defense/Defense Threat Reduction Agency of the United States of America. Chris Boring is acknowledged for assistance in the construction of the experimental chamber and Bart Murry is acknowledged for translating the CFD configuration into the CAD drawing and 3D-printing fabrication of the prototype sampler. Oak Ridge National Laboratory is managed by UT-Battelle, LLC for the U.S. Department of Energy under contract DE-AC05-00OR22725.Notes and references
- T. Francesco Villa, F. Gonzalez, B. Miljievic, Z. D. Ristovski and L. Morawska, An overview of small unmanned aerial vehicles for air quality measurements: present applications and future prospectives, Sensors, 2016, 16, 1072 CrossRef PubMed.
- C. Misra, M. Singh, S. Shen, C. Sioutas and P. M. Hall, Development and evaluation of a personal cascade impactor sampler (PCIS), J. Aerosol Sci., 2002, 33, 1027–1047 CrossRef CAS.
- M.-D. Cheng, Selective collection of airborne particulate matter, Aerosol Air Qual. Res., 2018, 18(1), 361–365 Search PubMed.
- A. Townsend, I. N. Jiya, C. Martinson, D. Bessarabov and R. Gouws, A comprehensive review of energy sources for unmanned aerial vehicles, their shortfalls and opportunities for improvements, Heliyon, 2020, 6, e05285 CrossRef PubMed.
- I. Paprotny, F. Doering, P. A. Solomon, R. M. White and L. A. Gundel, Microfabricated air-microfluidic sensor for personal monitoring of airborne particulate matter: Design, fabrication, and experimental results, Sens. Actuators, A, 2013, 201, 506–516 CrossRef CAS.
- K. A. Koehler, J. Shapiro, Y. Sameenoi, C. Henry and J. Volckens, Laboratory evaluation of a microfluidic electrochemical sensor for aerosol oxidative load, Aerosol Sci. Technol., 2014, 48, 489–497 CrossRef CAS PubMed.
- T. Brubaker, M. Polen, P. Cheng, V. Ekambaram, J. Somers, S. L. Anna and R. C. Sullivan, Development and characterization of a “store and create” microfluidic device to determine the heterogeneous freezing properties of ice nucleating particles, Aerosol Sci. Technol., 2020, 54, 79–93 CrossRef CAS.
- F. Liu, N. L. Ng and H. Lu, Emerging applications of microfluidic techniques for in vitro toxicity studies of atmospheric particulate matter, Aerosol Sci. Technol., 2021, 55, 623–639 CrossRef CAS.
- F. Mei, and L. Goldberger, Time-resolved Aerosol Filter Sampler Instrument Handbook, ARM report DOE/SC-ARM-TR-25, Pacific Northwest National Laboratory, Richland, WA, 2020 Search PubMed.
- C. Crazzolara, M. Ebner, A. Platis, T. Miranda, J. Bange and A. Junginger, A new multicopter-based unmanned aerial system for pollen and spores collection in the atmospheric boundary layer, Atmos. Meas. Tech., 2019, 12, 1581–1598 CrossRef CAS.
- P. Bieber, T. M. Seifried, J. Burkart, J. Gratzl, A. Kasper-Giebl, D. G. Schmale and H. Grothe, A drone-based bioaerosol sampling system to monitor ice nucleation particles in the lower atmosphere, Remote Sens., 2020, 12, 552 CrossRef.
- J. Schrod, D. Weber, J. Drücke, C. Keleshis, M. Pikridas, M. Ebert, B. Cvetković, S. Nickovic, E. Marinou, H. Baars, A. Ansmann, M. Vrekoussis, N. Mihalopoulos, J. Sciare, J. Curtius and H. G. Bingemer, Ice nucleating particles over the Eastern Mediterranean measured by unmanned aircraft systems, Atmos. Chem. Phys., 2017, 17, 4817–4835 CrossRef CAS.
- T.-C. Hsiao, D.-R. Chen and S. Y. Son, Development of mini-cyclones as the size-selective inlet of miniature particle detectors, J. Aerosol Sci., 2009, 40, 481–491 CrossRef CAS.
- I. V. Novosselov, R. A. Gorder, J. A. Van Amberg and P. C. Ariessohn, Design and performance of a low-cost micro-channel aerosol collector, Aerosol Sci. Technol., 2014, 48, 822–830 CrossRef CAS.
- B. Damit, Droplet-based microfluidics detector for bioaerosol detection, Aerosol Sci. Technol., 2017, 51(4), 488–500 CrossRef CAS.
- A. R. Metcalf, S. Narayan and C. S. Dutcher, A review of microfluidic concept and applications for atmospheric aerosol science, Aerosol Sci. Technol., 2018, 52, 310–329 CrossRef CAS.
- V. A. Marple, B. A. Olson and N. C. Miller, A low-loss cascade impactor with stage collection cups: calibration and pharmaceutical inhaler applications, Aerosol Sci. Technol., 1995, 22, 124–134 CrossRef CAS.
- V. A. Marple, D. L. Roberts, F. J. Romay, N. C. Miller, K. G. Truman, M. Van Oort and D. Hochrainer, Next generation pharmaceutical impactor (a new impactor for pharmaceutical inhaler testing). Part I: design, J. Aerosol Med., 2003, 16, 283–299 CrossRef PubMed.
- V. A. Marple and B. Y. H. Liu, Characteristics of laminar jet impactors, Environ. Sci. Technol., 1974, 8, 648–654 CrossRef CAS.
- V. A. Marple and K. Willeke, Impactor design, Atmos. Environ., 1976, 10, 891–896 CrossRef.
- V. A. Marple, K. L. Rubow and S. M. Behm, A microorifice uniform deposit impactor (MOUDI): description, calibration, and use, Aerosol Sci. Technol., 1991, 14, 434–446 CrossRef CAS.
- B. Jurcik and H. C. Wang, On the shape of impactor efficiency curves, J. Aerosol Sci., 1995, 26, 1139–1147 CrossRef CAS.
- S. Hari, Y. A. Hassan and A. R. McFarland, Computational fluid dynamics simulation of a rectangular slit real impactor's performance, Nucl. Eng. Des., 2005, 235, 1015–1028 CrossRef CAS.
- J. Tu, G. H. Yeoh, and C. Liu, Computational Fluid Dynamics: a Practical Approach, Butterworth-Heineman, Elsevier, Ltd, Oxford, UK, 3rd edn, 2018 Search PubMed.
- S. K. Friedlander, Smoke, Dust, and Haze: Fundamentals of Aerosol Dynamics, Oxford University Press, New York, 2nd edn, 2000 Search PubMed.
- K. R. May, The collison nebulizer: description, performance and application, J. Aerosol Sci., 1973, 4, 235–243 CrossRef CAS.
- J. H. Seinfeld, and S. N. Pandis, Atmospheric Chemistry and Physics: from Air Pollution to Climate Change, John Wiley & Sons, 2012 Search PubMed.
- S. M. Mahurin and M.-D. Cheng, Generating nanoscale aggregates from colloidal nanoparticles by various aerosol spray techniques, Nanotox, 2009, 1, 130–138 CrossRef.
- T. M. Peters and D. Leith, Concentration measurement and counting efficiency of the aerodynamic particle sizer 3321, J. Aerosol Sci., 2003, 34, 627–634 CrossRef CAS.
- P. Biswas, C. L. Jones and R. C. Flagan, Distortion of size distributions by condensation and evaporation in aerosol instruments, Aerosol Sci. Technol., 1987, 7, 231–246 CrossRef CAS.
| This journal is © The Royal Society of Chemistry 2023 |


