 Open Access Article
Creative Commons Attribution 3.0 Unported Licence
Time gated Fourier transform spectroscopy with burst excitation for time-resolved spectral maps from the nano- to millisecond range†
Mikkel B.
Liisberg
 *,
Vanessa
Rück
 and
Tom
Vosch
 *
*
Nanoscience Center and Department of Chemistry, University of Copenhagen, Universitetsparken 5, Copenhagen 2100, Denmark. E-mail: mbl@chem.ku.dk; tom@chem.ku.dk
First published on 4th October 2023
Abstract
We demonstrate burst-mode Time Gated Fourier Transform Spectroscopy (bmTG-FTS), a technique for simultaneously capturing and disentangling emission signals from short- (ns) and long-lived (μs–ms) states. We showcase the possibilities of the technique by preparing time gated temporal-spectral maps from a dual-emissive DNA-stabilized silver nanocluster (DNA-AgNC).
Among the most essential parameters for the characterization of novel luminescent materials are the spectral features, which include emission maximum and shape, and luminescence decay time.1–9 Emission spectra and decay curves are often measured under different experimental configurations. Even when recording decay curves, different equipment is often used depending on the decay time. Nanosecond decays are usually obtained with high repetition rate pulsed lasers and time-correlated single photon counting (TCSPC), while slower decays are traditionally acquired with low repetition rate pulsed Xe flashlamps.10,11 We recently demonstrated how a burst-mode excitation scheme in combination with TCSPC could be useful for simultaneously measuring the temporal response of the short- and long-lived component of a DNA-AgNC with spectrally overlapping dual emission.12–15 While this allowed for measuring temporal dynamics from the sub-ns to ms timescale in a single measurement, it did not yield any information on the spectral features.12 In another recent publication, we showed how the insertion of an interferometer in the emission path of a standard TCSPC setup allowed for collecting and disentangling the spectra of short- and long-lived components.16 In this case, however, the temporal dynamics of the long-lived component was unresolved.
In this contribution, we have effectively combined our two previously introduced methods into one,12,16 which we term burst-mode time gated Fourier transform spectroscopy (bmTG-FTS). With bmTG-FTS, a single measurement is conducted that allows for collecting spectral-temporal maps of disentangled short-lived fluorescence and long-lived luminescence contributions on the nano- to millisecond timescale. Thus, bmTG-FTS simultaneously provides some of the most important spectral and temporal parameters for the characterization of novel luminescent materials. In this paper, we will describe the working principle of bmTG-FTS and demonstrate its applicability with an exemplary DNA-AgNC that shows dual emission on the nano- to millisecond timescale.17
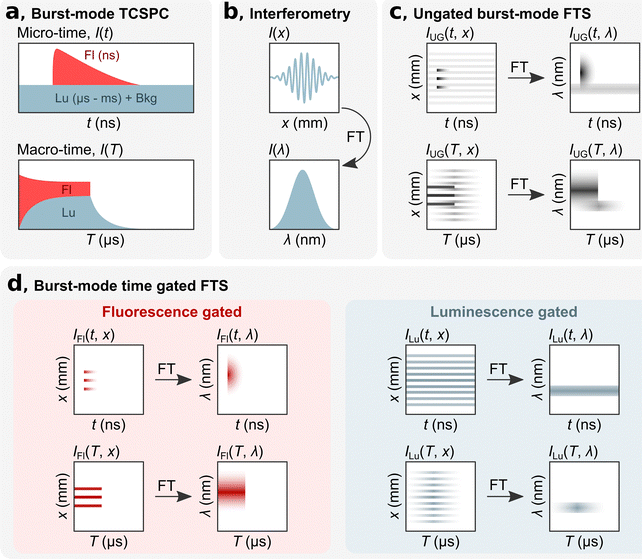
bmTG-FTS is based on three key elements: TCSPC hardware, an interferometer, and a high repetition laser (MHz) that can be switched on and off on a microsecond time scale. Using TCSPC, each detected photon is assigned a ‘micro-time’ and a ‘macro-time’ (Fig. 1a). The micro-time (t) is the time between a detection event and the next sync pulse and has a sub-ns time resolution. This time domain is commonly used for determining the decay time of short-lived fluorescence (ns) that decays within two consecutive excitation pulses. In such measurements, long-lived luminescence (μs–ms) appears as a virtually flat background along with the detector dark counts and after pulsing events. The macro-time (T) is the time between the start of the experiment to a detection event (note that what is recorded is the time of the next sync pulse). It has a time resolution equal to the reciprocal of the laser's repetition rate (e.g., 100 ns for a repetition rate of 10 MHz, or faster if an internal clock is used). This time domain can be used for measuring slower processes, like the rise and decay of a long-lived state (μs–ms).12 By implementing a burst excitation scheme, it is possible to simultaneously measure the short- and long-lived response of a luminescent species. With the combined micro-macro information, it is possible to numerically time gate the photons according to their micro-times and calculate the number of photons originating from either the short- or long-lived state/species, as depicted in Fig. 1a. More details on the burst excitation scheme and gating of photons according to their micro-times can be found in Liisberg et al.12
The spectral aspect of bmTG-FTS is obtained with a common-path birefringent interferometer (Translating-Wedge-based Identical pulses eNcoding System; TWINS). The working principle of the TWINS interferometer has been described in detail previously.18 Briefly, the TWINS interferometer is positioned in the emission path, and luminescence is passed through it. In the TWINS interferometer, the two polarization components of the emission light travel on the same path but will inhere a delay due to the birefringent medium. An interferogram is produced by recording the luminescence signal as a function of their time delay (I(x), Fig. 1b). The time delay is controlled by moving a birefringent wedge pair a distance, x. Fourier transforming (FT) the recorded interferogram and performing a series of calibrations yields the corresponding emission spectrum (I(λ)).18
By combining TCSPC with the TWINS interferometer, it is possible to record 2D temporal-spectral maps, which has previously been demonstrated in the micro-time domain.16,19,20 In the micro-time domain, it is possible to temporally disentangle spectrally overlapping signals with ease if their decay times are sufficiently distinct (e.g., a short-lived state of 1 ns and a long-lived state of 1 μs). This allows for determining the decay time of the short-lived state, but the temporal evolution of the long-lived state is not resolved due to the limited size of the time-to-amplitude (TAC) window.16
By utilizing a burst excitation scheme, it is possible to have a single technique that can simultaneously capture both spectral and temporal features on a short (ns) and long (μs–ms) timescale. To exemplify this, we consider here the hypothetical case of a dual emissive species with a short- and long-lived component. In the micro-time domain, the results are similar as to experiments performed without bursts.16 An ungated micro time-resolved interferometric map (mTRIM, IUG(t, x)) will reveal a short- and long-lived component. FT of the mTRIM yields a micro time-resolved emission map (mTREM, IUG(t, λ)) revealing two spectrally distinct bands (Fig. 1c), one decaying and synchronized with the excitation pulse and one seemingly unsynchronized and virtually flat over the time window. The addition of the burst excitation scheme allows for using the macro-time information for investigating the temporal dynamics of the long-lived component. Similar to the micro-time domain, an ungated macro TRIM (MTRIM, IUG(T, x)) is prepared, which by FT yields a macro TREM (MTREM, IUG(T, λ)). This will reveal a short-lived component that is only emissive during the on period of the burst. The long-lived component, on the other hand, will build up during the on period and decay, free from fluorescence, during the off period of the burst. While the MTREM spectrally resolves the temporal evolution of the two components on the long timescale, they might still overlap spectrally. To disentangle the two components both spectrally and temporally it is possible to gate the photons in the micro-time domain and prepare either fluorescence or luminescence gated MTRIMs (IFl(T, x) and ILu(T, x)), which by FT in turn gives the corresponding MTREMs (Fig. 1d, IFl(T, λ) and ILu(T, λ)). A description of how to gate photons in the micro-time domain and create gated MTRIMs and MTREMs is outlined in the ESI.†
For the proof of principle demonstration of bmTG-FTS, we decided to investigate a dual emissive DNA-AgNC, which we recently reported.17 This particular AgNC is stabilized by the DNA sequence, 5′-TGGACGGCGG-3′, and mass spectrometry revealed that the cluster has a molecular formula of (DNA)2[Ag18]12+.17 It has an absorption maximum at 543 nm and two emission bands, one associated with a ps decay and one with a μs decay. The ratio between the two peaks proved to be dependent on the excitation intensity, with the long-lived band decreasing at higher excitation intensities, which allowed for the realization of a molecular light intensity meter. This DNA-AgNC is ideal for demonstrating the benefits of bmTG-FTS, as many photophysical properties ideally need to be measured simultaneously to avoid undesired effects from using different experimental setups and excitation intensities.
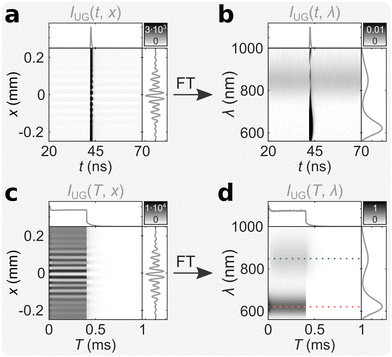
We measured an aqueous solution of (DNA)2[Ag18]12+ at room temperature with bmTG-FTS (see ref. 17 for details on the synthesis and purification method), and the corresponding ungated mTRIM is shown in Fig. 2a. FT of the mTRIM reveals two bands; a fluorescence band centered at 621 nm that is IRF limited, and a luminescence band centered at 847 nm that is constant in the entire TAC window (Fig. 2b). Because we used a burst excitation scheme (λEx = 520 nm, I = 3.4 kW cm−2, fMicro = 13 MHz, fMacro = 1 kHz, Ton = 0.4 ms, Toff = 0.6 ms, see Fig. S1 for IRF, ESI†), we can similarly prepare the ungated MTRIM (Fig. 2c), and by FT the corresponding MTREM (Fig. 2d). This shows the expected behaviour, with the fluorescence band initially decreasing until it equilibrates during the on period of the burst, while it drops steeply as soon as the burst ends (see along the red dashed line in Fig. 2d). The luminescence band, on the contrary, shows an initial rise and equilibration during the on period of the burst, as the long-lived state is being populated, while it decays when the burst ends (see along the blue dashed line in Fig. 2d). See also Fig. S2 for close-ups of the off period and Fig. S3 for intensity traces along the dashed lines (ESI†). Note that the corresponding integrated decay/interferogram/spectrum is shown alongside each TRIM/TREM.
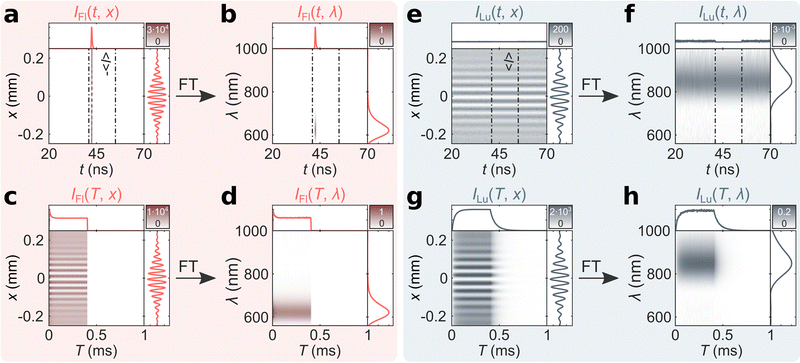
From the recorded mTRIM and MTRIM it is possible to gate the data and prepare fluorescence and luminescence gated representations. Accordingly, a time gate around 41–55 ns is defined that captures the entire fluorescence micro-time response. Using the procedure outlined in the ESI,† fluorescence and luminescence gated mTRIMs and MTRIMs are prepared (Fig. 3). Already from the mTRIMs and MTRIMs, it is possible to see that each gated representation has now effectively disentangled the temporally distinct (in the micro-time domain) signals from one another. This disentanglement is even better appreciated by calculating the mTREMs and MTREMs, which now show both the spectral and temporal evolution of the two bands separately. From the fluorescence and luminescence gated MTREMs, it is possible to extract spectra at different time points (time-resolved emission spectra) and similarly the temporal evolution of the intensity at different wavelengths. In Fig. S4 (ESI†) we show gated spectra from IFl(T, λ) and ILu(T, λ) at 200 μs (i.e., during the equilibrated part of the burst) and at 420 μs (i.e., during the off period of the burst). The gated spectra at 200 μs represents the steady state situation for both contributions. At 420 μs, there is no fluorescence signal, while the luminescence signal has decreased according to the decay time of the long-lived state. Extracting the temporal response at the fluorescence (621 nm) and luminescence (847 nm) maxima only yields discernible signals in IFl(T, λ) and ILu(T, λ), respectively. From IFl(T, 621 nm) and ILu(T, 847 nm), we tail-fit the equilibration part during the on period and calculate intensity averaged equilibrium times of 〈τFl,E〉 = 17 μs and 〈τLu,E〉 = 35 μs. Similarly, tail-fitting the luminescence decay during the off period of the burst bi-exponentially yields 〈τLu,D〉 = 59 μs (see Fig. S5 for fits, ESI†). The discrepancy between 〈τFl,E〉 and 〈τLu,E〉 indicates that this emitter does not follow the photophysics of a simple three-level model (see Fig. S6, ESI†), as has been shown for a different DNA-AgNC.15 Previously, for another DNA-AgNC, that behaves as a three-level system, we have demonstrated that 〈τFl,E〉 and 〈τLu,E〉 are similar.12,21 A final feature we would like to point out, is that with bmTG-FTS, we are able to determine the emission maxima of the fluorescence and luminescence during the burst cycle. No significant changes could be observed with respect to the emission maxima before and after reaching the steady state condition (see Fig. S7, ESI†).
 | ||
| Fig. 3 Fluorescence and luminescence gated bmTG-FTS data of (DNA)2[Ag18]12+. Fluorescence gated (a) mTRIM, (b) mTREM, (c) MTRIM, and (d) MTREM. Luminescence gated (e) mTRIM, (f) mTREM, (g) MTRIM, and (h) MTREM. 〈I〉 represents the mean luminescence intensity outside the fluorescence time gate.16 | ||
In summary, we introduced bmTG-FTS, a new technique for simultaneously capturing and spectrally disentangling the signals of both short- (ns) and long-lived (μs–ms) luminescence signals from the sub-nanosecond to millisecond timescale in a single measurement. We demonstrated the technique on a dual-emissive DNA-AgNC, from which we were able to extract essential photophysical parameters including spectral features and luminescence decay times in a single measurement.
We acknowledge financial support from the Villum Foundation (VKR023115) and the Independent Research Fund Denmark (0136-00024B).
Conflicts of interest
There are no conflicts to declare.Notes and references
- T. Wang, S. Wang, Z. Liu, Z. He, P. Yu, M. Zhao, H. Zhang, L. Lu, Z. Wang and Z. Wang, Nat. Mater., 2021, 20, 1571–1578 CrossRef CAS PubMed.
- Q. Li, D. Zhou, J. Chai, W. Y. So, T. Cai, M. Li, L. A. Peteanu, O. Chen, M. Cotlet and X. W. Gu, Nat. Commun., 2020, 11, 1–9 CrossRef PubMed.
- A. Pilch, C. Würth, M. Kaiser, D. Wawrzyńczyk, M. Kurnatowska, S. Arabasz, K. Prorok, M. Samoć, W. Strek and U. Resch-Genger, Small, 2017, 13, 1701635 CrossRef PubMed.
- C. Wehrenfennig, M. Liu, H. J. Snaith, M. B. Johnston and L. M. Herz, J. Phys. Chem. Lett., 2014, 5, 1300–1306 CrossRef CAS PubMed.
- R. Nelz, M. Radtke, A. Slablab, Z. Q. Xu, M. Kianinia, C. Li, C. Bradac, I. Aharonovich and E. Neu, Adv. Quantum Technol., 2020, 3, 1900088 CrossRef CAS.
- J. Perego, C. X. Bezuidenhout, I. Villa, F. Cova, R. Crapanzano, I. Frank, F. Pagano, N. Kratochwill, E. Auffray and S. Bracco, Nat. Commun., 2022, 13, 3504 CrossRef CAS PubMed.
- M. B. Liisberg, Z. Shakeri Kardar, S. M. Copp, C. Cerretani and T. Vosch, J. Phys. Chem. Lett., 2021, 12, 1150–1154 CrossRef CAS PubMed.
- E. D. Cosco, B. A. Arús, A. L. Spearman, T. L. Atallah, I. Lim, O. S. Leland, J. R. Caram, T. S. Bischof, O. T. Bruns and E. M. Sletten, J. Am. Chem. Soc., 2021, 143, 6836–6846 CrossRef CAS PubMed.
- J. Goedhart, L. Van Weeren, M. A. Hink, N. O. Vischer, K. Jalink and T. W. Gadella Jr, Nat. Methods, 2010, 7, 137–139 CrossRef CAS PubMed.
- J. L. Kropp and M. W. Windsor, J. Chem. Phys., 1965, 42, 1599–1608 CrossRef CAS.
- V. Rück, C. Cerretani, V. A. Neacşu, M. B. Liisberg and T. Vosch, PCCP, 2021, 23, 13483–13489 RSC.
- M. B. Liisberg, S. Krause, C. Cerretani and T. Vosch, Chem. Sci., 2022, 13, 5582–5587 RSC.
- C. Cerretani, G. Palm-Henriksen, M. B. Liisberg and T. Vosch, Chem. Sci., 2021, 12, 16100–16105 RSC.
- D. Lewis, C. Setzler, P. M. Goodwin, K. Thomas, M. Branham, C. A. Arrington and J. T. Petty, J. Phys. Chem. C, 2023, 127, 10574–10584 CrossRef CAS PubMed.
- J. T. Petty, S. Carnahan, D. Kim and D. Lewis, J. Chem. Phys., 2021, 154, 244302 CrossRef CAS PubMed.
- M. B. Liisberg and T. Vosch, Commun. Mater., 2023, 4, 57 CrossRef.
- V. Rück, M. B. Liisberg, C. B. Mollerup, Y. He, J. Chen, C. Cerretani and T. Vosch, Angew. Chem., Int. Ed., 2023, e202309760 Search PubMed.
- A. Perri, J. Phys. B: At., Mol. Opt. Phys., 2021, 54, 113001 CrossRef CAS.
- A. Perri, J. H. Gaida, A. Farina, F. Preda, D. Viola, M. Ballottari, J. Hauer, S. De Silvestri, C. D’Andrea and G. Cerullo, Opt. Express, 2018, 26, 2270–2279 CrossRef CAS PubMed.
- E. Thyrhaug, S. Krause, A. Perri, G. Cerullo, D. Polli, T. Vosch and J. Hauer, PNAS, 2019, 116, 4064–4069 CrossRef CAS PubMed.
- J. Chen, A. Kumar, C. Cerretani, T. Vosch, D. Zigmantas and E. Thyrhaug, J. Phys. Chem. Lett., 2023, 14, 4078–4083 CrossRef CAS PubMed.
Footnote |
| † Electronic supplementary information (ESI) available: Experimental and data analysis details, IRF, additional temporal and spectral data. See DOI: https://doi.org/10.1039/d3cc03961g |
| This journal is © The Royal Society of Chemistry 2023 |


