Tracking the super resolved structure of mitochondria using red emissive carbon nanodots as a fluorescent biomarker†
Richa
Garg‡
 a,
Farhan
Anjum‡
 b,
Abdul
Salam
 a,
Kush
Kaushik
 a,
Shagun
Sharma
a,
Udisha
Sahrawat
a,
Aditya
Yadav
a and
Chayan Kanti
Nandi
a,
Shagun
Sharma
a,
Udisha
Sahrawat
a,
Aditya
Yadav
a and
Chayan Kanti
Nandi
 *a
*a
aSchool of Chemical Sciences, Indian Institute of Technology (IIT), Mandi, H.P.-175005, India. E-mail: Chayan@iitmandi.ac.in
bSchool of Biosciences and Bioengineering, Indian Institute of Technology (IIT), Mandi, H.P.-175005, India
First published on 17th October 2023
Abstract
Herein, we report new red emissive highly photostable and water-soluble carbon nanodots (TPP CNDs) to visualize mitochondrial dynamics using super-resolution radial fluctuations (SRRF) microscopy. The TPP CNDs were synthesized in a one-step method, using 3-(carboxypropyl)triphenylphosphonium bromide (TPP) and o-phenylenediamine (OPDA) as precursors. The obtained crystal structure, NMR, and mass data suggested the presence of [3-(1H-benzimidazol-2-yl)propyl](triphenyl)phosphonium bromide (C28H26N2P+Br−) as a molecular fluorophore (MF) on the surface of the TPP CNDs. The TPP CNDs showed better photostability than the commercially available MitoTracker™ Green and were highly capable for long-term imaging of mitochondrial fission during hyperglycemic conditions and structural changes upon an antidiabetic drug treatment, without altering their fluorescence nature.
The advancement of fluorescence microscopy is often based on designing efficient fluorescent probes that exhibit excellent photostability, high quantum yield, brightness, and a wide emission spectral range. Super-resolution microscopy (SRM) has emerged as a valuable experimental tool that provides insightful information on the dynamics of cellular organelles. The SRM technique, however, is exclusively dependent on the availability of suitable biocompatible and cell-permeable fluorescent nanoprobes. Several fluorescent probes such as organic dyes, quantum dots,1 nanoclusters,2 nanoparticles,3 and upconversion nanomaterials4 are available. However, there are a few important drawbacks of each of them that restrict their applications in long-term imaging. Recently, CNDs have become the most promising fluorescent nanomaterials for the specific labeling of biological targets in living organisms.5 The development of such CNDs has recently attracted much attention, and extensive research efforts have been devoted to the synthesis of especially red emissive CNDs for auto-labeling without further conjugation.6,7
Mitochondria are cytosolic organelles that constantly change their shape and size, and undergo fission, fusion, and biogenesis to maintain normal cellular homeostasis.8,9 They play an indispensable role in cellular energy metabolism, apoptosis, production of metabolic energy in the form of ATP, control of stress response, and cell death signalling.10–12 There is a lot of evidence suggesting that oxidative stress contributes to the aetiology of a number of diabetic problems.13 Mitochondrial dysfunction has been found to be associated with hyperglycemia, a condition of type II diabetes.14 During diabetes or insulin resistance, the failure of insulin-stimulated glucose absorption by fat and muscle causes blood glucose concentrations to remain high.15 As a result, glucose absorption by insulin-independent organs rises. Increased glucose flow increases oxidant generation while decreasing antioxidant defences.16 Several studies have revealed a link between alteration of mitochondrial dynamics such as fusion, fission and mitophagy with diabetes.17,18 Therefore, direct visualization of the super-resolved structural changes of mitochondria below the diffraction limit is extremely crucial to shed light on their dysfunction related to diabetes. Towards this end, designing mitochondria-specific targeting probes is extremely crucial to get the ultrastructural information of mitochondrial dynamics.
TPP is a lipophilic cation known to be selectively accumulated inside the mitochondria.19 Due to mitochondrial membrane potential (MMP), TPP can decrease the free energy change during the migration from an aqueous to a hydrophobic environment of the cell; hence, TPP conjugated fluorescent probes have been designed to target mitochondria.20–22 To the best of our knowledge, previously synthesized CNDs from TPP have not been utilized to capture mitochondrial dynamics through SRM in hyperglycemic conditions. Furthermore, most of the CNDs reported to date are conjugated with TPP after their synthesis.20–22 In addition, they also suffer from long-term imaging due to their photostability issue. Hence, developing new probes with high photostability, long-term tracking capability, and biocompatibility for SRM imaging of mitochondria is urgently needed.
Herein, we report new red emissive, biocompatible, highly photostable, and water-dispersible TPP CNDs synthesized in a one-pot method using TPP and OPDA as precursors. The crystal structure, NMR, and mass spectral analysis suggested the presence of MF on the surface of the TPP CNDs. The TPP CNDs were found to be polycrystalline in nature with a graphitic core confirmed by transmission electron microscopy (TEM) and Raman spectroscopy. The TPP CNDs were more photostable than the commercially available MitoTracker Green and showed high capability for long-term SRM imaging of mitochondria without altering the fluorescence nature. The super-resolved structure down to the diffraction limit of mitochondrial fission in hyperglycemia conditions and upon treatment with an antidiabetic drug metformin was nicely captured.
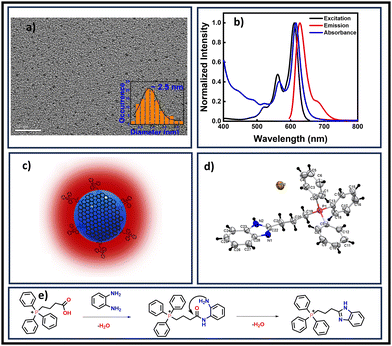
TPP CNDs were synthesized via a simple facile hydrothermal method utilizing TPP and OPDA as precursors. The details of the synthesis process have been provided in the ESI.† Both chemical and optical characterizations were performed to understand the nature of the TPP CNDs. TEM data revealed the spherical shapes of the TPP CNDs with an average size of ∼2.5 nm (Fig. 1a). Circular diffused ring patterns along with bright spots were observed during selected area diffraction (SAED) analysis, thus suggesting the polycrystalline nature of the TPP CNDs (Fig. S1, ESI†). Besides, the interlayer spacing of 0.21 nm corresponds to the 001-crystal plane of the graphitic layer. The graphitic nature of TPP CNDs was further confirmed through Raman spectra (Fig. S2, ESI†), with the typical peaks at 1390 cm−1 for the D-band and 1450 cm−1 for the G-band. AFM images of TPP CNDs reveal the topographic height to be ∼5 nm (Fig. S3, ESI†), thus indicating that TPP CNDs consist of ten to twelve single layers of graphene-like sheets. The ζ-potential was found to be +18.5 mV (Fig. S4, ESI†). The Fourier transform infrared (FTIR) spectra (Fig. S5, ESI†) exhibited broad peaks at 2700–2900 cm−1, and 2600–2450 cm−1, attributed to the aromatic sp2 C–H and aliphatic sp3 C–H stretching. In addition, peaks at 1550 cm−1, 1430 cm−1, 1182 cm−1, and 747 cm−1 were ascribed to C![[double bond, length as m-dash]](https://www.rsc.org/images/entities/char_e001.gif) N stretching, C–P stretching, C–N stretching, and
N stretching, C–P stretching, C–N stretching, and ![[double bond, length as m-dash]](https://www.rsc.org/images/entities/char_e001.gif) C–H bending, respectively. The XPS data (Fig. S6, ESI†) supported the observed functional groups in the FTIR spectra (the details of XPS data are discussed in the ESI†).
C–H bending, respectively. The XPS data (Fig. S6, ESI†) supported the observed functional groups in the FTIR spectra (the details of XPS data are discussed in the ESI†).
 | ||
| Fig. 1 (a) TEM image of TPP CNDs in aqueous solution, the average size was 2.5 nm (scale bar 20 nm). (b) Normalized UV-Visible absorption, excitation, and emission spectra. The matching of absorption and excitation spectra suggested that the emission arises from absorbing species. (c) Schematic of the proposed structure of TPP CNDs containing molecular fluorophore C28H26N2P+Br− on the surface. (d) Crystal structure of the molecular fluorophore (CCDC 2272766†). (e) Proposed possible reaction mechanism for the formation of the fluorophore from OPDA and TPP. | ||
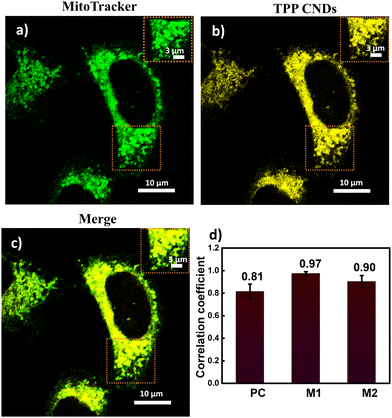
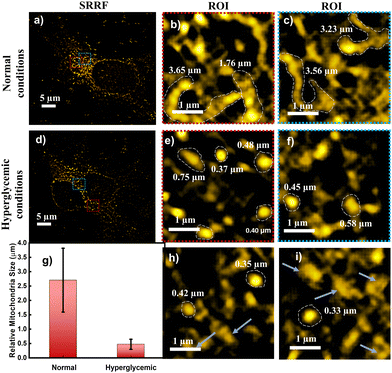
The absorption spectrum of TPP CNDs showed two peaks at 560 nm and 610 nm (Fig. 1b and Fig. S7, ESI†). The emission spectra, upon excitation at 560 nm and 610 nm, showed a peak maximum at 625 nm with a shoulder peak at 675 nm, suggesting the red-emissive nature of the TPP CNDs. The excitation spectrum upon emission at 625 nm was found to be closely matching with the absorption spectrum. These data suggested that the emission at 625 nm mainly appeared from the absorbed molecular species on the surface of the TPP CNDs. The relative quantum yield of TPP CNDs was estimated as 16% at 625 nm (Fig. S8, ESI†). It should be mentioned that TPP CNDs typically show excitation-dependent multicolor emission spectra. Surprisingly, the emission spectra at 625 nm showed excitation-independent behavior; however, an excitation dependency appeared in the blue region, which was already discussed in earlier reports.23 We carried out thermogravimetric analysis (TGA) of the sample, and the data (Fig. S9, ESI†) showed approximately 50% mass loss from 150 °C to 250 °C and another 20% mass loss from 250 °C to 360 °C. These results confirm the presence of thermally less stable and volatile MFs present on the surface. Furthermore, a gradual weight loss from 350 °C to 800 °C indicated the highly stable graphitic core, as confirmed by the Raman, TEM, and AFM data. We carried out the characterization of the TGA-treated sample and found out that the absorption spectral signature at 560 nm and 625 nm nearly vanished (Fig. S10, ESI†). In addition, the QY at 625 nm of the TPP CNDs drastically reduced to ∼1%, suggesting that the molecular state is mainly responsible for the emission in the TPP CNDs. Furthermore, the emission envelope that appeared in the Raman spectrum completely vanished, and only the D and G bands appeared. These results further support the presence of a molecular state mainly responsible for the emission in TPP CNDs. The TEM data confirm the CND-like nature of the TGA-treated sample (Fig. S10c, ESI†). Based on the above observation, we proposed the structure of the TPP CNDs as presented in Fig. 1c. We were able to obtain the crystal of the purified sample. The single crystal X-ray diffraction (SCXRD) analysis suggested the structure as C28H26N2P+Br− (Fig. 1d). It showed a triclinic lattice with a small asymmetric unit with dimensions of 0.419 × 0.264 × 0.182 mm3 and a volume of 1366.48 Å3. The SCXRD of the MF also shows that the positively charged phosphonium cation is balanced by the negatively charged bromide ion, making the molecule neutral (Fig. S11 and Table S1, ESI†). Moreover, the crystal packing analysis of the fluorophores along all three axes illustrates that the molecules are arranged in the center of symmetry manner (Fig. S12, ESI†). The asymmetric unit contains 1.408 g cm−3 density and the molecular formula was obtained as C28H26N2P+Br− (M = 579.28 g mol−1). The 1H-NMR (Fig. 1e and Fig. S13, ESI†) and 13C-NMR spectroscopy (Fig. S14, ESI†) reveals the cyclization of TPP and OPDA to form MF. Furthermore, the structure of MF has also been confirmed utilizing high-resolution mass spectrometry (Fig. S15, ESI†), with the m/z value at 421.2 matching with the observed mass 421.2. We next examined the cell viability of TPP CNDs through an XTT assay using HeLa cells. The data as presented in Fig. S16 (ESI†) showed that the TPP CNDs are almost non-toxic within 50 μg ml−1 concentration of the sample. We also carried out ROS generation and found no remarkable change in ROS production compared to that of the control experiment (Fig. S17, ESI†). Thus, TPP CNDs were found to be highly biocompatible with the cellular environment. To validate the mitochondrial targeting of TPP CNDs, we performed the colocalization experiment using commercial MitoTracker Green (Fig. 2). The images unveiled that TPP CNDs are highly specific to mitochondria due to the electrostatic interaction of the negative potential of the MMP and positive charge of the TPP CNDs. The Pearson's correlation coefficient (PCC) was found to be greater than 0.8 and Mander's overlap coefficient was found to be 0.97 and 0.90 for M1 and M2. All these results demonstrated that TPP CNDs target the mitochondria very efficiently in live HeLa cells. We also carried out a comparative photostability study (Fig. S18, ESI†) and found that TPP CNDs are better than MitoTracker Green at least for 30 minutes of measurement of the sample. SRM has been revolutionized to get the ultrastructural information of various biological events. To get the SRM images of mitochondrial dynamics labeled with TPP CNDs, we carried out SRRF microscopy with the custom-built setup (the details are provided in the ESI†). The resulting SRRF images of mitochondria stained with TPP CNDs in HeLa and HepG2 cells showed nice long thread-like structures of mitochondria with a diameter of ∼260 nm and average length of approximately ∼2.3 μm (Fig. S19, ESI†). We further carried out SRRF imaging of mitochondrial dynamics under hyperglycemic conditions to show the capability of the TPP CNDs as an efficient fluorescent probe to capture the changes that happened during the treatment. Fig. 3 and Fig. S20, S21 (ESI†) show the comparative SRRF images of mitochondria in normal and hyperglycemic conditions in HepG2 cells. It is interesting to point out here that the mitochondria in normal conditions showed large thread-like structures as long as up to 3.5 μm. In comparison, in hyperglycemic conditions, small ball-like structures with a maximum size of 0.75 μm and a minimum size of 0.35 μm were observed. These results suggested that in hyperglycemic conditions, mitochondria underwent extensive fission reaction, which produced a large number of small and fragmented mitochondria. We further found that the mitochondria were destined around the nucleus with long filaments in normal conditions. In contrast, the fragmented mitochondria were found to be distributed across the cytoplasm in hyperglycemic conditions. In addition, we observed several diffused and distorted mitochondrial entities, thus suggesting extensive morphological changes in hyperglycemic conditions (Fig. 3e, f, h, and i). We carried out a statistical size analysis of the mitochondrial size in normal and hyperglycemic conditions of ∼50 mitochondria in each condition. We analyzed the entire cytoplasmic region of the cell to capture a holistic view of mitochondrial distribution within cells and to minimize potential biases from focusing on specific regions. To our surprise, the average size of mitochondria was observed to be ∼2.7 μm in normal conditions, while in hyperglycemic conditions, it was observed to be 0.5 μm (Fig. 3g).
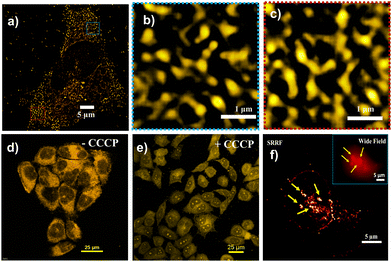
Finally, we applied SRRF imaging to observe mitochondrial dynamics stained with TPP CNDs after metformin exposure, a well-known antidiabetic drug, and upon treatment with carbonyl cyanide m-chlorophenylhydrazone (CCCP), a very well-known mitophagy inducer. Metformin is reported to improve mitochondrial respiratory activity by suppressing liver glucose production and enhancing activation of the AMPK pathway.23 In this condition, enhanced mitochondrial fission occurs due to enhanced activation of AMPK (Fig. 4a–c and Fig. S22, ESI†). On the other hand, an interesting observation was found, that is the migration of TPP CNDs from mitochondria to the nucleolus and to some extent nucleus when treated the HeLa cells with CCCP (Fig. 4d and e). CCCP is known to reduce the MMP; hence, the electrostatic binding of TPP CNDs weakens and they are released from the mitochondria. Nucleoli, with their highly negative charge, accommodate TPP CNDs with greater affinity.24 The super resolved SRRF image of the event of nucleolus staining under CCCP treatment has been shown in a cell in Fig. 4f.
In conclusion, new red emissive, highly photostable, water-soluble TPP CNDs were synthesized for the first time for super-resolution imaging of mitochondrial dynamics under various intracellular environmental conditions. The crystal structure, NMR, and mass spectral analysis suggested the presence of MF on the surface of the TPP CNDs, which is mainly responsible for the red emission. The TEM, RAMAN, and AFM data confirm the polycrystalline graphitic core structure in TPP CNDs.
RG designed and performed synthesis and photophysical experiments with the help of US and SS. FA optimized all cellular experiments with the help of RG. AS analyzed the NMR, Mass, and crystal structure of MF. KK helped in the analysis of SRRF images. AY performed Raman spectroscopy. RG wrote the article with the help of CKN. CKN supervised the whole project. CKN and AY thank SERB (Project No. IITM/SERB/CKN/310) and CSIR [CSIR SRF:09/1058(0014)/2019-EMR-I] respectively.
Conflicts of interest
The authors declare no conflicts of interest.Notes and references
- K. Kaushik, A. Yadav, F. Anjum, P. Mani Mishra, S. Sharma, C. Rao and C. Kanti Nandi, ChemNanoMat, 2022, 8, e202200235 CrossRef CAS.
- A. Yadav, N. C. Verma, C. Rao, P. M. Mishra, A. Jaiswal and C. K. Nandi, J. Phys. Chem. Lett., 2020, 11, 5741–5748 CrossRef CAS PubMed.
- W. Li, G. S. Kaminski Schierle, B. Lei, Y. Liu and C. F. Kaminski, Chem. Rev., 2022, 122, 12495–12543 CrossRef CAS PubMed.
- S. Wen, J. Zhou, K. Zheng, A. Bednarkiewicz, X. Liu and D. Jin, Nat. Commun., 2018, 9, 2415 CrossRef PubMed.
- Z. Yang, H. Li, T. Xu, M. She, J. Chen, X. Jia, P. Liu, X. Liu and J. Li, J. Mater. Chem. A, 2023, 11, 2679–2689 RSC.
- M. Moniruzzaman and J. Kim, Nanoscale, 2023, 15, 13858–13885 RSC.
- X. Zhang, L. Chen, Y. Y. Wei, Y. Z. Yang, X. G. Liu, J. L. Du, Q. Li and S. P. Yu, Fullerenes, Nanotubes Carbon Nanostruct., 2020, 29, 394–406 CrossRef.
- D. Sebastián, M. Palacín and A. Zorzano, Trends Mol. Med., 2017, 23, 201–215 CrossRef PubMed.
- M. Liesa and O. S. Shirihai, Cell Metab., 2013, 17, 491–506 CrossRef CAS PubMed.
- H. Vakifahmetoglu-Norberg, A. T. Ouchida and E. Norberg, Biochem. Biophys. Res. Commun., 2017, 482, 426–431 CrossRef CAS PubMed.
- M. Klingenberg, Biochim. Biophys. Acta, Biomembr., 2008, 1778, 1978–2021 CrossRef CAS PubMed.
- I. Manoli, S. Alesci, M. R. Blackman, Y. A. Su, O. M. Rennert and G. P. Chrousos, Trends Endocrinol. Metab., 2007, 18, 190–198 CrossRef CAS PubMed.
- F. Giacco and M. Brownlee, Circ. Res., 2010, 107, 1058–1070 CrossRef CAS PubMed.
- J. S. Bhatti, G. K. Bhatti and P. H. Reddy, Biochim. Biophys. Acta, Mol. Basis Dis., 2017, 1863, 1066–1077 CrossRef CAS PubMed.
- A. E. Civitarese and E. Ravussin, Endocrinology, 2008, 149, 950–954 CrossRef CAS PubMed.
- R. A. Kowluru and P.-S. Chan, Exp. Diabetes Res., 2007, 2007, 1–12 Search PubMed.
- T. Finkel and N. J. Holbrook, Nature, 2000, 408, 239–247 CrossRef CAS PubMed.
- W. Wang, Y. Wang, J. Long, J. Wang, S. B. Haudek, P. Overbeek, B. H. J. Chang, P. T. Schumacker and F. R. Danesh, Cell Metab., 2012, 15, 186–200 CrossRef CAS PubMed.
- J. Zielonka, J. Joseph, A. Sikora, M. Hardy, O. Ouari, J. Vasquez-Vivar, G. Cheng, M. Lopez and B. Kalyanaraman, Chem. Rev., 2017, 117, 10043–10120 CrossRef CAS PubMed.
- Y. Wang, D. Zhou, H. Huang, Y. Wang, Z. Hu and X. Li, J. Mater. Chem. B, 2019, 7, 3737–3744 RSC.
- Y. Zhang, Y. Shen, X. Teng, M. Yan, H. Bi and P. C. Morais, ACS Appl. Mater. Interfaces, 2015, 7, 10201–10212 CrossRef CAS PubMed.
- B. Wang, Y. Wang, H. Wu, X. Song, X. Guo, D. Zhang, X. Ma and M. Tan, RSC Adv., 2014, 4, 49960–49963 RSC.
- N. Soni, S. Singh, S. Sharma, G. Batra, K. Kaushik, C. Rao, N. C. Verma, B. Mondal, A. Yadav and C. K. Nandi, Chem. Sci., 2021, 12, 3615–3626 RSC.
- S. Guo, Y. Sun, J. Li, X. Geng, R. Yang, X. Zhang, L. Qu and Z. Li, ACS Appl. Bio Mater., 2021, 4, 928–934 CrossRef CAS.
Footnotes |
| † Electronic supplementary information (ESI) available. CCDC 2272766. For ESI and crystallographic data in CIF or other electronic format see DOI: https://doi.org/10.1039/d3cc03390b |
| ‡ RG and FA contributed equally to the work. |
| This journal is © The Royal Society of Chemistry 2023 |


