A microfluidic electrophoretic dual dynamic staining method for the identification and relative quantitation of dsRNA contaminants in mRNA vaccines†
Adriana
Coll De Peña
 a,
Nina
Li
a,
Matei
Vaduva
a,
Lloyd
Bwanali
b and
Anubhav
Tripathi
a,
Nina
Li
a,
Matei
Vaduva
a,
Lloyd
Bwanali
b and
Anubhav
Tripathi
 *a
*a
aCenter for Biomedical Engineering, School of Engineering, Brown University, Providence, RI, USA. E-mail: anubhav_tripathi@brown.edu
bApplied Genomics, Revvity, Hopkinton, MA, USA
First published on 7th July 2023
Abstract
mRNA vaccines (i.e., COVID-19 vaccine) offer various advantages over traditional vaccines in preventing and reducing disease and shortening the time between pathogen discovery and vaccine creation. Production of mRNA vaccines results in several nucleic acid and enzymatic by-products, most of which can be detected and removed; however, double-stranded RNA (dsRNA) contaminants pose a particular challenge. Current purification and detection platforms for dsRNA vary in effectiveness, with problems in scalability for mass mRNA vaccine production. Effectively detecting dsRNA is crucial in ensuring the safety and efficacy of the vaccines, as these strands can cause autoimmune reactions with length-symptom dependency and enhance mRNA degradation. We present a new microfluidics method to rapidly identify and quantify dsRNA fragments in mRNA samples. Our innovation exploits the differences in the dynamic staining behavior between mRNA and dsRNA molecules to detect dsRNA contaminants in a high throughput approach. The limit of detection of the system for dsRNA was estimated to be between 17.7–76.6 pg μL−1 with a maximum loading capacity of mRNA of 12.99 ng μL−1. Based on these estimated values, our method allows for the detection of dsRNA contaminants present in percentages as low as 0.14–0.59% compared to the total mRNA concentration. Here, we discuss the molecular mechanism of the dynamic staining behavior of dsRNA and mRNA for two different stains. We believe our method will accelerate the mRNA vaccine development from initial development to quality control workflows.
Introduction
Vaccines have been a crucial public health measure in preventing and reducing diseases, morbidity, and mortality by millions each year.1 Vaccine importance has been highlighted by the COVID-19 pandemic and the widespread use of newly developed mRNA vaccines. Despite early bottlenecks, much research has gone into nucleic acid-based vaccines due to their ability to provide precise targeting of the immune response and offer advantages in safety, efficiency, and specificity when compared to other vaccine platforms.2,3 mRNA vaccines, specifically, offer benefits including extranuclear activity, which confers a minimal risk for subsequent random genome integration and insertional mutagenesis, more controlled expression of coded antigen, no inclusion of foreign genes, and the ability to be produced in a cell-free environment by in vitro transcription.2,4 If this technology is harnessed for widespread and large-scale use, mRNA vaccine application could extend to cancer therapies, therapeutic protein replacement therapies, treatment of genetic diseases, and a wide variety of infectious diseases.2,4 Recent advances in lipid nanoparticles (LNP) and mRNA technology over the years have increased the stability and efficacy of mRNA–LNP vaccines.4–6However, contaminants such as leftover enzymes, free nucleotides, residual DNA, truncated RNA, and dsRNA are also possible during the synthesis of the mRNA.3 These exogenous contaminants, specifically dsRNA, identified as a major contaminant, are potent pathogen-associated molecular patterns (PAMPs). The creation of dsRNA in the in vitro transcription (IVT) production of mRNA is believed to stem from the activity of T7 RNA polymerase.7 When recognized, PAMPs can lead to the inhibition of translation and the enhancement of mRNA degradation. dsRNA contaminants can also activate pro-inflammatory cytokines associated with potential autoimmune reactions, including effects on the central nervous system.3,8–10 Additionally, there appears to be a positive correlation between dsRNA fragment length and the associated adverse effects,11 suggesting that careful monitoring of both the presence and length of dsRNA fragments is required to ensure the safety of the vaccine.
Despite current purification platforms, there remains a lack of well-established manufacturing platforms for mRNA, thus numerous mRNA synthesis and purification techniques are generally combined.4 The pharmaceutical industry often utilizes different forms of chromatography coupled with tangential flow filtration for purification due to its versatility, cost-effectiveness, selectivity, and, importantly, its ability to be upscaled for mass production of mRNA vaccines.4 However, different forms of this technique come with their limitations. For example, ion pair reverse phase chromatography is an excellent purification method that removes dsRNA while maintaining a high yield, but it is very costly to scale and uses toxic reagents such as acetonitrile.4,12 Conversely, anion exchange chromatography can be used to purify mRNA at a large scale cost-effectively, but it often requires denaturing conditions, tight control of temperature, and the use of potential chaotropic agents.4 Lastly, high-performance liquid chromatography has been shown to remove dsRNA and other contaminants, resulting in a 10- to 1000-fold increase in protein production levels upon vaccination.13 Still, there are issues with the purification scale-up process and mRNA stability.12
However, despite the presence of various purification platforms, some having evidence of dsRNA removal of over 90%,14 the variability in quality and effectiveness of current methods call for quality assessment and quality control systems for detecting residual and harmful dsRNA fragments in mRNA vaccines. Currently preferred quality control detection assays for characterizing RNA transcripts include UV spectroscopy, fluorescence-based assays, immunoassays, and chromatography. However, these are severely limited by resolution, precise handling, hazardous reagents, intense labor, need for antibodies, long run time, or inability to be scaled,12,15–18 leaving a critical need for fast, high throughput, low-cost quality control systems.
The versatility of microfluidics allows for the fast development of novel analytical methodologies to monitor the effectiveness of the purification methods and ensure the safety of the mRNA vaccines. Furthermore, as a result of the miniaturization of traditional biomolecular analysis tools, the decrease in overall scales offers precise control of fluids, high-throughput capabilities, and rapid sample processing, making it capable of outperforming traditional technologies, often leading to lower-cost alternatives.19,20 To obtain such fine control over the dynamics within the system, microfluidics is usually coupled with a driving force. Here, we use electrokinetics as the driving force as it exploits unique behaviors that would not be easily achievable at a larger scale. Here, we present a high-throughput microfluidic electrophoresis methodology that exploits the differences in fluorescent staining kinetics between dsRNA and mRNA to detect and characterize dsRNA contaminants in mRNA vaccines.
Materials and methods
Sample and sample preparation
The ssRNA (catalog #N0364S) and dsRNA ladders (catalog #N0363S) used in this study were purchased from New England Biolabs (New England Biolabs, Ipswich, MA). The mRNA and dsRNA samples were custom ordered from Genewiz (Genewiz Genomics Headquarters, South Plainfield, NJ) and have 4001 nt and 4001 bp lengths, respectively. The sequence of the custom samples can be found in the ESI (ESI, sequence†).Microfluidic system and chip reagents
A custom glass nucleic acid (NA) microfluidics chip (Revvity, Waltham, MA) with a metal sipper was interfaced with the high throughput LabChip GX Touch II platform (Revvity) for robotics motion, electrical, and flow controls. Two different far-red fluorescent stains (SYTO 61 as a DNA stain and RiboRed as an RNA stain; ThermoFisher Scientific Inc., Waltham, MA) were obtained from Revvity and utilized at varying concentrations (Fig. S1–S3†). These stains were selected because dsRNA will have the uracil (or chemically modified uracil) bases that are characteristic of RNA but a structure more similar to DNA, both of which could influence the labeling behavior of dsRNA. Therefore, both stains were evaluated to investigate which nucleic acid type dsRNA simulated more closely in terms of fluorescent staining. Different concentrations of poly(N,N-dimethylacrylamide) (Revvity) were used, as specified throughout the study, to load the microfluidic channels after mixing with the fluorescent stain of interest. A custom lower maker (Revvity) was loaded onto one of the chip wells and injected using a combination of pressure and electrokinetics for electropherogram alignment.Methods
Depending on the requirements of the experiments, the NA samples were diluted in nuclease-free water to achieve the desired concentration and maintain the total salt concentration <150 mM and were transferred onto a 96- or 384-well plate. The NA microfluidic chip was loaded with the gel-dye mixture of interest and the lower marker. The well plate and the chip were then transferred onto the LabChip platform for analysis. Once the optimal assay conditions were established, the sample plate was analyzed in a chip loaded with a SYTO 61 gel matrix, and upon completion, the same sample plate was analyzed using the same chip loaded with a RiboRed gel matrix, or vice versa; stain analysis order does not affect the results (Fig. 1). The statistical analyses included in this study were conducted on GraphPad Prism 9.4.1 with a confidence interval of 95% where *p < 0.05, **p < 0.01, ***p < 0.001, ****p < 0.0001. | ||
| Fig. 1 Sample preparation and analysis workflow for the detection of dsRNA contaminants in mRNA samples and vaccines. Figure assembled/created using BioRender.com. | ||
Results and discussion
Understanding the differences between dsRNA and ssRNA
Fundamental experiments in this study were conducted with a dsRNA ladder to simulate dsRNA contaminants and an ssRNA ladder to simulate mRNA. The findings from these experiments were then used as a reference or starting point for the analysis of the custom-ordered long (4001 bp or nt) dsRNA and mRNA samples. Long dsRNA and mRNA molecules are not readily available, particularly highly purified, and limited information regarding the electrokinetic response of those samples is available in the literature.The first step was to characterize the mobilities and fluorescent staining response of ssRNA and dsRNA with respect to heating (Fig. S1†) and fluorescent stain type (SYTO 61 and RiboRed; Fig. S2†). Generally, ssRNA molecules are heated before analysis to prevent the presence of multimeric forms and tertiary structures from interfering with their mobility.21 However, upon analyzing both ssRNA and dsRNA, it was observed that while heat resulted in better-defined peaks for the ssRNA sample, it also denatured smaller strands of dsRNA, causing the fabrication of dsRNA peaks. Acknowledging that numerous techniques exist for the analysis of mRNA molecules and that the focus of this study is to characterize dsRNA contaminants, heating was excluded to optimize the conditions for dsRNA identification. Next, Fig. S2† shows the fluorescent response of a single dsRNA and ssRNA fragment at various SYTO 61 and RiboRed concentrations. Based on the dsRNA signal output, the optimal concentrations were 2.92% for SYTO 61 and 15.00% for RiboRed. Lastly, Fig. S3† shows a snapshot of migration times as a function of gel concentration. The optimal gel concentration, 3%, was picked based on fragment migration time and peak width to ensure assay resolution. When the gel was lowered to 3%, the new stain optimal concentrations were determined to be 1.17% and 15% for SYTO 61 and RiboRed, respectively, to achieve better repeatability dynamic staining under the new gel concentration.
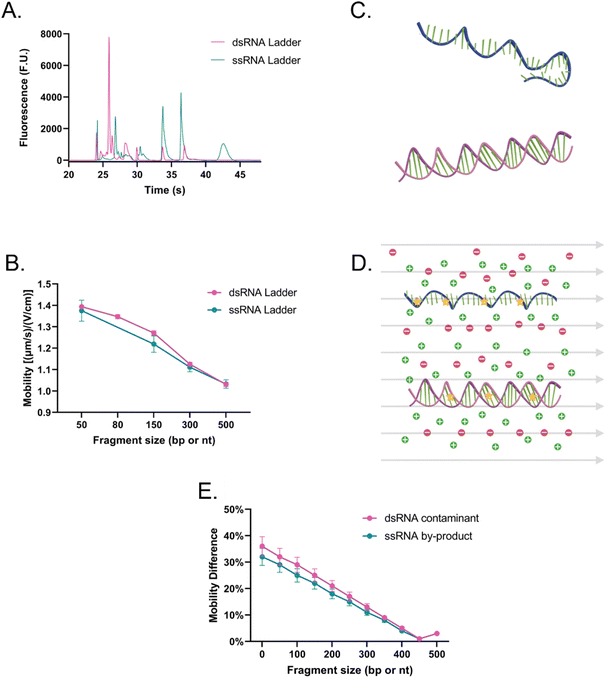
Then, the dsRNA and ssRNA ladders were analyzed using the microfluidic electrophoresis chip platform, and the following electropherograms were yielded (Fig. 2A). No significant difference in mobility was observed between the two RNA types (Fig. 2B and Table S1†) within this size range (50–500 bp or nt) at our gel concentration of 3% poly(N,N-dimethyl acrylamide). However, during preliminary experiments with a 6% gel, ssRNA had slower mobility than dsRNA on average (Fig. S1†). To better understand these findings, we investigated further the main sample factors that affect their mobility (μ) within our microchannel loaded with a semidilute polymer solution. For simplification purposes, this relation has been represented in terms of net drag (D) and net charge (q) as:
ssRNA is generally more prone to forming tertiary structures than dsRNA (Fig. 2C); however, during electrophoresis, the electric field can stretch and reorient nucleic acid molecules in the direction of the field, especially in the case of shorter chains (Fig. 2D).22 As a result, it is likely that the mobility of ssRNA will be less affected by its tertiary structure in the case of shorter chains, while longer ones may see an impact. In contrast, due to the presence of a second strand in dsRNA, under conditions where ssRNA is straightened, dsRNA may have a bulkier conformation and experience more drag than ssRNA. Persistence length (lp), which represents the stiffness of a molecule, also plays a key role in sample fragment mobility. It has been reported that dsRNA lp ranges from 62–72 nm,23,24 while that of ssRNA ranges from 0.5–1.27 nm.25,26 Generally, a lower persistence length will enable the molecule to migrate more easily through the matrix, giving the advantage to ssRNA.27 However, when the focus is shifted to the contribution of the charge on the mobility instead since the charge density of dsRNA is greater than that of ssRNA, dsRNA is expected to migrate faster through the system.28
Given that at lower gel concentrations within the 50–500 base range, there is no observable difference between the two molecule types, but that at higher gel concentrations there is, the data suggests that at low gel concentrations, shorter ssRNA fragments can be straightened and orient to themselves to the electric field and through the contribution of its persistent length can migrate at the same velocity as dsRNA, despite the latter being favored by having a charge that is approximately twice in magnitude. However, the data also suggests that at higher gel concentrations, despite its higher flexibility, through a combination of its tertiary structure and having less charge than a dsRNA molecule of the same length, ssRNA migrates slower, expanding the current knowledge of how these molecules migrate in comparison to each other in microfluidic electrokinetic systems.29,30
However, despite the ability to induce a mobility difference via gel concentration, it was determined that mobility alone could not be used to identify dsRNA contaminants. During the synthesis of IVT-mRNA, both truncated ssRNA fragments (<mRNA length) and, over time, degraded mRNA fragments (<mRNA length) can be present in the sample, which, despite a mobility difference can overlap with the dsRNA contaminants (≤mRNA length; Fig. 2E). This led us to explore alternative methods of differentiation and identification.
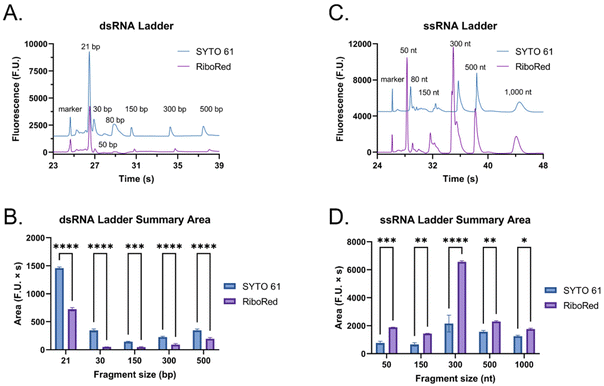
The main difference that stood out upon closer examination of the data was that despite both ladders being expected to have similar total RNA concentrations, most fragments in the ssRNA ladder fluoresced brighter than those in the dsRNA ladder, like in earlier findings (Fig. S2†). Due to the overlaps in structure between dsRNA and dsDNA and in biochemistry between dsRNA and ssRNA, we explored both SYTO 61 (DNA stain) and RiboRed (RNA stain) for the fluorescent visualization of our molecules. Experiments were conducted using the previously determined concentrations where a dsRNA and an ssRNA ladder were analyzed separately after exposure to each stain. Again, we noticed that the overall fluorescence of the ssRNA peaks was higher than those of the dsRNA peaks, but more interesting than that, we noticed that the way the ladders responded to the fluorescent stains was opposite to each other. While dsRNA ladder fragments generally produced lower degrees of fluorescence than ssRNA ladder fragments when labeled with both stains, we noticed the following trend: when dsRNA was exposed to SYTO 61, the dynamic staining was more effective than that offered by RiboRed while the ssRNA stained better with RiboRed (Fig. 3 and Tables S2, S3†).
In fact, when comparing the areas yielded by each stain, on average, the dsRNA ladder yielded an area 56% greater with SYTO61 than with RiboRed, while the ssRNA ladder yielded an area 118% greater with the RiboRed dye. Interestingly, while the same trend was observed in the peak area and peak height for each fragment size, 10/10 peak areas showed a statistical difference, whereas only 7/10 peak heights (Fig. S4†) did. This suggests that peak area may be a better indicator when assessing the effect of different fluorescent stains. This is the first evidence we obtained that suggested differential dynamic staining kinetics across the two types of ribonucleic acid molecules could be used to identify dsRNA in mRNA vaccines.
Assessing translation of findings to long dsRNA and mRNA fragments
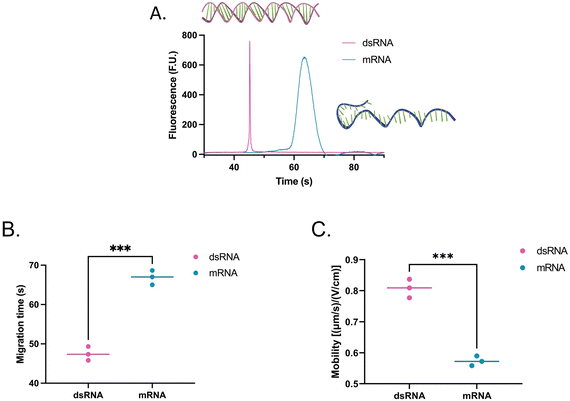
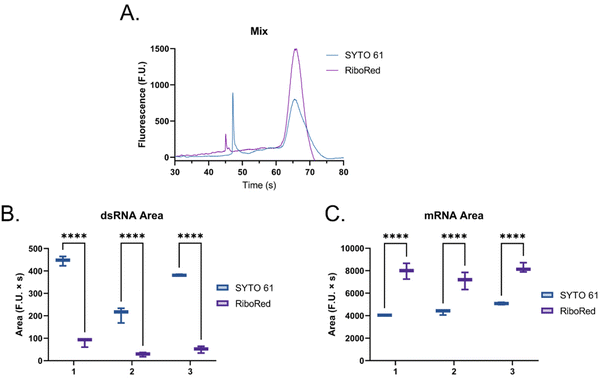
To assess whether the findings made using the shorter dsRNA and ssRNA fragments were also applicable to long fragments (4001 bp or nt), we analyzed a long dsRNA and a long mRNA molecule with the same sequence (ESI, sequence†) using our system. Interestingly, unlike with shorter fragments, Fig. 4 suggests that there is a significant difference in mobility between long dsRNA and mRNA molecules. This is supported by our hypothesis that shorter ssRNA fragments are more easily straightened than longer fragments. As a result, longer ssRNA or mRNA fragments will have a slower mobility since they experience a higher conformation-induced drag with no charge density increase relative to a dsRNA of equivalent length.Moreover, while the dsRNA sample had a concentration of 2.60 ng μL−1 and the mRNA 5.90 ng μL−1, instead of showing an increase in area equivalent to the change in concentration (2.3 times) between the two, on average, the area of the mRNA sample was 9.6 times greater than that of the dsRNA sample. This observation prompted us to evaluate how each molecule type responded to distinct types of stains to understand the mechanism behind this disproportionate change better.
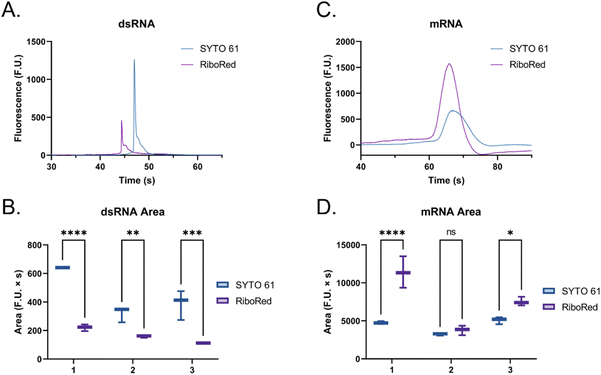
When the custom, long samples were analyzed using both stain types (Fig. 5 and Fig. S5, Tables S4, S5†), we again observed that dsRNA fluoresces more with SYTO 61 while mRNA with RiboRed. Furthermore, for both the long dsRNA and mRNA fragments, the area (Fig. 5B and D) showed more statistical difference and higher predictor potential than the height (Fig. S5†). In addition, Fig. 5 also highlights an area variability across different experimental repeats, which were run on different days and/or with chip washes in between experimental repeats. These changes in area stem from changes introduced by the use of different chips and subtle changes to the glass–liquid interface within the microfluidic channels across time. To minimize the effect of these external factors on the peak areas, it is important to run the samples subsequently on the same chip with the different dyes.
Then, to simulate a realistic scenario, we mixed the dsRNA and mRNA samples (Fig. 6) at a 1![[thin space (1/6-em)]](https://www.rsc.org/images/entities/char_2009.gif) :
:![[thin space (1/6-em)]](https://www.rsc.org/images/entities/char_2009.gif) 2 ratio and assessed their response in the presence of each fluorophore (Fig. 6 and Fig. S6, Tables S6, S7†), where the same behavior was observed.
2 ratio and assessed their response in the presence of each fluorophore (Fig. 6 and Fig. S6, Tables S6, S7†), where the same behavior was observed.
Differentiation method for identification and relative quantification of dsRNA contaminants in mRNA samples
Considering that, at times, there was no statistical difference between the peak heights and even peak areas, we developed a classifier to determine the type of molecule yielding a peak. Based on the behavior observed when mRNA, ssRNA and dsRNA were exposed to different fluorescent molecules, we hypothesized that the type of molecule could be determined based on the following relationship:If:
Or if:
As hypothesized, the dsRNA peak area stain ratio was <1 while the mRNA area stain ratio was >1 (Table 1). In this case, both RNA types met the differentiation criteria on each run. Interestingly, while the area stain ratios yielded by the mRNA peak in both its pure and mixed form were close in value (1.68 for the pure sample and 1.77 for the mixed sample), the area stain ratios yielded by the dsRNA were much more different (0.40 in its pure form and 0.15 when mixed). An added benefit of using ratios to determine the origin of the peak is that it converts the changes in area to relative terms, enabling the comparison of results across different chips and days, which was not possible when comparing the absolute areas.
| Run # | Pure peak area stain ratio | Mixed peak area stain ratio | ||
|---|---|---|---|---|
| dsRNA | mRNA | dsRNA | mRNA | |
| 1 | 0.34 ± 0.03 | 2.39 ± 0.34 | 0.19 ± 0.05 | 1.98 ± 0.18 |
| 2 | 0.51 ± 0.11 | 1.17 ± 0.15 | 0.14 ± 0.06 | 1.64 ± 0.11 |
| 3 | 0.34 ± 0.09 | 1.49 ± 0.06 | 0.13 ± 0.04 | 1.66 ± 0.03 |
| Average | 0.40 ± 0.11 | 1.68 ± 0.58 | 0.15 ± 0.05 | 1.77 ± 0.21 |
One of the potential causes of this difference is that rather than comparing independent electropherograms to each other, here we are comparing the peak areas obtained from the same electropherograms, potentially decreasing the error of combining the two. Additionally, it must also be noted that, as can be observed in Fig. 6A, there is a baseline increase to the left of the mRNA peak, which is not present when dsRNA alone is analyzed, and is likely due to sample degradation, as reported in the literature, which overlaps with the dsRNA. While it would be preferable if the regions did not overlap, the fact that the peak is still differentiable is encouraging. Moreover, even when averaging the three independent runs, there is still a statistical difference between the value yielded between the dsRNA and mRNA samples (Fig. S7†). While the mechanisms for dynamic staining of SYTO 61 and RiboRed are not precisely known, our data suggests that they exhibit quantifiable selectivity when staining nucleic acids (Fig. S8†). Some possible explanations for this selectivity include the increased distances in the spaces and grooves of ssRNA and mRNA due to secondary and tertiary structures that cause hairpins, internal loops, and bulges.
RiboRed may have a larger size, making it unable to fit effectively into the grooves or spaces in-between dsRNA. A previous study had reported using a “door-bolt mechanism” that allows near-infrared fluorescent probes to have specificity for RNA.31 In contrast, SYTO 61 may be too small to fit and label the ssRNA and mRNA molecules effectively. dsRNA has been known to have an A-form helix, having a length increase per base pair of approximately 2.8 Å and a radius of approximately 1.2 nm, causing it to be around 20% shorter and wider than dsDNA, which has a B-form helix in nature.32 The shorter and wider spacing within dsRNA base pairs and grooves may explain why most fragments in the ssRNA ladder fluoresced brighter than the dsRNA fragments with SYTO 61. If SYTO 61 was created to bind to dsDNA through groove binding or intercalation, it might be too large to bind dsRNA effectively and instead fit the greater spaces in ssRNA better.
Application
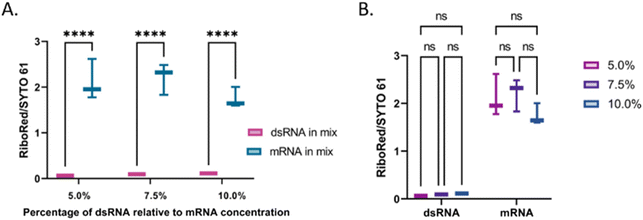
The next step in this study was to assess the applicability of the method. First, the linearity of the area to sample concentration was evaluated for both types of molecules using the SYTO 61 and RiboRed stains (Fig. S9†). Using the areas yielded by each sample from Fig. S9† and from Fig. 7, the limit of detection (L.O.D.) for this assay was calculated by determining the minimum concentration that could be observed. This was done by dividing the concentration used by the area yielded, which provides the concentration that would yield an area >1. In the case of both types of RNA, the areas produced by the least efficient stain (RiboRed for dsRNA and SYTO61 for mRNA) were used since the method relies on the ability to detect the fragments using both stains. By dividing the concentration of each sample by the peak area it produced, the L.O.D. of the system for dsRNA was estimated to be between 17.7–76.6 pg μL−1 while that of mRNA was estimated to be 1.79–2.83 pg μL−1. The difference in L.O.D. is not surprising given that throughout the experiments, regardless of the stain, both the ssRNA molecules and the mRNA yielded higher areas. In addition, it is important to note that while the areas tend to get greater as the concentrations increase, it was determined that the maximum concentration of mRNA that could be used without clogging or affecting the chip was 12.99 ng μL−1. Assuming we can indeed detect concentrations of dsRNA as low as 17.7–76.6 pg μL−1 if we load 12.99 ng μL−1 of mRNA, contaminants in percentages as low as 0.14–0.59% relative to the total mRNA concentration should be detectable. Since the actual percentage of dsRNA present in vaccines can vary depending on the construct and production conditions, it is of great importance to have a system with a robust L.O.D. capable of detecting low levels of contaminants.The percentage of dsRNA contaminants present in a sample can vary regardless of the mRNA concentration. Therefore, we evaluated whether the validity of the method was dependent on the relative concentration of the contaminant. Irrespective of the dsRNA concentration, there was a difference of equal statistical significance between the dsRNA and the mRNA stain area stain ratios (Fig. 7A and Table S8†). Similarly, there was no statistical difference between the dsRNA area stain ratios at different concentrations and the mRNA area stain ratio at equal concentrations with varying dsRNA concentrations (Fig. 7B and Table S8†). These results suggest that although the area yielded by each peak will vary based on differences in labeling efficiencies, the method is robust and should yield the expected results regardless of the concentration of dsRNA relative to that of the mRNA. Once the peak has been identified, a standard of known concentration that matches the identified nucleic acid type can be used to estimate the concentration of the sample. We have previously demonstrated the accuracy of using nucleic acid standards (samples of known concentration that undergo the same sample treatment as the other samples) in the context of adeno-associated virus delivery vehicles33 and are currently developing a similar method for LNP-extracted nucleic acid.
Conclusions
In this paper, we present a novel method for the identification and relative quantification of dsRNA contaminants in mRNA vaccines. Initially, to assess whether dsRNA and mRNA would exhibit any differences when analyzed in our microfluidic platform, we used a dsRNA ladder to simulate dsRNA contaminants and an ssRNA ladder to simulate mRNA vaccines. After optimizing the sample preparation, gel matrix concentration, and dynamic fluorescent stain concentration, we noted that at the respective optimal dynamic stain concentrations for each fluorophore type, the dsRNA fragments appeared to label more efficiently, 56%, with SYTO 61. In contrast, the ssRNA fragments appeared to label more efficiently, 118%, with RiboRed. Here, we established that the difference in dynamic staining between dsRNA and ssRNA fragments offers a method to identify and quantify the dsRNA percent impurity. This was later validated with long dsRNA and mRNA (4001 bp and nt, respectively) molecules.As a result, the difference in response between the dsRNA and mRNA molecules to these fluorophores was selected as the basis of our dsRNA contaminant identification and quantitation method. In addition, using the automated LabChip platform, which is compatible with 96- and 364-well plates, makes the platform high-throughput. This characteristic is highly beneficial to assessing dsRNA contaminants within and across mRNA vaccine batches. Although two different gel matrix preparations are required because the samples do not require preparation, the same sample plate is analyzed with both gel matrices limiting the hands-on time to <30 min.
Moreover, the results obtained in this study suggest that concentrations of dsRNA as low as 17.7–76.6 pg μL−1 and 1.79–2.83 pg μL−1 of mRNA should be detectable using this method. Therefore, when the maximum loading capacity of mRNA (12.99 ng μL−1) is analyzed, dsRNA contaminants present as low as 0.14–0.59% of the total mRNA concentration should be detectable. In addition, since this method allows for the fragment-based detection and characterization of different types of nucleic acid molecules, its analytical potential spans beyond the detection of dsRNA contaminants, as it can also be used to detect partially double-stranded, folded single-stranded, and truncated mRNA fragments. Lastly, other groups have analyzed mRNA samples extracted from LNPs in similar microfluidic chips,34 which would enable the mRNA composition assessment before and after encapsulation.
Author contributions
Conceptualization, A. C. D. P.; data curation, A. C. D. P., N. L., and M. V.; formal analysis, A. C. D. P.; funding acquisition, A. T.; investigation, A. C. D. P, N. L., M. V. and L. B.; methodology, A. C. D. P., L. B., and A. T.; project administration, A. C. D. P., and A. T.; resources, A. T.; supervision, A. C. D. P., and A. T.; validation, A. C. D. P.; visualization, A. C. D. P., and N. L.; writing – original draft, A. C. D. P., N. L., and M. V.; writing – review & editing, A. C. D. P., L. B., and A. T.Conflicts of interest
There are no conflicts to declare.Acknowledgements
This work was partly supported by Revvity's research grant to Brown University. A. T. is a paid scientific advisor/consultant and lecturer from Revvity.References
- C. M. C. Rodrigues and S. A. Plotkin, Front. Microbiol., 2020, 11, 1526 CrossRef PubMed.
- A. Wadhwa, A. Aljabbari, A. Lokras, C. Foged and A. Thakur, Pharmaceutics, 2020, 12(2), 102 CrossRef CAS PubMed.
- N. Pardi, M. Hogan, F. Porter and D. Weissman, Nat. Rev. Drug Discovery, 2018, 17, 261–279 CrossRef CAS PubMed.
- S. S. Rosa, D. M. F. Prazeres, A. M. Azevedo and M. P. C. Marques, Vaccine, 2021, 39, 2190 CrossRef CAS PubMed.
- N. Pardi, M. J. Hogan and D. Weissman, Curr. Opin. Immunol., 2020, 65, 14–20 CrossRef CAS PubMed.
- X. Hou, T. Zaks, R. Langer and Y. Dong, Nat. Rev. Mater., 2021, 6, 1078–1094 CrossRef CAS PubMed.
- M. Z. Wu, H. Asahara, G. Tzertzinis and B. Roy, RNA, 2020, 26, 345–360 CrossRef CAS PubMed.
- C. de Haro, R. Méndez and J. Santoyo, FASEB J., 1996, 10, 1378–1387 CrossRef CAS PubMed.
- A. K. Minnaert, H. Vanluchene, R. Verbeke, I. Lentacker, S. C. de Smedt, K. Raemdonck, N. N. Sanders and K. Remaut, Adv. Drug Delivery Rev., 2021, 176, 113900 CrossRef CAS PubMed.
- N. McGarry, C. L. Murray, S. Garvey, A. Wilkinson, L. Tortorelli, L. Ryan, L. Hayden, D. Healy, Eadaoin W. Griffin, E. Hennessy, M. Arumugam, D. T. Skelly, K. J. Mitchell and C. Cunningham, bioRxiv, 2021, preprint, DOI:10.1101/2021.01.09.426034.
- N. McGarry, C. L. Murray, S. Garvey, A. Wilkinson, L. Tortorelli, L. Ryan, L. Hayden, D. Healy, E. W. Griffin, E. Hennessy, M. Arumugam, D. T. Skelly, K. J. Mitchell and C. Cunningham, Brain, Behav., Immun., 2021, 95, 413 CrossRef CAS PubMed.
- R. Martins, J. A. Queiroz and F. Sousa, J. Chromatogr. A, 2014, 1355, 1–14 CrossRef CAS PubMed.
- K. Karikó, H. Muramatsu, J. Ludwig and D. Weissman, Nucleic Acids Res., 2011, 39, e142–e142 CrossRef PubMed.
- M. Baiersdörfer, G. Boros, H. Muramatsu, A. Mahiny, I. Vlatkovic, U. Sahin and K. Karikó, Mol. Ther. – Nucleic Acids, 2019, 15, 26–35 CrossRef PubMed.
- C. Poveda, A. B. Biter, M. E. Bottazzi and U. Strych, Vaccines, 2019, 7, 131 CrossRef CAS PubMed.
- K.-N. Son, Z. Liang and H. L. Lipton, J. Virol., 2015, 89, 9383 CrossRef CAS PubMed.
- C. J. Gabriel, J. Virol. Methods, 1986, 13, 279–283 CrossRef CAS PubMed.
- T. Kartali, I. Nyilasi, B. Szabó, S. Kocsubé, R. Patai, T. F. Polgár, G. Nagy, C. Vágvölgyi and T. Papp, Front. Cell. Infect. Microbiol., 2019, 9, 249 CrossRef CAS PubMed.
- G. M. Whitesides, Nature, 2006, 442, 368–373 CrossRef CAS PubMed.
- E. K. Sackmann, A. L. Fulton and D. J. Beebe, Nature, 2014, 507, 181–189 CrossRef CAS PubMed.
- E. Katri, L. Mirka, C. Christine, I. Jafargholi, K. Karl-Heinz and M. Poranen Minna, J. Chromatogr. A, 2022, 1683, 463525 CrossRef CAS PubMed.
- K. D. Dorfman, S. B. King, D. W. Olson, J. D. P. Thomas and D. R. Tree, Chem. Rev., 2013, 113, 2584 CrossRef CAS PubMed.
- J. A. Abels, F. Moreno-Herrero, T. Van Der Heijden, C. Dekker and N. H. Dekker, Biophys. J., 2005, 88, 2737 CrossRef CAS PubMed.
- P. Kebbekus, D. E. Draper and P. Hagerman, Biochemistry, 1995, 34, 4354–4357 CrossRef CAS PubMed.
- C. Hyeon, R. I. Dima and D. Thirumalai, J. Chem. Phys., 2006, 125(19), 194905 CrossRef PubMed.
- C. V. Bizarro, A. Alemany and F. Ritort, Nucleic Acids Res., 2012, 40, 6922 CrossRef CAS PubMed.
- C. Heller, Electrophoresis, 2001, 22, 629–643 CrossRef CAS PubMed.
- E. Stellwagen and N. C. Stellwagen, Biophys. J., 2020, 118, 2783–2789 CrossRef CAS PubMed.
- B. J. Kirby, Brian, 2010, 512 Search PubMed.
- C. Heller, Electrophoresis, 1999, 20, 1962–1977 CrossRef CAS PubMed.
- Q. Yao, H. Li, L. Xian, F. Xu, J. Xia, J. Fan, J. Du, J. Wang and X. Peng, Biomaterials, 2018, 177, 78–87 CrossRef CAS PubMed.
- J. Lipferta, G. M. Skinnera, J. M. Keegstraa, T. Hensgensa, T. Jagera, D. Dulina, M. Köber, Z. Yu, S. P. Donkers, F. C. Chou, R. Das and N. H. Dekker, Proc. Natl. Acad. Sci. U. S. A., 2014, 111, 15408–15413 CrossRef PubMed.
- A. Coll De Peña, L. Masto, J. Atwood and A. Tripathi, ACS Omega, 2022, 7, 23457–23466 CrossRef PubMed.
- J. Raffaele, J. W. Loughney and R. R. Rustandi, Electrophoresis, 2022, 43, 1101–1106 CrossRef CAS PubMed.
Footnote |
| † Electronic supplementary information (ESI) available: Fig. S1–S9, and Tables S1–S8, and sequence. See DOI: https://doi.org/10.1039/d3an00281k |
| This journal is © The Royal Society of Chemistry 2023 |


