Accelerated optimization of pure metal and ligand compositions for light-driven hydrogen production†
Maya
Bhat
 *a,
Eric M.
Lopato
b,
Zoe C.
Simon
 c,
Jill E.
Millstone
 c,
Stefan
Bernhard
 b and
John R.
Kitchin
 d
d
aDepartment of Chemical Engineering, Carnegie Mellon University, 5000 Forbes Avenue, Pittsburgh, Pennsylvania 15213, USA
bDepartment of Chemistry, Carnegie Mellon University, 4400 Fifth Avenue, Pittsburgh, Pennsylvania 15213, USA
cDepartment of Chemistry, University of Pittsburgh, 219 Parkman Avenue, Pittsburgh, Pennsylvania 15260, USA
dDepartment of Chemical Engineering, Carnegie Mellon University, 5000 Forbes Avenue, Pittsburgh, Pennsylvania 15213, USA. E-mail: jkitchin@andrew.cmu.edu
First published on 22nd November 2021
Abstract
Photocatalytic hydrogen production is a promising alternative to traditional hydrogen production. To implement photocatalytic hydrogen production the development of efficient, sustainable, and stable catalysts is necessary, and overcoming the current challenges surrounding high dimensional search spaces requires both computational and experimental efforts. Utilizing photo driven processes, stable colloidal metal catalysts can be formed in situ for efficient hydrogen production from water. When considering colloidal catalysts, stability is typically a concern solved through the addition of supports or ligands. Here, poly(ethylene glycol) methyl ether thiol acts as a stabilizing ligand eliminating the need for catalyst supports while providing stable and active nanoparticle catalysts for more than 45 hours of reaction time and illumination. These systems utilize molecular photosensitizers, water reduction catalysts, stabilizing ligands, water, a sacrificial reductant, and organic solvents, posing new challenges pertaining to the optimization of multi-variable systems. Design of experiments (DOE) is applied to accelerate the understanding of variable interactions and is used as a tool to rapidly optimize the compositions of Au, Cu, Ni, and Fe containing systems. Through a collaboration leveraging computation and experimentation (both high throughput and characterizations), optimized performance peaks were obtained for each of these metals alongside distinct mapping of expected activity associated with photosensitizer, metal, and ligand concentration variations. With the highly digitized workflow, this study allowed for comparative generalizations to be made regarding photo driven hydrogen production for all four metals.
1. Introduction
1.1 Hydrogen evolution
Renewable hydrogen (H2) production is a critical component in the effort to mitigate climate change. H2 as an energy carrier has gained increased attention in the energy sector as it can be used in areas including transportation, directly as heat through combustion, and chemical synthesis.1,2 As a result, sustainable H2 production is an active area of research. As the global population grows and the push for renewable practices continues, the demand for H2 will grow.1 As of 2017, approximately 96% of global H2 production was produced by steam reforming of non-renewable sources (oil coal, and natural gas).3 This process produces significant quantities of greenhouse gases, and a renewable approach is desirable. Photo-driven water reduction (a H2 evolving reaction often referred to as HER) requires only a photosensitizer (PS), sacrificial electron donor, and water as proton source, replacing the previous carbon intensive feedstocks.4 This system has the capacity to directly convert solar irradiation to H2 in a carbon neutral or negative manner based on the choice of donor. To make photo-driven water reduction a viable option for HER, active and stable catalysts are required to facilitate the reaction.Photocatalytic systems can directly harness light energy through the use of a molecular PS.5–7 This process bypasses traditional photoelectrocatalytic processes which require the use of an external electrical current and voltage to drive a reaction.8 In traditional photoelectrocatalytic processes, either molecular catalysts or heterogeneous catalysts are used. Molecular catalysts at times suffer from degradation after extensive light illumination.9,10 Heterogeneous catalysis with the use of nanoparticles (NP) have emerged as promising catalysts due to their high surface area and tunable chemical and physical properties.11–13 Additionally, in situ generated NPs have the added advantage of eliminating complex synthetic processes. Due to the advantages of the direct utilization of light energy and NP heterogeneous catalysts, there has been increased interest in improving these systems for photocatalytic HER.4,7,14–19 The role of nanostructure has been studied extensively for electrocatalytic HER,13 however, studies involving unsupported metallic NP, especially those in base metals, or in situ particles in visible light driven systems are more limited.20
1.2 Photocatalytic HER with NP catalysts
Photocatalytic HER typically involves a multi-step process. The light energy from an illumination source excites the PS, and in a reductive quenching regime, the excited PS gains an electron from the sacrificial electron donor.4,21,22 One potential next step is to use the reducing power of the PS to either reduce dissolved metal salts or reduce protons into H2.4,21–23 The system described has been studied before for different mono and bimetallic systems.7,18,24,25 One study looked at Cu2+ reduction to Cu for HER in a system containing fluorescein, triethanolamine (TEOA)/triethylamine (TEA), and metal salts in an aqueous solution.18 The aims of that study were to quantify H2 production, identify NP formation, and determine differences in activity for TEOA and TEA in the system.18 Another study was performed for the reduction of Fe3+ to Fe for HER in a similar system.24 That study aimed to optimize on TEA or TEOA as the sacrificial electron donor, the enhancement of HER with the addition of supports, and optimization of different metal salt concentrations.24 Yet another study looked at Ni based systems that used graphitic carbon nitride to obtain stable NPs for photo-driven HER.26Similar studies exist for other monometallic species such as Co, Au, and Pd, however, these studies are limited in the capacity for number of experiments performed and hence exhaustive composition ranges for testing.27 As a result, their survey of the composition space is likely to be incomplete. Few studies mention the addition of stabilizing ligands as opposed to supports.18,24 A comparative analysis of different metals is lacking in these studies. Generalizations of some of these findings across different metals would provide a better understanding of the role of in situ NP formation for HER heterogeneous catalysis. Some limitations including exhaustive studies of the composition space and simultaneous variation of different components are inevitable given the complexity of these systems and the long experimental time frames required. Additionally, these experiments are not easy to study because changing multiple concentrations of each variable simultaneously can significantly increase the complexity of analysis. Our work aims to target some of the limitations mentioned in generalizing trends, rapidly optimizing the composition space, and digitizing a reactor workflow.
One way to address some of these limitations in the screening space is by a high throughput approach advised by a design of experiment (DOE) framework. The high throughput experiments allow for a wide variety of reaction conditions at the same time, while the DOE advised experimental design will map out the chemical space by optimizing the experimental design to output the greatest amount of information with the least amount of trials. We previously introduced a parallelized photoreactor system which can measure H2 production in 108 well plates.7 H2 generation is measured using a colorimetric chemosensitive tape which turns progressively darker as H2 is produced. The reactor was calibrated using the addition of pure H2 gas.6,7 Previous studies showed high quantitative agreement with this method was compared with traditional gas quantification approaches such as gas chromatography.5,28 The 108 well plate is sealed with this detection tape and is illuminated for an experimental time of ∼15 hours. As the experiment progresses, the tape on wells that generate H2 will darken, indicating which compositions are active. An added benefit of these experiments is that they occur at room temperature under ambient conditions without noble gas purging of the air head spaces.
This study utilizes this high throughput experimental methodology and a DOE framework to understand relationships and dependencies in these multi-component systems. We aim to optimize the PS, ligand, and metal composition space for four metals (Au, Cu, Fe, and Ni). Au and Cu were chosen because the atomic and composition arrangements of Au and Cu containing NPs have been extensively studied29–31 and they have typically exhibited resilience to oxidation and degradation.6,32 Fe and Ni were chosen to due to their stability potentials in the presence of poly(ethylene glycol) methyl ether thiol (PEGSH),33 their non-noble metal classification, higher earth abundance, and the more limited understanding of Ni and Fe NPs for HER under atmospheric photocatalytic environments. The photosensitizer (PS) was chosen for optimization since preliminary studies indicated that the PS concentration has a strong influence on activity and can be a limiting factor. Previous studies6 indicate that the role of a stabilizing ligand enhances catalytic activity, but it is not always clear what the best ligand concentration is and if it differs for different metals. PEGSH was chosen as our stabilizing ligand in this study due to its affinity for the four metals in these studies.6,33–35 Finally, the metal identity and concentrations were investigated to identify different HER activity responses as these variables are manipulated. The two primary goals of this study are to utilize high throughput experiments advised by DOE to optimize the PS, metal, and ligand space to find optimal compositions to achieve maximum H2 production and generalize trends for Au, Cu, Ni, and Fe NP catalyst HER using photocatalytic methods. We have made use of a parallel reactor design to explore with great granularity the chemical space surrounding several metals and their supported in situ synthesized water reduction catalysts. Using a computational approach toward design of experiment, we were able to rapidly determine performance peaks within each metal.
2. Methods
2.1 Experimental
![[thin space (1/6-em)]](https://www.rsc.org/images/entities/char_2009.gif) 450 nm/3000 mA/DC 3034 V). Solutions of metal salts and the photosensitizer (PS = Ir(Fmppy)
450 nm/3000 mA/DC 3034 V). Solutions of metal salts and the photosensitizer (PS = Ir(Fmppy) 2dtbbpy PF
 6 where Fmppy → 4′-fluoro-2-phenyl-5-methylpyridine, and dtbbpy → 4,4′-di-tert-butyl-2,2′-bipyridine, synthesized according to literature)36 were prepared in DMSO. Solutions of PEGSH and TEOA were prepared in deionized water. The total volume of in each reaction well was 440 microliters, with multiple round experiments having a refill of the PS solution (100 microliters) and TEOA solution (20 microliters) and replacement of DetecTape between rounds. Quantification of images after reactions was performed using an in house developed program in Wolfram Mathematica.5,7
An internal standard was added in six wells of each plate. This internal standard was chosen because it is a molecular species that is not subject to NP growth variations, and is expected be more uniform in activity.5,37 The solution is a 420 microliter volume composed of 400 microliter methoxy ethanol, and 20 microliters of a 60% (w/w) TEOA solution in water. It contains 1 mM eosin Y (as a PS), and 1 mM cobalt(III) bis(BF2-annulated-dimethylglyoxime) pyridine chloride, both from methoxy ethanol solutions.
2.2 DOE approach
Our current experiments occur in a 108 well plate. There are multiple solutions that are added to the wells to make each of the 108 well reactors – DMSO, PS, PEGSH, metal, water, and TEOA. The main benefit to using this high throughput experimental setup lies in the ability to survey many composition variations and obtain large quantities of activity information from each experimental run. That benefit also means, though, that in this multiple component system, there can be a large number (n) of tunable variables and discerning the quantitative importance of each one is non-trivial. The standard way to better understand the roles of each component in the system is to hold n − 1 variables constant while varying one variable of interest.37,38 Though this process can isolate the contributions of each variable somewhat definitively, it does require many experimental trials, and associated with that, resources, time, and energy to exhaust the space. Additionally, this process limits the opportunity to explore interactions between multiple factors. Without exploring variation in the multidimensional space, valuable compositions could be left unexplored.A more intentional approach to understanding the relationship between multiple variables is with a DOE framework. DOE designs are based heavily in statistics, and there are several distinct experimental designs that include several factors (system components) or levels (composition values) while identifying relationships between the factors.39 DOE aims to extract maximum information with minimum experimental trials.
This study aims to optimize the concentrations of three factors – metal, ligand, and photosensitizer (PS). The initial experiments are created to broadly survey the composition space at three levels (high, medium and low concentration) for each of the three factors (metal, ligand, and photosensitizer). A Box–Behnken design was initially used to generate the composition values for each component. For each metal, 15 wells were designed per experiment to survey the three-dimensional space where three wells were the center points. The remaining 12 wells were made up of different compositions where each factor was varied at three levels – high, low, and center concentration values. The initial bounds were chosen based on prior experiments of different metal and ligand concentration variations and finite well volume limitations. The experimental design was converted into input files to be read by the Hamilton robot hosted in the Bernhard lab that fills the 108 well plate with the delineated solutions and their respective volumes. When the results of the ∼15 hour experiment are returned, a simple linear model (eqn (1)) was created using an ordinary least squares objective function.
| max H2 = J + Ax1 + Bx2 + Cx3 + Dx1x2 + Ex1x3 + Fx2x3 + Gx21 + Hx22 + Ix23 | (1) |
In this model, each letter is a fitted constant that quantifies the importance of the associated term. x1, x2, x3 each represent metal, ligand, and PS concentration respectively. By using a DOE analysis Python package created for this study,40 the data was analyzed, and an optimal composition was predicted with the model. The new prediction was then used as the new center points of the DOE design, and a tighter sampling space was tested with tighter composition bounds. This process was iterated until the optimal composition prediction no longer changes. The entire workflow is outlined in Fig. 1.
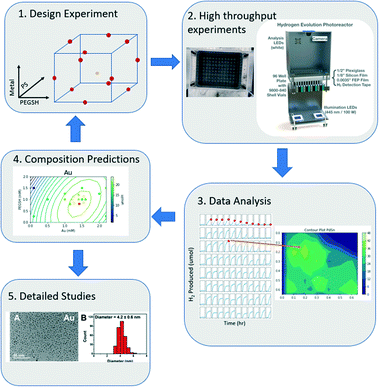 | ||
| Fig. 1 The iterative computational and experimental workflow consisting of experimental design, experimentation, and analysis. | ||
2.3 Collaborative workspace
This project has experimental and computational contributions across two institutions, and three academic departments. Each 108 well-plate yields data for each well including images, derived data from image analysis, and characterization of post reaction mixtures on select reaction wells. It was necessary to develop a shared workspace to share data and analysis in the project.To make a robust and collaborative space where all collaborators can access the data and analysis, Google Drive was chosen as the data sharing platform due to its flexibility in file system sharing, Colab notebook integration, and general user-friendly nature. The Google Colab notebooks are the main computational drivers on this platform. Using Colab, the experimental input files are generated, and once the experiments are run and uploaded, the output files are subsequently processed in Colab. The experimental design, input file creation, and post experimental processing is done with the help of two python modules-doe_analysis and gespyranto.40 Both modules have been developed alongside this project to aid in data management and analysis and can be found in the ESI.†
Google Drive can also be synced to a local computer where analysis can be done with other tools, e.g. a Jupyter or Mathematica notebook. Google Colab files are saved as .ipynb files that are compatible with Jupyter. Unfortunately, other Google Drive files including Google Docs, Sheets, Slides and Jamboards cannot be locally downloaded or viewed.
Each experiment is organized in a directory within the project folder that contains input files, top and bottom images of the plate, and output files. The input files contain information regarding volumes and identities of different solutions in each well, as well as metadata critical to identifying plates. With the use of plate descriptions, and general plate design layouts, the interpretability of the plate is such that the data viewer has context, and this structure gives sufficient flexibility allowing the plates to be processed using the same flow even as the experiments change.
Using our developed data workflow, we can parse through the data directories to extract out relevant information for processing. gespyranto can read an experiment directory (or set of directories) into a searchable dataframe, display heatmaps and time series plots of the plate activity, and even automatically generate plate summary notebooks for each experiment. When discrepancies arise or surprising results are found through the analysis of the entire data set, these plate summary notebooks allow us to quickly look at specific well activities and time series graphs to discern any unusual behaviors.
A crucial feature of the Google Drive ecosystem is that any collaborator can read any file in the project in their browser from a url. This provides interactive read access to all the data and analysis to all collaborators in the project, without requiring any software installation.
3. Results and discussion
3.1 Target variable
In DOE, it is necessary to choose a target metric for exploration. One of the key measurements we make is the production of H2 in each well. There are two ways we chose to quantify trends in this, either a property of the rate of H2 production, e.g. the maximum rate, or the amount of H2 produced, e.g. the maximum produced in each experiment.The rate is related to the time derivative of the H2 production. In this case, the rate of H2 production can be found by smoothing the time series data from each experiment and obtaining the maximum slope from these smoothed curves. This process relies on smoothing functions and may be susceptible to noise fluctuations. Another possible activity metric is the maximum H2 obtained by the end of the experiment. This measure is the highest reported H2 value in a time series curve – typically this point is attained at the end of the experiment. When plotting both the maximum rate vs. the maximum value of H2, a correlation was observed in Fig. 2 between the two metrics for all four of the metals in the study.
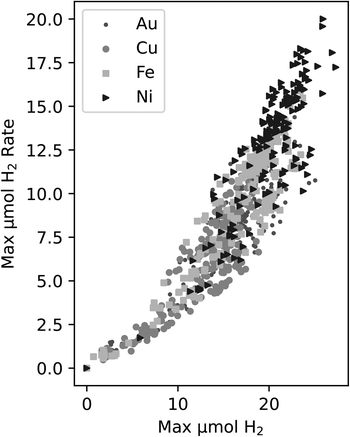 | ||
| Fig. 2 Correlation between the maximum H2vs. maximum H2 production rate for all experiments within this study. The different symbols indicate the different metals that were tested. | ||
Since the correlation between the two metrics is relatively strong, we decided to use maximum H2 as the target variable since it does not require further data manipulations, is not reliant on smoothing functions, is less susceptible to deviations due to noise fluctuations, and it is an unambiguous measure of activity in this work.
3.2 Identifying active PS concentration
The PS is a critical component in this system because it harnesses light energy and enables the reduction of both the metal salts and protons to H2. Previous studies utilized 0.25 mM of PS which appeared to be a sufficient concentration for the photodriven system without the presence of PEGSH.6,7 Upon further experimentation in the ligand and metal space, the H2 production time series curves became indistinguishable for different metals. In this case, the rate limiting step was not the catalyst surface performance but the PS energy transfer capabilities, hence the system was in a PS limiting regime. We included PS concentration as a tunable variable in the following experimental system.The initial plate design was performed using the Box Behnken design since it is more suited towards three factor experiments and requires fewer trials to survey the composition space than other designs like central composite designs. The PS composition space that was surveyed was from 0.05 mM to 1 mM. The metal, ligand, and PS concentrations were refined using the three variable linear eqn (1). After two iterations of refining the compositions of ligand, metal and PS, the predicted optimal PS values were consistently near the upper end of the composition space. It was not practical to continue increasing the PS concentration since the PS is an expensive material, and the reactor vials are of finite volume.
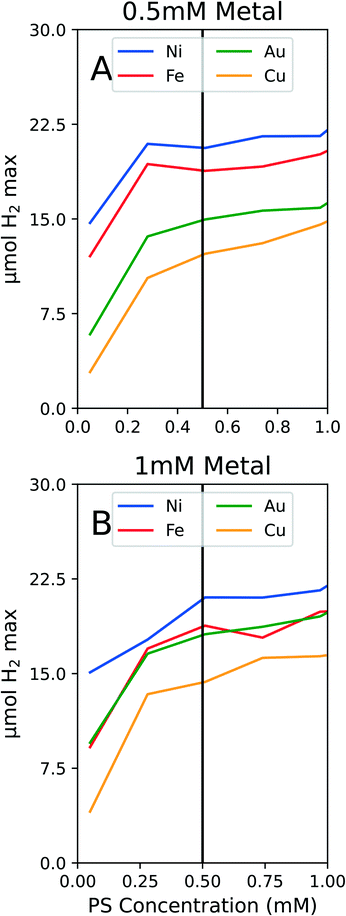
To conserve PS while still ensuring we were not operating in a PS limiting region, we conducted experiments on solely PS concentration variations. We tested the PS concentration range from 0 to 1 mM PS while holding the metal and ligand concentrations constant at both 1 mM metal and 1 mM PEGSH and at 0.5 mM metal and 1 mM PEGSH. As seen in Fig. 3, though the activity continues to increase as PS concentration increases, the marginal increase in activity becomes negligible after about 0.4 mM for all four metals.
The two graphs illustrate that for both Fig. 3A and B, though the activity values differ, the curvature trends are similar in the flattening out behavior after 0.5 mM PS. The above experiments are also important since they confirm that at 0.5 mM PS, the reaction is not PS limited, and there is diminishing marginal benefit by continuing to add PS. We claim that the reaction is not PS limited due to the general differentiation between the different metal activities at 0.5 mM PS. In the case of Au and Fe in Fig. 3B, the similarities in curves may instead be a result of similar surface properties for HER.
The benefits to limiting the PS are both from an economic and modeling standpoint. By limiting the PS to 0.5 mM, the expensive Ir based PS can be conserved. This will reduce downstream costs for larger reactors or longer timescale experiments. From a modeling standpoint, by fixing the PS concentration at 0.5 mM, the composition optimization reduces from a three dimensional problem to a two dimensional one. Since the optimization problem no longer requires varying the PS concentration, the two degrees of freedom remaining are metal and ligand concentrations. Once the PS studies were complete, the following experiments were fixed at 0.5 mM PS.
3.3 Identifying optimal composition regions
The DOE design used for optimizing the two-dimensional (metal and ligand) space is the central composite inscribed (CCI) model. CCI was chosen due to its comprehensive sampling around a given center point. The model used to fit the data is the same linear polynomial expression containing crossed and squared terms of the independent variables as seen in eqn (1). Since the PS concentration was now fixed at 0.5 mM, all x2 terms were also fixed at 0.5 mM. The first iteration was a sparse and broad sampling of the composition space. As more iterations were completed, the model was continually updated, and more points were sampled in a tighter composition range around the optimal. Optimal convergence was achieved when the prediction μmol H2 optimal was within 1 μmol H2 of the prior prediction. This was achieved within 6 iterations for the 4 metals.An internal standard was introduced and was run in six wells on the 108 well plate. The purpose of the internal standard was to provide a consistent measurement that should perform the same from plate to plate under the same external conditions. The internal standard was assessed for consistency and can be found in the ESI.† As a result, any variation seen in internal standard performance can be considered an external factor variation that affects the performance of the entire plate. The raw data points were normalized by introducing a multiplying factor to the different plates based on how the internal standard performances differed across plates.
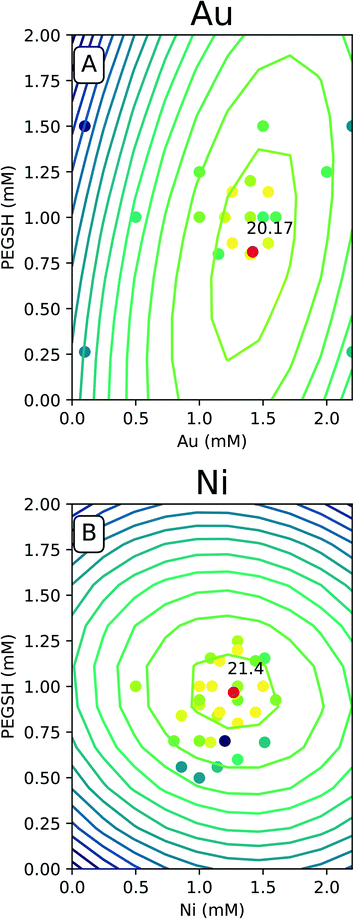
The predicted space generated by the model was plotted as a contour map as seen in Fig. 4, and the raw data was overlaid with the same color legend. The expectation is experiments with compositions which lie along computationally generated contours will approximately match the activity delineated by that contour. Fig. 4 only contains the Au and Ni results since similarities were seen with Cu and Fe. The complete set of 4 metals can be found in the ESI.†
For all of the metals, the bright raw data points fall closely around the high predicted optimal red points. This indicates constructive predictive capabilities. Interestingly, Au and Cu have similar shapes as do Ni and Fe. The predicted optimal for all four metals are denoted in Table 1.
| Metal | Au | Cu | Ni | Fe |
|---|---|---|---|---|
| Predicted metal mM | 1.41 | 1.55 | 1.27 | 1.22 |
| Experimental metal mM | 1.5 | 1.4 | 1.1 | 1.5 |
| Predicted ligand mM | 0.81 | 0.85 | 0.97 | 1.08 |
| Experimental ligand mM | 1.14 | 0.81 | 1 | 0.9 |
| Predicted μmol H2 | 20.17 | 15.55 | 21.40 | 20.54 |
| Experimental μmol H2 | 22.77 | 17.92 | 24.30 | 22.71 |
For Au and Cu, the optimal predicted points lie around 1.5 mM and 0.8 mM PEGSH seen in both Table 1 and Fig. 4. The model indicates lower sensitivity around the PEGSH concentration and higher sensitivity for the metal concentration based on the frequency of contours in the PEGSH and metal axis respectively. Additionally, the contours are broader near the peak indicating a larger region in which optimality can be achieved. For Fe and Ni, the optimal predicted point lies around 1.25 mM metal and 1 mM PEGSH. The model has higher sensitivity with the PEGSH content and has a lower sensitivity around the metal concentration. These trends are seen in the variation in predicted vs. actual concentrations in Table 1. For Au and Cu, the metal concentration predicted and experimental values are within 0.1 mM, and the ligand concentration predicted and experimental values are within 0.2 mM. For Ni and Fe, the ligand concentrations are much more similar with about 0.1 mM between predicted and experimental, and the metal concentrations were up to 0.3 mM between prediction and experimental. As seen in Table 1, in all cases, the predicted optimal is less than the maximum reported activity. This is likely due to the presence of lower activity points near the optimal (Fig. 4 causing the model to under predict). The activity uncertainty for data points is approximately 3 μmol H2 based on the internal standard well variability. Taking the experimental data uncertainty, the model's predicted activity is within 3 μmol H2 from experimental observations.
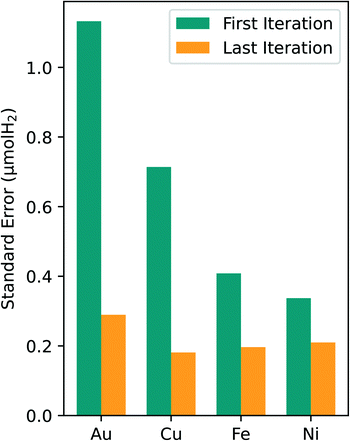
An analysis of the optimal composition prediction performance is sufficient in assessing model viability since the purpose of this study was to specifically identify the optimal composition region. It is less important to consider the errors in the regions away from the optimal since they were not heavily sampled. For all four metals tested in this study, the standard error of the optimal prediction from first to last experimental iteration dropped to around 0.2 μmol H2. Given the error associated with our experimental data, a standard error of the prediction of 0.2 μmol H2 is reasonable. This consistent reduction in the optimal predicted standard error leads to higher confidence in the predicted composition values and in the optimal composition region.
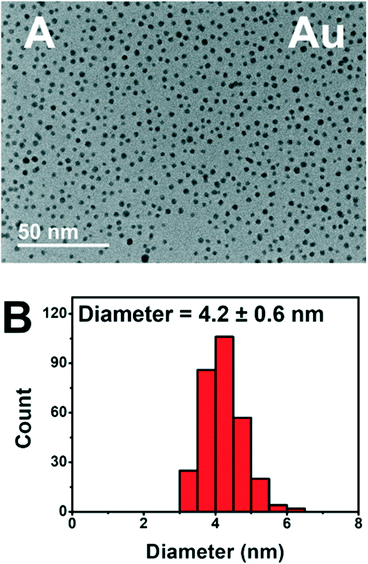
The addition of PEGSH has led to prolonged activity of these photodriven systems without the requirement of heterogeneous supports.6 Based on our previous study, we have reason to believe that the addition of PEGSH elongates the period of catalytic activity for NPs. This is confirmed by the high activities observed in the presence of sufficient PEGSH and low observed activities in the absence of PEGSH. We have reason to believe this is a result of increased stability.6 Though the high throughput experiments confirmed high activity, additional characterization studies are needed to confirm the stability of the particles after longer experimentation times. TEM micrographs were taken from the best performing wells for each metal after 45 hours of illumination (Fig. 6).
The TEM micrograph for Au show distinct particles indicating stability after 45 hours of illumination. Cu, Ni, and Fe showed similar stability in the form of distinct particles (see ESI†). The complete TEM micrographs and particle size distributions can be found in ESI.† This is consistent with prior knowledge of all four metals being stabilized by PEGSH.35,41 The particles remained distinct, and did not aggregate even after 45 hours of experimental time allowing for the catalytically active surface to remain functional.
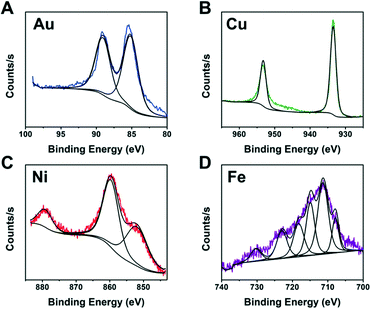
It is not practical to run detailed studies on all compositions due to the high monetary and time costs associated with characterization. Instead, we identified the best performing compositions (wells) for each metal to study further. XPS was performed on wells containing metal and ligand concentrations near the optimal predicted values of each metal to identify the NP composition. To complete the identification, the XPS spectra from each metal was compared to literature XPS spectra for different metal containing compositions.42–45
The XPS spectra from Fig. 7 indicate metallic Au and Cu formed. This is likely due to the fact that Au and Cu have sufficiently high reduction potentials of 1.5 eV for Au3+ and 0.34 eV for Cu2+vs. the standard hydrogen electrode (SHE).46 In contrast, Ni and Fe did not produce fully metallic NPs and instead the Ni sample contained both metallic Ni and Ni oxide (NiO) and the Fe sample contained Fe sulfide. Iron sulfide is not a new material for HER. A previous report47 indicated it is less active than noble metals, and prone to corrode or form oxidation products when in NPs form. Our studies indicate the iron sulfide NPs have comparable H2 activity values to the Au NPs and they show stability with PEGSH even after >45 hours of illumination.
4. Conclusions
It is reasonable to discuss the advantages of this DOE driven process as opposed to systematically testing all of the combinations within the space. If we were to map out the space by testing all of the combinations, for a 0 to 2 mM range with increments of 0.1 mM for both metal and ligand concentrations, we would require 400 data points for each metal. If we then include the PS variation at 5 levels, that would come out to 8000 total wells for the 4 metals. Finally, we would need at least 1 additional replicate per composition to test reproducibility, leading to 16![[thin space (1/6-em)]](https://www.rsc.org/images/entities/char_2009.gif) 000 wells. Instead, by utilizing DOE and developing a model that would describe relationships between these 3 variables, the entire study surveyed less than 1000 wells. Not only does the DOE approach provide a mathematical relationship in a multi variable system, but it allows for more than a 10 times reduction in experimental trials.
000 wells. Instead, by utilizing DOE and developing a model that would describe relationships between these 3 variables, the entire study surveyed less than 1000 wells. Not only does the DOE approach provide a mathematical relationship in a multi variable system, but it allows for more than a 10 times reduction in experimental trials.
Our iterative DOE and high throughput experimental approach led to a highly optimized screening of a high dimensional experimental space, and optimal composition spaces (metal, PEGSH, and PS) for Au, Cu, Ni, and Fe were identified. Using the DOE and high throughput experimental approach, we leveraged a digitized methodology towards reaction engineering where the workflow of experimental design and subsequent data analysis seamlessly advised the following experiments until further iterations were not necessary. This workflow has allowed for improved collaboration, more efficient screenings of a high dimensional space, and better understanding of how different components interact in a complex colloidal aqueous system. By employing both DOE and high throughput methods, surveying this high dimensional space was greatly accelerated, and without them, an optimization of this scale would definitively require significantly more trails, effort, and time as indicated prior.
Our findings provide insight into in situ particle formation and allow us to generalize trends across Au, Cu, Ni, and Fe HER catalysts in photodriven systems. We identified sufficient PS concentrations of 0.5 mM for a metal loading up to 1.2 mM. Additionally, operating future studies in a composition space of ∼1 mM metal and 1 mM PEGSH allows for the best chance for high HER activity in our system. Our framework presented here can be utilized for more complicated systems including bimetallic colloids and variation in the identity of stabilizing agent.
Conflicts of interest
There are no conflicts to declare.Acknowledgements
This research was supported by the U.S. Department of Energy, Office of Science, Office of Basic Energy Sciences, Data Science for Knowledge Discovery for Chemical and Materials Research program, under award DESC0020392.Notes and references
- R. Singh and S. Dutta, Fuel, 2018, 220, 607–620 CrossRef CAS.
- M. Zeng and Y. Li, J. Mater. Chem. A, 2015, 3, 14942–14962 RSC.
- L. Baharudin and M. J. Watson, Rev. Chem. Eng., 2017, 34, 43–72 CrossRef.
- I. N. Mills, J. A. Porras and S. Bernhard, Acc. Chem. Res., 2018, 51, 352–364 CrossRef CAS PubMed.
- R. N. Motz, E. M. Lopato, T. U. Connell and S. Bernhard, Inorg. Chem., 2021, 60, 774–781 CrossRef CAS PubMed.
- Z. C. Simon, E. M. Lopato, M. Bhat, P. Moncure, S. Bernhard, J. Kitchin, S. Bernhard and J. E. Millstone, ChemCatChem, 2021 DOI:10.1002/cctc.202101551.
- E. M. Lopato, E. A. Eikey, Z. C. Simon, S. Back, K. Tran, J. Lewis, J. F. Kowalewski, S. Yazdi, J. R. Kitchin, Z. W. Ulissi, J. E. Millstone and S. Bernhard, ACS Catal., 2020, 10, 4244–4252 CrossRef CAS.
- E. D. Cline and S. Bernhard, Chimia, 2009, 63, 709–713 CrossRef CAS.
- C.-F. Leung, S.-M. Ng, C.-C. Ko, W.-L. Man, J. Wu, L. Chen and T.-C. Lau, Energy Environ. Sci., 2012, 5, 7903 RSC.
- D. Hong, J. Jung, J. Park, Y. Yamada, T. Suenobu, Y.-M. Lee, W. Nam and S. Fukuzumi, Energy Environ. Sci., 2012, 5, 7606 RSC.
- Z. Sun, Q. Yue, J. Li, J. Xu, H. Zheng and P. Du, J. Mater. Chem. A, 2015, 3, 10243–10247 RSC.
- Q. Yang, M. Dong, H. Song, L. Cao, Y. Zhang, L. Wang, P. Zhang and Z. Chen, J. Mater. Sci.: Mater. Electron., 2017, 28, 10073–10080 CrossRef CAS.
- J. Zhu, L. Hu, P. Zhao, L. Y. S. Lee and K.-Y. Wong, Chem. Rev., 2019, 120, 851–918 CrossRef PubMed.
- D. Miller and G. McLendon, Inorg. Chem., 1981, 20, 950–953 CrossRef CAS.
- M. Elvington, J. Brown, S. M. Arachchige and K. J. Brewer, J. Am. Chem. Soc., 2007, 129, 10644–10645 CrossRef CAS.
- K. Maeda and K. Domen, J. Phys. Chem. Lett., 2010, 1, 2655–2661 CrossRef CAS.
- J. Zhao, W. Wu, J. Sun and S. Guo, Chem. Soc. Rev., 2013, 42, 5323 RSC.
- S. Cao, C.-J. Wang, G.-Q. Wang, Y. Chen, X.-J. Lv and W.-F. Fu, RSC Adv., 2020, 10, 5930–5937 RSC.
- T. Kawawaki, Y. Mori, K. Wakamatsu, S. Ozaki, M. Kawachi, S. Hossain and Y. Negishi, J. Mater. Chem. A, 2020, 8, 16081–16113 RSC.
- P. N. Curtin, L. L. Tinker, C. M. Burgess, E. D. Cline and S. Bernhard, Inorg. Chem., 2009, 48, 10498–10506 CrossRef CAS PubMed.
- M. Kirch, J.-M. Lehn and J.-P. Sauvage, Helv. Chim. Acta, 1979, 62, 1345–1384 CrossRef CAS.
- P. Lei, M. Hedlund, R. Lomoth, H. Rensmo, O. Johansson and L. Hammarström, J. Am. Chem. Soc., 2008, 130, 26–27 CrossRef CAS.
- H. N. Kagalwala, D. N. Chirdon and S. Bernhard, in Solar Fuel Generation, John Wiley & Sons, Ltd, 2017, pp. 583–615 Search PubMed.
- C.-J. Wang, S. Cao, B. Qin, C. Zhang, T.-T. Li and W.-F. Fu, ChemSusChem, 2014, 7, 1924–1933 CrossRef CAS PubMed.
- C.-J. Wang, Y. Chen, X.-J. Lv and W.-F. Fu, Appl. Catal., B, 2016, 182, 59–67 CrossRef CAS.
- J. Dong, M. Wang, X. Li, L. Chen, Y. He and L. Sun, ChemSusChem, 2012, 5, 2133–2138 CrossRef CAS PubMed.
- C. Barrios, E. Albiter, J. G. y Jimenez, H. Tiznado, J. Romo-Herrera and R. Zanella, Int. J. Hydrogen Energy, 2016, 41, 23287–23300 CrossRef CAS.
- W. Song, E. M. Lopato, S. Bernhard, P. A. Salvador and G. S. Rohrer, Appl. Catal., B, 2020, 269, 118750 CrossRef CAS.
- N. E. Motl, E. Ewusi-Annan, I. T. Sines, L. Jensen and R. E. Schaak, J. Phys. Chem. C, 2010, 114, 19263–19269 CrossRef CAS.
- R. He, Y.-C. Wang, X. Wang, Z. Wang, G. Liu, W. Zhou, L. Wen, Q. Li, X. Wang, X. Chen, J. Zeng and J. G. Hou, Nat. Commun., 2014, 5, 4327 CrossRef CAS.
- S. Yamazoe, W. Kurashige, K. Nobusada, Y. Negishi and T. Tsukuda, J. Phys. Chem. C, 2014, 118, 25284–25290 CrossRef CAS.
- C. M. Andolina, A. C. Dewar, A. M. Smith, L. E. Marbella, M. J. Hartmann and J. E. Millstone, J. Am. Chem. Soc., 2013, 135, 5266–5269 CrossRef CAS.
- S. Wang, D. Zhong, Y. Xu and N. Zhong, New J. Chem., 2021, 45, 13969–13978 RSC.
- M. B. Gawande, A. Goswami, F.-X. Felpin, T. Asefa, X. Huang, R. Silva, X. Zou, R. Zboril and R. S. Varma, Chem. Rev., 2016, 116, 3722–3811 CrossRef CAS PubMed.
- Y. Wang, J. E. Q. Quinsaat, T. Ono, M. Maeki, M. Tokeshi, T. Isono, K. Tajima, T. Satoh, S. Sato, Y. Miura and T. Yamamoto, Nat. Commun., 2020, 11, 6089 CrossRef CAS.
- S. Adhikari, T. Bhattacharjee, S. Bhattacharjee, C. G. Daniliuc, A. Frontera, E. M. Lopato and S. Bernhard, Dalton Trans., 2021, 50, 5632–5643 RSC.
- P. Du and R. Eisenberg, Energy Environ. Sci., 2012, 5, 6012 RSC.
- W. R. McNamara, Z. Han, P. J. Alperin, W. W. Brennessel, P. L. Holland and R. Eisenberg, J. Am. Chem. Soc., 2011, 133, 15368–15371 CrossRef CAS PubMed.
- NIST, NIST/SEMATECH e-Handbook of Statistical Methods, 2013 Search PubMed.
- M. Bhat and J. Kitchin, gespyranto, 2021, DOI:10.5281/zenodo.5525144.
- A. Heuer-Jungemann, N. Feliu, I. Bakaimi, M. Hamaly, A. Alkilany, I. Chakraborty, A. Masood, M. F. Casula, A. Kostopoulou, E. Oh, K. Susumu, M. H. Stewart, I. L. Medintz, E. Stratakis, W. J. Parak and A. G. Kanaras, Chem. Rev., 2019, 119, 4819–4880 CrossRef CAS.
- M. P. Casaletto, A. Longo, A. Martorana, A. Prestianni and A. M. Venezia, Surf. Interface Anal., 2006, 38, 215–218 CrossRef CAS.
- P. Ganesan, A. Sivanantham and S. Shanmugam, J. Mater. Chem. A, 2016, 4, 16394–16402 RSC.
- E. M. Davis, G. Berti, H. Kuhlenbeck, V. Vonk, A. Stierle and H.-J. Freund, Phys. Chem. Chem. Phys., 2019, 21, 20204–20210 RSC.
- M. Zhang, S. Miao and B.-Q. Xu, Catal. Sci. Technol., 2019, 9, 4668–4677 RSC.
- Standard Reduction Potential, 2021, https://chem.libretexts.org/@go/page/282, [Online; accessed 2021-09-17] Search PubMed.
- D. Heift, Inorganics, 2019, 7, 75 CrossRef CAS.
Footnote |
| † Electronic supplementary information (ESI) available: Additional data supporting the conclusions and information on figure generation. See DOI: 10.1039/d1re00441g |
| This journal is © The Royal Society of Chemistry 2022 |

