 Open Access Article
Creative Commons Attribution 3.0 Unported Licence
Photo induced force microscopy: chemical spectroscopy beyond the diffraction limit
Josh A.
Davies-Jones
 * and
Philip R.
Davies
 *
*
Cardiff Catalysis Institute, School of Chemistry, Cardiff University, Cardiff, CF10 3AT, UK. E-mail: DaviesJA21@cardiff.ac.uk; daviespr@cardiff.ac.uk
First published on 5th April 2022
Abstract
Over the last decade remarkable advances have been made in creating spectroscopic tools to interrogate surface properties using electromagnetic radiation in the near field, achieving lateral resolutions in the nanometre range. We review recent work involving one of the most promising of these spectroscopic tools, photo induced force microscopy (PiFM), which uses mechanical detection of dipole–dipole interactions enabling nanometre resolved mapping of surface properties ranging from vibrational modes of adsorbates to plasmon resonances. We discuss the origin of contrast in PiFM images, its applications as a local probe of chemical species and for mapping local electric fields in areas as diverse as zeolite films and biometric recognition. In comparison with related techniques such as photothermal atomic force microscopy-based infrared (AFM-IR) and tip enhanced Raman spectroscopy (TERS) PiFM has many advantages but perhaps its most successful application is in combination with other surface characterisation methods which provide information averaged over much greater surface areas. We discuss the most recent developments of PiFM technology which are leading to higher resolution images and are widening the range of environments in which the technique can be applied, and we consider how the field is likely to progress in the future.
1. Introduction
Our understanding of surface chemistry has advanced at a steady pace since the experiments by Taylor and Langmuir using clean tungsten filaments in the early part of the 20th century.1,2 Low energy electron diffraction3,4 and Auger spectroscopy5 were developed in the 1950's & 60's to provide information on the surface structure and elemental composition whilst flash desorption experiments were developed into the sophisticated temperature programmed desorption (TPD) technique that provides fundamental information on surface kinetics.6,7 Photoelectron spectroscopy offered the next step forward with quantifiable identification of the elemental composition of surfaces8,9 but it was always recognised that elemental composition, albeit with information on the charge and hence environment of the elements concerned could not provide a complete picture of the surface chemistry and vibrational spectroscopy was developed for surfaces with techniques such as DRIFTS and ATR for non-uniform surfaces under ambient conditions and RAIRS and HREELS for single crystals in UHV. A plethora of sophisticated techniques were developed between the 70's and 90's but Binnig and Rohrer's invention of scanning tunneling microscopy in 198210 created a step change in the understanding of surfaces by allowing ready access to topography at the Ångström scale with few restrictions on conditions. A whole range of related proximal probe techniques have been derived since 1982 but researchers have, from the very beginning, recognised that direct chemical information on the surfaces being imaged is essential for a full interpretation of the topography. Combining local probe techniques with tools providing more direct chemical information such as X-ray photoelectron spectroscopy11,12 and TPD proved very successful13 but in many areas of research, knowing the chemistry on a local (i.e. nanometre scale) is critical. Ho's dramatic images of the vibrational spectrum of ethyne on a Cu(100) surface14 derived from scanning tunneling spectroscopy (STS) illustrates the power and need for such information, but that STS approach was experimentally very demanding and only feasible for single crystal surfaces in ultra-high vacuum.A new era is now dawning for studying the chemistry at the nanometre scale with the development of a range of methods for vibrational spectroscopy that exploit near-field behaviour at nanometre scales and thus sidestep the Abbe diffraction limit. These offer the possibility of identifying the functional groups involved at the sort of local scales that phenomenon such as nanoparticle growth, microbial adhesion and cell wall changes occur. Early developments in this area included Raman spectroscopy where the massive enhancement in the signal provided by rough silver surfaces15,16 led eventually to the idea of using a plasmonic metal coated AFM tip to create a local field enhancement and potentially single molecule spectroscopy. Tip-enhanced Raman spectroscopy has led to several important papers and a somewhat related technique of using coated nanoparticles to create local enhancements “SHINERS” has also been very interesting17 but both techniques have proved difficult to deploy; spectra appear to be highly dependent on the nature of the local probe and the stability and reproducibility of suitable probes are problematic.18 An alternative approach, using illumination of a sample through a scanning probe tip, thereby creating a highly confined area of illumination, and avoiding the diffraction limit, “scanning near field optical microscopy, SNOM or NSOM” has also been adopted successfully by many groups but again practical applications of this appealing technique have proved difficult.19
Much more recently it has been shown20,21 that electron energy loss spectroscopy (EELS) in transmission electron microscopy, can be obtained from impact rather than dipole scattered electrons, thereby enabling a lateral resolution that in ideal circumstances approaches atomic dimensions. This approach is undoubtedly a major step forward in our capability to fully characterise the chemistry of an interface at the best resolution one could hope for. The experiment requires the exacting conditions of the TEM experiment and it remains to be seen whether the full mid-IR vibrational spectrum of functional groups can be characterised and how well the spectra compare to the library of existing vibrational spectroscopic data but this is an exciting development that highlights the importance of highly resolved surface vibrational spectroscopy.
In this space, new approaches to obtaining infrared spectroscopy in the near field have been developed in the last decade. Two techniques, in particular, are becoming widely used. Photo-thermal infrared spectroscopy (AFM-IR)22–24 was the first to be developed and involves heating of the sample with a pulsed laser, the resulting rapid thermal expansion excites resonant oscillations in an AFM cantilever, the frequencies and amplitudes of the cantilever can then be related to the excitation wavelength and the local absorption. The spectra obtained from AFM-IR rely on a very different excitation mechanism to that in far field infrared absorption spectroscopy, and as with the near field Raman techniques, that has the consequence that the presence and intensity of particular vibrational modes can be difficult to relate between the two. In contrast to AFM-IR, a closely related technique that has been developed over the last decade, photo induced force microscopy (PiFM), delivers spectra that compare very closely to those from far field infrared spectroscopy (although subtle differences may arise).25 PiFM therefore offers an exciting new window into local surface chemistry with all the advantages of atomic force microscopy such as rapid sample preparation, broad applicability to analysis of samples of every type and operation under ambient conditions. Since its advent in 201026 PiFM has demonstrated its applicability in many different areas but its particular strengths in characterising the local chemistry of the surface have started to be exploited in the last two years and a review of its current and likely future impact is therefore timely. In this discussion we will consider how the approach has already led to an improved understanding of interface chemistry in a wide range of research areas and try to give a perspective on how it will guide the field in the next decade.
2. The origin of spectroscopic contrast in PiFM
The concept around which the PiFM technique was originally developed is mechanical detection of the attractive force between a surface dipole and its image dipole in a scanning probe tip. Whereas AFM-IR relies on short-range repulsive forces through direct contact, PiFM operates in non-contact mode giving a near background free measurement of attractive van der Waals forces. Initial models of the PiFM contrast mechanism were based on an induced force on the tip due to the interaction between the oscillating surface dipole and the induced dipole in the tip.27,28 The resulting gradient force, Fg, depends upon the polarisation of the particle in the z direction and because of its dependence, is highly localised that can be measured with very high spatial resolution.29–31
Subsequently, experimental evidence accumulated that the cantilever response was dominated by dissipative effects rather than the dispersive response predicted by the dipole–dipole force model,33,34 thus indicating the involvement of a thermal process in generating PiFM contrast. Jahng et al.'s model33 considered incident light causing a thermal expansion at the tip/sample junction and generating a force interaction through two processes: a “direct” contribution resulting from far-field transmission and absorption by the sample and an “indirect” contribution caused by the enhanced near field, generated by the antenna effect of the tip. The model indicated that the thermally stimulated forces would be as much as a hundred times stronger than the induced dipole force for most organic materials for mid infrared radiation and recent experimental data, utilising an innovative frequency domain force detection method that allows sub-μs time measurements,34 suggests the same is true in the visible/near infrared region where energy transfer is through electronic excitations.
More recently, Wickramasinghe et al.32 have published a detailed experimental study of the contrast mechanism which provides a definitive treatment of the problem and concludes that the PiFM signal is due to opto-mechanical losses. Their discussion starts by ruling out the involvement of thermal expansion; non-optical van der Waals forces are automatically excluded in PiFM but the team also rule out thermal modulation of optical van der Waals forces as a significant contributor to PiFM by measuring the sensitivity of the PiFM signal to thermal expansion using a mirrored lead zirconium titanate (PZT) crystal to generate similar van der Waals forces. A minimum expansion of 32 pm was determined to be necessary for detection by PiFM, slightly larger than the calculated expansion of the 60 nm polystyrene film studied in the paper and at least ten times greater than the < 3 pm expansion expected of a monolayer of self-assembled 4-methylbenzenethiol on gold surfaces which also gives a strong PiFM signal, Fig. 1. A separate experiment studying 60 nm poly(methyl methacrylate) (PMMA) on glass was used to demonstrate that the side bands monitored in PiFM (see below) are generated through amplitude rather than frequency modulation of the cantilever resonance, the excited molecule changing the effective damping constant of the cantilever. This is a dissipative effect (i.e. mechanical energy is lost to heat) rather than a dispersive one consistent with all the experimental measurements. The team propose a model involving the “optically mediated damping” of the viscoelastic or adhesion interactions between tip and sample. One way this could happen is that the surface molecules align with the electric field of the tip and then relax back to their equilibrium position as the tip withdraws creating an oscillation with a different phase shift to the phase of the tip.
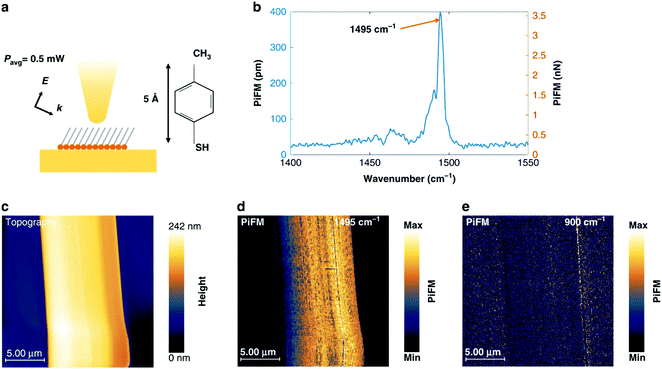 | ||
| Fig. 1 Demonstration of monolayer response by PiFM. (a) 4-Methylbenzenethiol (4-MBT) adsorbed on template-stripped gold. Excitation average power is 0.5 mW focused to 20 μm-diameter spot. (b) Point spectrum of 4-MBT showing resonance at 1495 cm−1. (c) Topography of gold island. (d) PiFM image at 1495 cm−1. (e) PiFM image off resonance. (Reproduced from Almajhadi et al.32). | ||
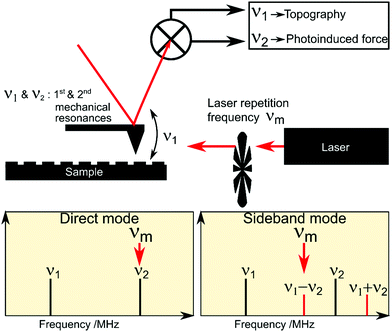
The topography of the sample and the photoinduced force gradient can extracted simultaneously from different orthogonal mechanical resonances of the AFM cantilever. A simple implementation, “Direct mode”, has the cantilever driven at the first resonance ν1, and the repetition rate of the exciting laser tuned to the second resonance ν2, topographical and photoinduced force signals are extracted simultaneously at the two frequencies, Fig. 2. A disadvantage of this approach is that the photoinduced force is measured which includes both the scattering and the gradient force contributions, so the required information is superimposed on a significant background signal. A more sophisticated approach makes use of the ‘optical heterodyne’ method in which the second of the two driving forces is tuned to a “beat” frequency, which in the simplest case corresponds to the difference or sum of the two mechanical resonances, i.e. ν1 − ν2 (or ν1 + ν2).35,36 In this “side band” implementation, an almost background free signal is obtained from the highly localised photoinduced force gradient at ν2, because the scattering force, which varies on the micrometre scale is effectively removed. Several exciting developments of the PiFM measurement approach have been made in recent years and a more complete discussion of the force heterodyne approach is given later in Section 6.1.
2.1 Polymeric systems
PiFM's ability to map the molecular composition of a surface is illustrated particularly well in studies of polymeric materials; typically, the PiFM images are used to show the distribution of different functional groups at the surface and with polymers, this means that domains are easily identified. A good example is Chen et al.'s recent study37 of the nanoscale-phase morphology of a blend of the polymer PBDB-T-2F (PM6)38 with varying quantities of a small molecule, non-fullerene, acceptor (IT-4F). Non-fullerene acceptors have tuneable absorptions extending further into the near-infrared than fullerene acceptors, increasing the light absorption. Non fullerene based organic solar cells also give efficient charge transfer at much lower (virtually zero) energy offsets than fullerene-based devices and thus achieve higher open-circuit voltages. Central to the performance of the organic solar cell is the photoinduced charge transfer at the interface between the two different components and this will be dependent on several factors including domain size and phase segregation of the two components but our understanding of the relationship between charge transfer and the macroscopic non-fullerene acceptor phase properties is still lacking. PiFM's unique ability to map the chemistry across a surface provide an insight into those properties in the PBDB-T-2F/IT-4F system, Fig. 3.38 Thin films of the polymer mix with differing percentages of IT-4F added to the PBDB-T-2F were examined,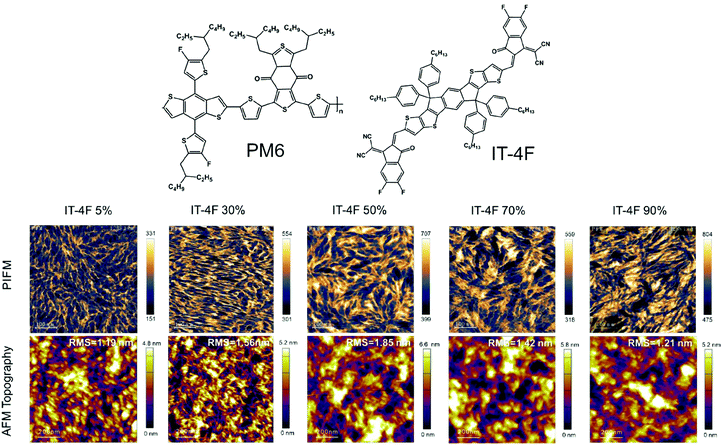 | ||
| Fig. 3 Comparison of PiFM imaging of the distribution of IT-4F in PBDB-T-2F (PM6) using its IR absorption at 1288 cm−1 with AFM imaging of the topography, (adapted from Fig. S4 of Mandemaker et al.38). | ||
Whilst the AFM images show the root-mean-square surface roughness of the samples increasing from 1.19 nm at 5% IT-4F to 1.85 nm at 50% and then decreasing to 1.21 nm at 90%, the PiFM images show the steady increase in IT-4F domain size with IT-4F concentration, Fig. 3. Chen et al. quantify the IT-4F domain size and show that it corresponds to the relative extent of diffusion-mediated hole transfer.38
The formation of metal–organic-framework thin films is another system that demonstrates the potential of PiFM in nanoscale chemical mapping. Weckhuysen et al.39–41 studied the layer by layer deposition of [Cu3(btc)2(H2O)n] a surface-anchored metal–organic framework (SURMOF) known as “HKUST-1” from copper acetate (Cu(CH3COO)2, CuAc2) and 1,3,5-benzene tri-carboxylate (btc) precursors. The earliest of the three papers41 is particularly interesting with data from PiFM, photo-thermal nano-infrared spectroscopy (AFM-IR) and far field infrared reflection absorption spectroscopy (IRRAS)
There is excellent agreement in the PiFM and IRRAS spectra throughout the paper both in terms of peak positions and signal intensities but the different spectroscopies used each contribute distinctly different pieces of information to the study from their different capabilities. A broad peak at 1570 cm−1 in the IRRAS data from partially and fully dipped surfaces was attributed to the COO− asymmetric stretching vibration of a Cu2Ac4 precursor (shown in Fig. 4c for comparison). The authors propose that these physisorbed species play a critical role in the development of the HKUST-1 SURMOF and are responsible for the rate of film growth being significantly greater than that expected from a simple layer by layer mechanism. AFM-IR spectra at individual points on the growing films, Fig. 4, reinforces this conclusion showing the presence of defect-rich SURMOF islands on both the Au/Si and Au/mica surfaces, Fig. 4c, #1 & #2, whereas areas of the Au/mica surface without SURMOF islands are covered with an amorphous layer of Cu2Ac4, Fig. 4c, #3. Such localised information is only available with PiFM.
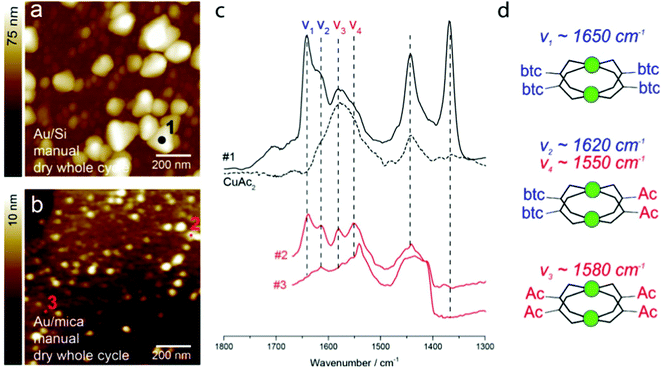 | ||
| Fig. 4 AFM images and photo-thermal nanoinfrared (AFM-IR) spectra recorded on Au/Si and Au/mica HKUST-1 SURMOF thin films. (a) AFM image of a thin film on Au/Si measured after 5 deposition cycles using manual synthesis with drying each whole cycle. (b) AFM image of a thin film on Au/mica measured after 2 deposition cycles grown in the same way as (a). (c) Representative nano-IR spectra recorded at different positions for the substrates presented in (a), (b). Spectrum (#1) is taken on top of a large SURMOF grain (1 black), spectra #2 and #3 are taken at two different positions. An IRRAS spectrum of CuAc2 (dotted line) is added for comparison. (d) Vibrational modes assigned to COO@ originating from the different Cu-paddle-wheel substitutions. Note that models are simplified for clarity by omitting C and O atoms coordinated to copper; copper atoms are depicted in green. (Reprinted from Delen et al.41). | ||
PiFM maps of the developing surfaces show the tight correlation between the AFM topography and the chemical composition predicted by the IRRAS and AFM-IR and the characteristic presence of btc on the high features and their absence in the lower areas, Fig. 5. In the two subsequent papers the team study the effect of temperature on the rate of SURMOF formation39 and the potential of spin coating as a deposition method for the films.40 In both cases PiFM adds valuable information through mapping molecular composition with sub-micron lateral resolution.
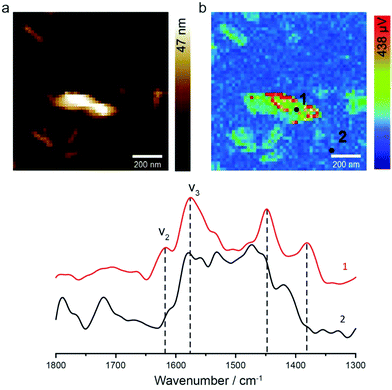 | ||
| Fig. 5 PiFM maps at 1450 cm−1 corresponding to the btc benzene breathing vibration, of a 1 layer HKUST-1 SURMOF thin film prepared using manual synthesis, including a drying step each half cycle. (b) Point IR spectra taken at positions 1 (red) and 2 (black), on and off the top of a high feature. (Reprinted from Delen et al.41). | ||
A closely related paper42 by the same group applied PiFM to the study of ZSM-5 thin-films, prepared with a range of Al:Si ratios. The paper beautifully illustrates the power of PiFM's locally defined spectroscopy with a study of the asymmetric framework vibration of zeolites with different Si/Al ratios normally expected at 1107 cm−1. The greater length of the Al–O over that of the Si–O (1.75 Å and 1.61 Å respectively), together with the lower mass of the Al atom leads to a split in this peak when Al is introduced into the lattice giving a pair of peaks at ∼1109 cm−1 and ∼1082 cm−1. The PiFM spectra, Fig. 6a–c, clearly show the two components but also the variation in their relative intensities at different positions on the zeolite film, perhaps reflecting a difference in the local concentration of aluminium. A further element to this study is very informative about the capabilities of the PiFM technique. The aluminium containing zeolite was used to catalyse the methanol-to-hydrocarbons (MTH) reaction at 623 K for 4 hours and the sample subsequently studied with both PiFM and confocal fluorescence microscopy. Whereas the latter showed a honeycomb-like fluorescent structure from the deposited coke species, PiFM showed a homogeneous distribution of hydrocarbons on the surface. The difference between the two was attributed to the greater surface sensitivity of PiFM (∼30 nm).
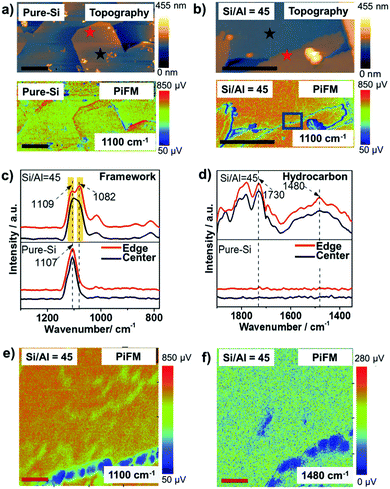 | ||
| Fig. 6 (a) and (b) AFM topography (top) and photoinduced force microscopy (PiFM, bottom) image at 1100 cm−1 of zeolite ZSM-5 thin-films grown in a secondary growth media with ethanol as the structure directing agent and Si/Al = (a) N and (b) 45. (c) and (d) PiFM point spectra show (c) zeolite framework vibration and (d) hydrocarbon vibration distributions at different locations indicated by the stars with corresponding colours in (a and b) in the zeolite ZSM-5 thin-films after a 4 h methanol-to-hydrocarbons (MTH) reaction at 623 K. (e) High resolution PiFM image of the framework vibration at 1100 cm−1 of the zeolite thin films from the region highlighted in (b). (f) Product/coke distribution in the same area measured with PiFM at 1480 cm−1 representing the CQC stretch of hydrocarbons. The black and red scale bars represent 1 mm and 55 nm, respectively. Images (e and f) are shifted with respect to each other due to thermal drift between the tip and the sample. (Reproduced from Fu et al.42) | ||
Another example of PiFM's ability to map different polymer domains is a study of urethane–acrylic hybrid dispersions by Chen et al.43 Urethane–acrylic hybrids are created by adding acrylic monomers during the dispersion process of the urethane prepolymer and the resulting materials show significant mechanical advantages over polymer blends. Using the characteristic acrylic and urethane absorption bands at 1730 cm−1 and 1705 cm−1 respectively, Chen et al. used PiFM to map the distribution of the two components and establish acrylic domain sizes of ∼30–40 nm supporting the proposal that the enhanced physical behaviour of the hybrids is due to smaller domain sizes than is found in blends. Have et al.44 applied PiFM to a slightly different problem, comparing it with two commonly used light scattering techniques: nanoparticle tracking analysis and multi-angle dynamic light scattering, for the determination of nano-plastic particle size distributions and concentrations in seawater. The main drawback of PiFM's relatively slow throughput was offset by its ability to distinguish easily between nano-plastics and other nano-particles that interfere with the light scattering technique results.
3. Biological surfaces
Infrared spectroscopy has a long history of use in biological systems,45,46 both as an analytic tool to identify molecules present in samples but also as a means of gaining information on the structure of the molecules through characteristic changes in vibrational frequency and intensity. Such information is potentially even more powerful if it can be used to build molecularly specific maps with lateral resolutions on the order of a few nanometres. Whilst PiFM is at somewhat of a disadvantage, compared to Raman for example, in biological systems because of the difficulties caused by the presence of water damping the infrared signals, nevertheless several researchers are already exploring this field. For example, Ping et al.47 have used PiFM to image genetically modified rod shaped E. Coli bacteria used as bio templates to produce rod-shaped silica particles. R5 proteins on the surfaces of typical E coli were modified to form silafin-derived 5R5 which acts as a nucleation point for silicification at the surface of the bacterium. PiFM was used to map the distribution of 5R5 at the surface through the distinctive peak at 1200 cm−1, attributed to the C–N stretching vibration of primary amines in the R5 peptide and not found in spectra of the bare E. Coli surfaces. The chemically sensitive mapping showed that the areas with highest protein concentrations were most prevalent along the edges of the bacteria. This correlated very well with the PiFM mapping of the Si–O–Si vibration of nucleated silica at 1100 cm−1 after the surface had been exposed to a silica precursor.Two distinctive vibrations arising from the amides present in many important organic molecules such as proteins, RNA and DNA, are frequently used to characterise biological materials. These are the “amide I” band, which occurs between ∼1600 cm−1 and 1700 cm−1 and arises principally from the C![[double bond, length as m-dash]](https://www.rsc.org/images/entities/char_e001.gif) O stretch of the group, and the “amide II” band which lies between ∼1500 cm−1 and 1600 cm−1 and is due to a combination of the N–H bending and C–N stretching vibrations. In 2019, Marsh et al. took advantage of these distinctive bands to image artificially constructed icosahedral protein cages48 with PiFM confirming their dimensions and shape. Russo et al. used the same distinctive amide bands to map the concentration of PSLG polypeptide on the surface of capped silica nanoparticles for use in a liquid crystal system, Fig. 7.49
O stretch of the group, and the “amide II” band which lies between ∼1500 cm−1 and 1600 cm−1 and is due to a combination of the N–H bending and C–N stretching vibrations. In 2019, Marsh et al. took advantage of these distinctive bands to image artificially constructed icosahedral protein cages48 with PiFM confirming their dimensions and shape. Russo et al. used the same distinctive amide bands to map the concentration of PSLG polypeptide on the surface of capped silica nanoparticles for use in a liquid crystal system, Fig. 7.49
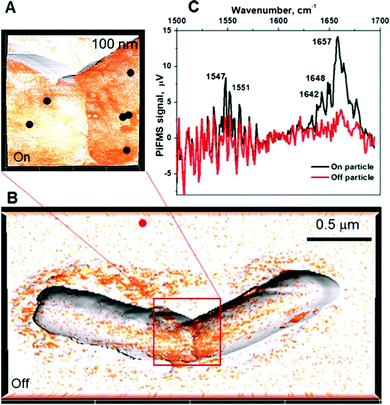 | ||
| Fig. 7 Photoinduced force microscopy (PiFM) typical results: (A and B) PiFM images overlaid on 3D topography images show distribution of the PSLG polypeptide (the orange regions identify where the PSLG polypeptide is located). The black points represent the locations on the PSLG-HemiSil surface where PiFM spectra were collected, while the red point indicates the off-particle location used to collect a PiFM spectrum. (C) PiFM signal versus wavenumber for the locations indicated by the black and red dots, showing the amide I and amide II signals characteristic of the PSLG polypeptide. Exposure time was 100 ms per wavenumber. (Reprinted with permission from Langmuir, 2016, 32, 13137–13148 copyright 2016 American Chemical Society.49). | ||
Ji et al.50 also used the characteristic amide I and II bands in α-helical and random coiled DNA to establish PiFM as a potential analytical technique for the detection of three different biotoxins: brintoxin (ABR), ricin toxin (RT) and Clostridium perfringensexotoxin (ETX), Fig. 8. In all cases, PiFM combined with principal component analysis (PCA) was able to accurately detect the presence of the biotoxins deposited on mica surfaces. Intriguingly, Ji's work suggests that when bolstered by PCA, PiFM is capable of distinguishing single molecule protein particles. Its noticeable in Ji's data that the PiFM spectra show much narrower line widths than those of the far-field FTIR. This may be due to a number of different factors including nanoscale heterogeneities but may also be related to differing selection rules and is an aspect which should be investigated in more detail.
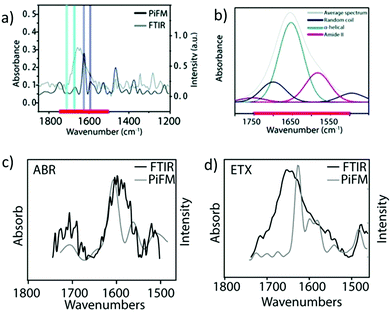 | ||
| Fig. 8 Comparison between PiFM and FTIR of three biotoxins: brintoxin (ABR), ricin toxin (RT) and Clostridium perfringensexotoxin (ETX). (a) RT; (b) Fitting of FTIR of RT; (c) Comparison of FTIR and PiFM between 1500–1750 cm−1 of (c) ABR and d) ETX. Reproduced from Ji et al.50 | ||
In a similar vein to Ji et al., Abrego-Martinez et al.51 have used the characteristic amide vibrational bands of proteins in PiFM spectra to confirm the binding of the SARS-CoV-2 spike protein (S-protein) to aptamer functionalised gold surfaces as part of a proposed detection method of SARS-CoV-2 using electrochemical impedance spectroscopy to provide a fast and simple alternative to the typical PCR test. The aptamers target the receptor-binding domain in the S-proteins of SARS-CoV-2.
PiFM showed a decrease from 16.6 to 12.3 nm in surface roughness when bare gold nanoparticles functionalised with aptamers which the authors attribute to the formation of a monolayer, Fig. 9.51 When this surface was subsequently exposed to S-proteins the roughness increases to 25 nm caused by the deposition of scattered features with 15 nm height which is consistent with S-protein height detailed in previous literature.52,53 The PiFM spectra showed a significant increase in intensity in the 1400 cm−1 region attributed to the amide III vibration modes from the peptides in the S-protein confirming its presence upon the surface. There were also changes in the chemistry of the ssDNA aptamer before and after exposure to the S-proteins with the PiFM showing a shift in the amide I band from 1680 cm−1 to 1730 cm−1 due to the binding with the S-proteins. The PiFM spectra show other changes too which it would be interesting to explore, the appearance of a ∼1280 cm−1 peak for example which Kitane et al. attributed to the PO2− asymmetric stretching vibration of the phosphate backbone.54,55
 | ||
| Fig. 9 Three-dimensional topography and PiFM intensity at ∼1400 cm−1 representations of the AuNPs-, Aptamer/AuNPs- and S-protein/Aptamer/AuNPs-modified SPCEs. According to the PiFM spectra and targeting selected peak shifts for best chemical contrast, the common wavenumbers at (∼1050, ∼1390 cm−1 and 1680–1730 cm−1) were selected for PiFM mapping. Reprinted J. C. Abrego-Martinez, M. Jafari, S. Chergui, C. Pavel, D. Che and M. Siaj, “Aptamer-based electrochemical biosensor for rapid detection of SARS-CoV-2: nanoscale electrode-aptamer-SARS-CoV-2 imaging by photo-induced force microscopy”, Biosensors and Bioelectronics, 2022, 195, 113595, Copyright (2022), with permission from Elsevier.51 | ||
In a slightly different area of research, Kesari et al.'s study of ultrathin microtome sections of Norway Spruce demonstrates the potential of PiFM for visualising the chemical composition of cell walls.56 Using vibrational bands at 1505, 1471, 1220 and 1145 cm−1, the distribution of lignin and cellulose was mapped across cell walls, Fig. 10. High lignin concentrations were found in the compound middle lamella (CML), and cell corner middle lamella (CCML) areas of the cell wall.
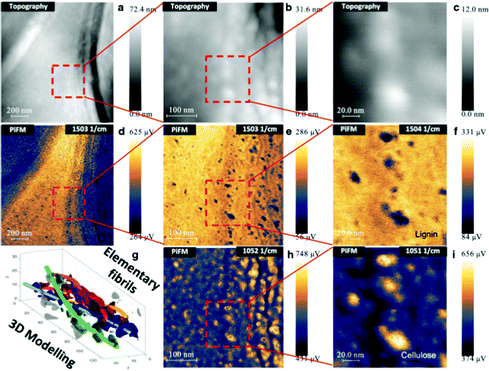 | ||
| Fig. 10 Topography (a–c) and PiFM images of an ultrathin Norway spruce cross-section at ca. 1503 (d–f) and 1052 (h and i) cm−1 at three different magnifications (dimensions shown by the scalebars). A TEM tomography image of a helical cellulose elementary fibrils (EF) bundle with its dimensions (nm) is also shown (g) (Reza et al.57). The vertical cellulose-rich patterns in the PiFM images at ca. 1050 cm−1 may represent tangentially organized EF bundles that are typical of the S1 layer of Norway spruce tracheids. Reproduced from Kesari et al.56 | ||
Much smaller features, with dimensions of between 5–20 nm were imaged by decreasing the PiFM step size from 3.9 to 1.6 and 0.6 nm. These smaller areas were uncharacteristically low in lignin for sublayers 1 and 2 but showed a strong absorption at 1051 cm−1 which is characteristic of cellulose. The features were therefore identified as elementary fibrils (EF's) which are dispersed throughout the cell wall. Measurements of the smallest possible cellulose elementary fibrils were found to be approximately 5 nm which agreed with literature values58,59 of 3.2 × 5.3 nm cross-sections, with aggregations of molecules reaching 20+ nm. Kesari et al.'s findings agree with those of Gusenbauer et al.60 who concluded similar sized EF aggregates were present based on AFM-IR data, however single EF molecules were more easily identified with the 2–4 times better resolution of PiFM over AFM-IR.
A very different use of PiFM was demonstrated by Zhao et al. studying Eu3+ nanostructures as a potential system for biometric recognition.61 The Eu3+/oleic acid complexes were placed under a protein skin and their chemical composition and morphology studied with PiFM using the amide II band at 1540 cm−1, and the OEu3+Phen complex carboxyl band at 1663 cm−1, Fig. 11.
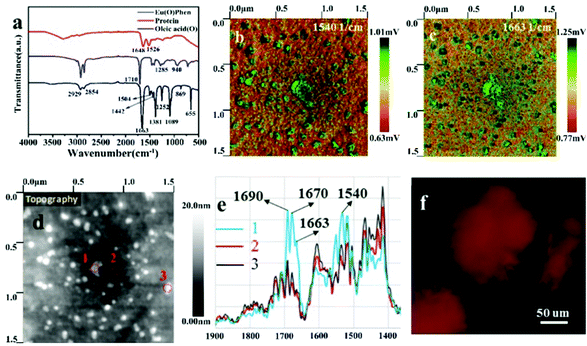 | ||
| Fig. 11 The concentration of oleic acid used during nano-label synthesis was 0.05 mol L−1 in FTIR spectra and PiFM images.(a) FTIR spectra of protein, oleic acid, and OEu3+Phen complexes; PiFM images taken with laser tuned to (b) 1540 cm−1 for protein and (c) 1663 cm−1 for OEu3+Phen complexes in the sample; (d) the detection points of the sample, overlaid on a topographical map; (e) PiFM infrared spectra for the detection points; (f) the fluorescence microscopy image of the sample. Reproduced from Zhao et al.61 | ||
4. Inorganic surfaces
PiFM is well suited to the study of inorganic surfaces and its potential uses in the geological sciences has been outlined by Otter et al.62 More recently Patabendigedara et al. used PiFM to determine the water content of different nominally anhydrous materials.63 This is one of the first papers to mainly focus on the PiFM spectra rather than the topographical mapping features and shows a good comparison between FTIR and PiFM. Measurements of a polycrystalline forsterite sample were taken across grain boundaries, Fig. 12. The authors separated the high wavenumber areas of these PiFM spectra (3000–3700 cm−1) into three distinct regions corresponding to: silicon [Si], titanium [Ti], trivalent [tiv] and magnesium [Mg] bands.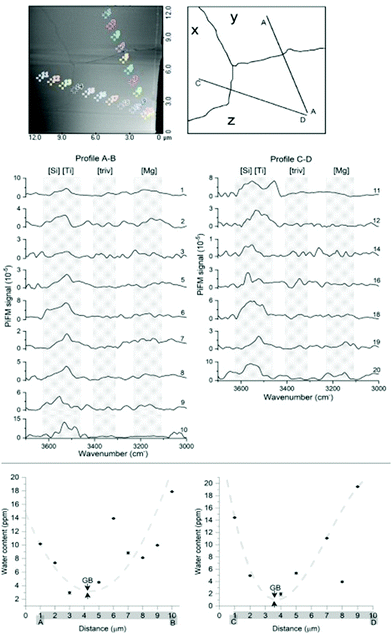 | ||
| Fig. 12 Series of PiFM spectra from the polycrystalline forsterite sample. Two profiles are attained perpendicular to both two-grain boundaries. The water distribution profiles (bottom figure) were created using the estimated water content from point spectra. Patabendigedara et al. (Reproduced from Patabendigedara et al.63). | ||
The area under each of these regions was assumed to be directly proportional to the hydroxyl content and used to calculate the water content at each point. In this way the authors were able to map and quantify the water content across the surface of the sample. The authors concluded that the majority of water content is located in the centre of crystal grains rather than at the grain boundary as shown in the U shaped graphs in Fig. 12. While the PiFM spectra and FTIR spectra are in good agreement, there is more detail in the PiFM than the FTIR. This is similar to the results seen by Ji et al.50 The authors suggest that this could be a result of several factors which warrant further investigation, but a major factor is likely to be the small area over which PiFM measurements are made in comparison to far-field FTIR, (<10 × 10 nm2 compared to 60 × 60 μm2 spot). This means that FTIR spectra can miss additional details corresponding to nanoscale heterogeneities and the quantification work undertaken by Patabendigedara et al. using the PiFM data would not be possible with a traditional FTIR system.
Nan et al.64 used a combination of TEM-EDX and PiFM to analyse abiotic carbonaceous matter present in geological samples taken from the Yap Trench. Igneous peridotite rocks undergoing serpentinization on the oceanic floor are thought to play a key role as energy sources for microbial ecosystems. Furthermore, these materials have high nanoscale porosity and TEM-EDX showed that the nanopores contain large amounts of carbon. However, this technique does not give any chemical information and PiFM was combined with RAMAN to characterise the chemical composition of the nanopore. The PiFM showed that condensed carbonaceous matter (CCM) was often located in the nanopores and grain boundaries of the rocks and contained C![[double bond, length as m-dash]](https://www.rsc.org/images/entities/char_e001.gif) C stretching modes corresponding to aromatic compounds which was confirmed by the RAMAN. Analysis showed that >70% of nanopores across a 2.3 μm2 area contained CCMs.
C stretching modes corresponding to aromatic compounds which was confirmed by the RAMAN. Analysis showed that >70% of nanopores across a 2.3 μm2 area contained CCMs.
No evidence of functional groups or thermally degraded biogenic matter was detected and since prokaryotic microorganisms would be too large to colonise the 50 nm wide nanopores, the authors conclude that the CCM is abiotic in origin. Typically, the CCM regions were also surrounded by areas rich in iron oxide leading to a suggestion that the CCMs were synthesised by a Fischer–Tropsch like reaction catalysed by the Fe minerals.
Werny et al.65 analysed the morphological changes in SiO2 supported single metallocene-based ethylene polymerization catalysts. Morphological changes such as fragmentation and sectioning are key for developing catalysts with high activity due to the build-up of polymers in the active sites of the catalyst, blocking further reaction. Fragmentation and sectioning of the catalysts results in the development of new catalytic sites which circumvents mass transport limitations and maintains catalytic activity. Two structurally homogenous SiO2 supported catalysts were preactivated with methylaluminoxane and paired with either Hf or Zr metal which were selected because of their very different activities with SiO2/MAO/Zr having a 40× higher productivity. Slices of each catalyst were prepared by focused ion beam and analysed using SEM and PiFM. The SEM images showed contrast between the silica body and the pore with fragmentation visible in both catalysts after an hour of reaction. The SiO2/MAO/Hf showed large areas of pristine SiO2 whilst the SiO2/MAO/Zr catalyst had visible nano-cracks throughout the material. PiFM was used to verify the SEM data with the ν(Si–O) and δ(C–H) regions highlighting the core and polymer phases clearly, Fig. 13 While no pure polymeric regions could be located, average PiFM spectra showed that the polymer rich and poor regions can be identified based on the relative intensity of the δ(C–H) region.
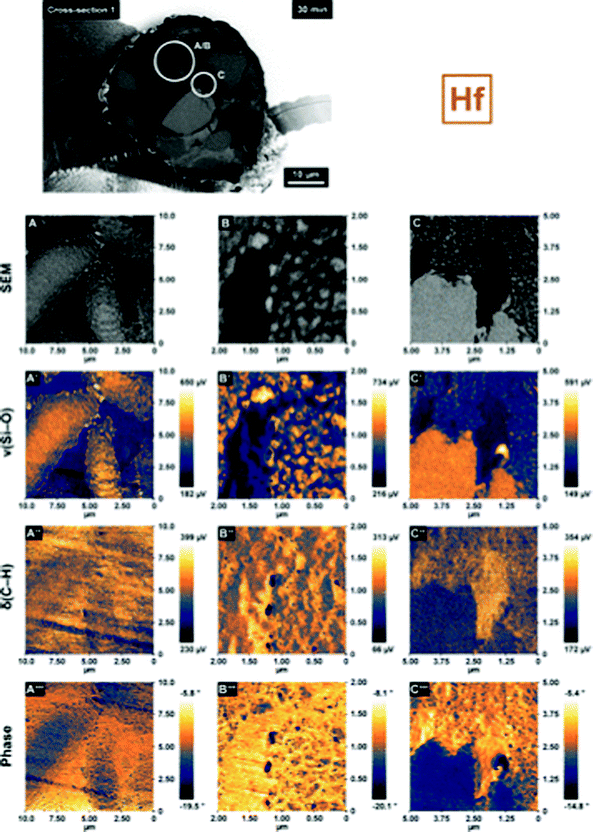 | ||
| Fig. 13 Local catalyst morphology as recorded by scanning electron microscopy (SEM; A, B, C),and chemical composition as imaged by infrared photoinduced force microscopy (IR PiFM) (ν(Si–O), 1050–1030 cm−1, A′–C′ and δ(C–H), 1472–1460 cm−1, A′′–C′′), and relative mechanical properties as determined by phase shift imaging (A′′′–C′′′). All data were collected on the cross-sections of a single 30 min prepolymerized SiO2/MAO/Hf particle. Images in panels B–B′′′ were recorded in the same area as those in panels A–A′′′ but at a higher magnification. (Reproduced from Maximilian et al.65). | ||
Simultaneous phase imaging of the catalysts shows sharp contrast between the polymer and SiO2 regions because of the lower mechanical stiffness and higher viscoelasticity of the polymeric phase. This provided clear mapping of the polymer phases revealing fibre like structures weaved through the material. The combined FIB-SEM and PiFM approach uncovered significant morphological information which, when combined with real-time FTIR delivered key mechanistic insights.
Two recent papers from our own laboratory have shown the capability of PiFM to provide detailed information on the structure and formation of nanoparticles which could significantly aid the refinement of synthetic methods. Studying the development of hematite nanorods, Allender et al.66 compared growth mechanisms using two different structure directing agents, in the presence of 1,2-diaminopropane the initial growth of the nanoparticles was shown to involve a goethite intermediate that subsequently underwent dissolution and recrystallisation to give the anisotropic growth of hematite. In contrast, using phosphate as the directing agent akaganeite was identified on the edges and apex of the nanorods consistent with a model in which akaganeite subunits convert into hematite, Fig. 14.67 In a separate study, Allen et al.68 studied the one pot synthesis of cerium phosphate nanorods synthesising nanoparticles with aspect ratios between 3–24.8. PiFM was used to map the structure of the surface of the rods using the distinctive vibrational spectra of the hexagonal and monoclinc phosphate structures. The study showed that contrary to the results from bulk characterisation by XRD and Raman, which showed a purely hexagonal structure, the surface region of the rods contained domains of monoclinic phosphate. There was also evidence to suggest the presence of carbonate and hints of a correlation between the carbonate and monoclinic domains. Whilst the data in these studies was largely supportive of other more established techniques, the unique capabilities of PiFM to improve our understanding of nanoparticle properties and synthesis is very clearly demonstrated.
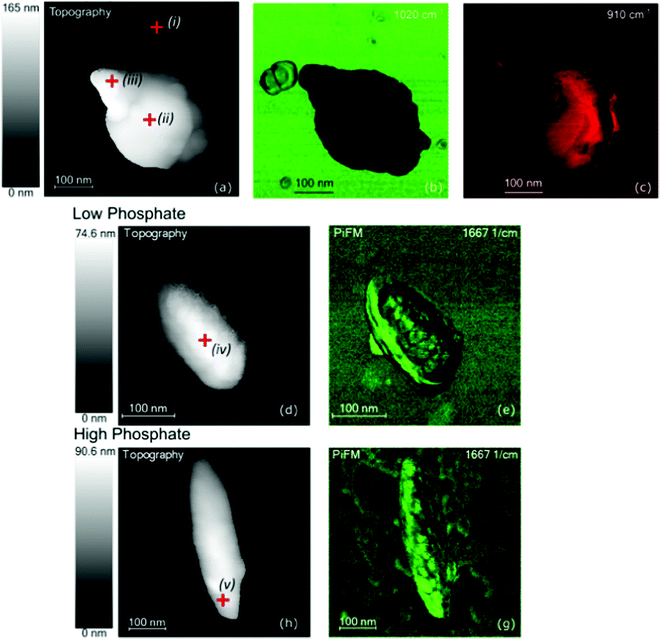 | ||
| Fig. 14 Topography (left-hand side) and PiFM intensity maps of three nanoparticles synthesized under different conditions. The frequencies at which the intensity maps were recorded are indicated on the images. (a)–(c) A 1,2-diaminopropane-directed particle synthesized at 160 °C and therefore still in the process of forming the anisotropic rods. (d) and (e) A particle synthesized in the presence of 2.5 × 10⁻³ M phosphate solution and aged for 48 h. (h) and (g) A particle synthesized in the presence of 6 × 10⁻³ M phosphate solution and aged for 72 h. Reproduced from Davies et al.66 | ||
5. Surface field mapping
The examples discussed so far have focused on the vibrational spectroscopy of chemical bonds with PiFM, however the technique is also sensitive to oscillations at different frequencies, and in particular, the near infrared and visible region. It is thus able to detect surface plasmon polaritons (‘SPP’) which are oscillations in the electrons confined to the interface between a conductor and a dielectric.69 SPP's find use in fields as wide ranging as tip-enhanced Raman scattering and photocatalysis, and, being very sensitive to the condition of the surface, they are widely used to monitor adsorption in a variety of different sensor applications. More recently, SPP's have been studied in connection with nano-photonic technologies because the relatively short wavelengths of the surface waves allow these very high-speed devices to be built with much smaller dimensions than is possible using “volume” oscillations.70 PiFM has a significant advantage over other techniques used to study SPP's because both the excitation and response measurement occur in the near field and this results in much higher signal to noise ratios than is the case when either the measurement or excitation occurs in the far-field, for example near field scanning optical microscopy (NSOM).71 Liu et al. exploited PiFM's high quality signal to study graphene plasmons (GPs), a popular research topic due to their uniquely long propagation length and tunability.72,73 Liu measured the distribution of GPs across a monolayer of graphene on a YbF3 spacer on top of a grating of gold, using PiFM to characterise the plasmonic nature of the grating. The results showed the GPs to be mainly concentrated on the areas over the trenches in the grating. By selecting random points along the surface of the material the authors were able to calculate the average PiFM signal and hence the amplitude of GPs in the trench and grating edge, they also calculated the propagation length of the plasmons at a given excitation wavelength, an important parameter for practical application of SSP's.Like the plasmon polaritons in graphene, phonon polaritons in hexagonal boron nitride (h-BN) have been extensively investigated for potential uses in nano-photonics. Two strong ‘Restrahlen’ bands are used to study phonon polaritons: “RS1” in the region 780–830 cm−1 and “RS2” between 1370–1610 cm−1. While RS2 has been well studied with SNOM, RS1 remains a challenge because of a lack of the necessary continuous-wave lasers needed for the interferometric detection schemes of s-SNOM. However, Ambrosio et al.74 have shown that PiFM can be used to analyse both the RS1 and RS2 bands of h-BN. Tamagnone et al.75 compared the ability of PiFM and SNOM to study the h-BN polaritons and showed that PiFM was able to map all the resonant modes in a single scan with strong agreement to both calculated and SNOM distributions. PiFM produced a strong signal for mapping the amplitude of the RS1 band, shown in Fig. 15. However, for the RS2 band, whilst SNOM and PiFM showed the same wave distribution, SNOM provided clearer and stronger signals under this condition.
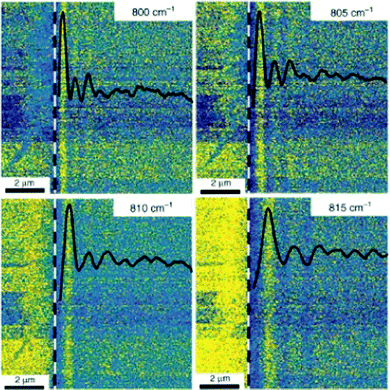 | ||
| Fig. 15 PiFM imaging (and profile) of the fringes that are induced by the interference of the guided modes with the material component at the tip location for various frequencies (wavenumbers) of the illuminating light in the first RS band. The white dashed line represents the position of the flake edge. (Reproduced from Ambrosio et al.74). | ||
Working at much shorter wavelengths, Xu et al.76 produced bi-functional photocatalysts capable of absorbing both the IR and UV-VIS components of solar energy. The hybrid structure consisted of vertically stacked IR-absorbing graphene “nano-petals” supported by UV-VIS absorbing graphitic carbon nitride. PiFM was used to measure the propagation of GPs along the material. Topographical information highlighted sharp petal edges which are interfaces between the two structures. When combined with spectral information these topographical features showed as hot spots of plasmonic activity and acted as nano-antennas for field enhancement, Fig. 16c.
 | ||
| Fig. 16 PiFM near-field nano-imaging of protruding GP edge nano-antennas in the near-IR range: (a) schematic illustration of PiFM near-field nano-imaging of a single GP. The red dot along the GP edge represents the ‘hot spot’ field enhancement signal. (b) Typical PiFM topography of GP edge nanoantenna arrays. (c) Corresponding PiFM signals with apparent ‘hotspots’ along the edge nano-antennas at an incident laser wavelength λ of 1.8 μm. (For interpretation of the references to colour in this figure legend, the reader is referred to the web version of this article.) (Reproduced from Xu et al.76). | ||
6. Method development
PiFM is a relatively new technology, and its capabilities are rapidly improving, including increasing spatial resolution, sensitivity, and conditions under which the technique can operate. Some relatively simple methods have been suggested to increase the quality of PiFM imaging, carrying out measurements under vacuum for example which, not only maintains a surface in its pristine state,77 but also prevents surface water layers and photothermally induced acoustic waves, which, as O’Callahan et al. discuss can have a detrimental effect on the cantilever.78 However, carrying out PiFM measurements in vacuum incurs other problems, including increased impact of the photothermal effect arising from the cantilever absorbing scattered light giving a vibration with a different phase to the photoinduced force.796.1 Alternative heterodyne measurement configurations
One aspect in which there has been considerable interest is the sideband heterodyne detection method described in Section 2. Xu et al., propose two alternative heterodyne measurement approaches for PiFM, illustrated in Fig. 17.80 The first, referred to as the “harmonic” heterodyne configuration is designed to counter the high laser repetition rate necessary to conduct the sideband measurement described in Section 2, a typical configuration requiring a rate of ∼1.32 MHz which is out of the range of many light sources. Xu et al. show that the repetition rate can be set at an integer fraction of the frequency difference between ν1 and ν2, reducing both the laser repetition rate and the laser power. The effectiveness of the harmonic configuration is demonstrated with images of a mixed polymer film of a similar quality to the high frequency approach. A second approach, called the “sequential” heterodyne configuration, which can be combined with the harmonic mode, introduces another modulation to the infrared light source at a frequency νm, is demonstrated with a polarization switch and introduces additional possible modulation channels.
 | ||
| Fig. 17 Generalized heterodyne configurations proposed by Wang et al.82 Harmonic heterodyne detection is illustrated for the first integer fraction of ν2 − ν1, but higher order fractions are also possible. Sequential mode involves the addition of another modulation which could be in intensity or for example in frequency. | ||
Yamanishi et al. have considered another aspect of the sideband heterodyne implementation,79,81 which is that in order to prevent the tip jumping to contact, the cantilever is usually driven at its first mechanical resonance frequency, ν1, and the photoinduced force therefore measured near to the second at ν2. However, the higher spring constant of the cantilever at ν2 leads to a lower sensitivity. This is particularly relevant to PiFM measurements in vacuum where the higher cantilever Q factor results in a greater degree of signal degradation. Yamanishi et al. have proposed79,81 an alternative “heterodyne frequency modulation” arrangement that uses frequency rather than amplitude modulation to create the heterodyne signal. The cantilever is driven at ν1 but, unlike the sideband configuration, the intensity of the illuminating laser is modulated at 2ν1 + νm. This results in a mixed signal at ν1 + νm and 3ν1 + νm so that the photoinduced force gradient is measured close to ν1 with a much-enhanced sensitivity and an estimated minimum force measurement of 419 fN.
Using heterodyne frequency modulation configuration described above, Yamanishi et al.83 have studied dumbbell shaped Zn–Ag–In–S (ZAIS) quantum dots recording images with a lateral resolution of ∼ 0.7 nm, Fig. 18, ∼10 times better than the standard configurations and represent the best resolution achieved with PiFM to date. Furthermore, Yamane et al. have suggested that because PiFM measures both the vertical and horizontal components of the gradient of the electric field84 even higher resolutions are theoretically possible. They speculate that even atomic resolution might be achieved for PiFM measurements undertaken in cryogenic conditions using “picocavities” as a ‘super tip’.85
 | ||
| Fig. 18 PiFM imaging on one nanoellipsoid of a ZAIS QD. (a) AFM image of the ZAIS QD. (b) and (c) PiFM images of the ZAIS QD at 660 and 785 nm, respectively. (d) Δf(fm)X at 660 nm, and the profile of Δz in the middle of the ZAIS QD. This plot indicates that a spatial imaging resolution of ∼0.7 nm was achieved. The positions at which the profiles were acquired are indicated in the insets. During imaging, the tip–sample distance was controlled via feedback control (Δf = −20 Hz) with A = 10 nm. (Reproduced from Yamanishi et al.83). | ||
6.2 Tip selection
As the calculations of Yamane et al. discussed above make clear,85 PiFM measurements rely greatly on the nature of the tip used. In connection with this point, Huang et al.86 investigated PiFMs ability to measure the surface field of gold nanoparticles supported on glass and calculated the optical force between a 30 nm gold nanoparticle and AFM probes made from different materials. The calculations for the Au coated AFM tips closely matched experimental results producing a signal 18.5 times stronger than that from thermal noise, Fig. 19, and showed that only Au or Ag coated tips produced signals strong enough for PiFM measurements unless measures were taken to reduce the background noise such as conducting the analysis in low temperatures and/or under vacuum.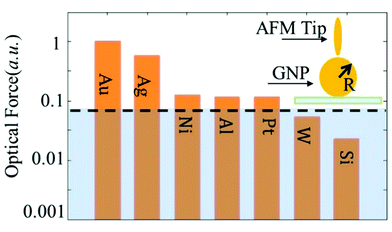 | ||
| Fig. 19 Normalized optical force detected by AFM tips coated with different metals while measuring a 30 nm Au particle with incident light at 660 nm in the |Ez| incident field of different permittivity of the tip calculated by COMSOL. (Reproduced from Huang et al.86). | ||
The gold coated tips typically used in AFM measurements are produced through the sputtering Si AFM probes with gold, but this can produce larger diameter probes with low symmetry due to rogue gold particles being deposited randomly and these imperfections can lead to produce unwanted distortion of PiFM images.87 Rajaei et al.88 circumvented the need for a gold-sputtered tip while maintaining strong signals by using a gold nanoparticle adsorbed at the surface. A typical Si tipped cantilever was used to measure the surface field of gold dimers and clusters excited by linearly polarised light. This method works as rather than depending on the force being exerted from the tip to a glass slide, the dipole force is exerted by the gold nanoparticles upon the tip and resulted in signal to noise ratios of the order of 120![[thin space (1/6-em)]](https://www.rsc.org/images/entities/char_2009.gif) :
:![[thin space (1/6-em)]](https://www.rsc.org/images/entities/char_2009.gif) 1 and lateral resolutions of ∼0.6 nm. Clearly the approach in its present form is only suitable for imaging gold nanoparticles but it does indicate future avenues of research that might lead to improved PiFM imaging resolution and signal strength.
1 and lateral resolutions of ∼0.6 nm. Clearly the approach in its present form is only suitable for imaging gold nanoparticles but it does indicate future avenues of research that might lead to improved PiFM imaging resolution and signal strength.
6.3 Photoinduced magnetic force microscopy (PiMFM)
There is great interest in materials that interact with the magnetic field of light rather than its electric field because manipulation of magnetic transitions in nanostructures at optical frequencies would provide significant increases in memory capacity and read/write speeds.89 However, the lack of symmetry between electric and magnetic effects in nature results in magnetism in materials at optical frequencies being inherently very weak compared to electric response.90 Furthermore, there is a major challenge in measuring such phenomena when the electric field response usually swamps the magnetic one. Azimuthally polarized laser beams provide an opportunity to sidestep this limitation with an electric field polarization that is null on the beam axis where the longitudinal magnetic field peaks.91 Zeng et al.92,93 have shown that a typical photo induced force microscope can be modified to measure the magnetic dipole under these conditions. Force maps of a sharply focused azimuthally polarized beam (APB) aimed through a glass slip at a gold coated AFM tip were recorded showing a typical doughnut-shaped morphology. The electromagnetic field components were modelled as a function of distance from the APB axis to demonstrate that the magnetic contributions predominate in the beam. A truncated Si cone was examined for this experiment as a potential nanoprobe due to its azimuth morphology.89 Experimentally the PiFM configuration was modified with the truncated cone placed on top of the glass slip acting as a mie resonator. With this arrangement, the force map of the APB taken upon the Si cone reduced the contribution of the electric field component resulting in an area of exclusive magnetic response; the authors christened the new arrangement Photoinduced Magnetic Force Microscopy (PiMFM).Fig. 20. shows the importance of the azimuthal symmetry of the probe where (d) & (h) show that the typical sharp probe obtained no photoinduced force contrast. The symmetry of the force maps taken with tips (a) and (b) match well with those predicted for the APB magnetic field. In the case of probe (c), a doughnut-shaped force map is obtained, this is typical of an electric dipole–dipole map and does not measure a significant magnetic component. Using the truncated probe, a high signal to noise ratio of approximately 15 could be obtained. It is worth noting that the resolution of these images is low and is likely equal to the size of the nanoprobe apex at 200 nm but the system could be improved through the design of smaller probes and using rare-earth metals which could have exclusive magnetic responses to any optical beam rather than ABP. Zeng and Kamandi et al. note the potential of this PiFM configuration for the measurement of chiral force or PiCFM. Theoretically, if a chiral sample and the nanoprobe were illuminated with chiral light the photoinduced force would be different depending on the chirality of the light.95 This principle has been shown to have credibility through the modelling of a chiral sphere in the presence of chiral light.
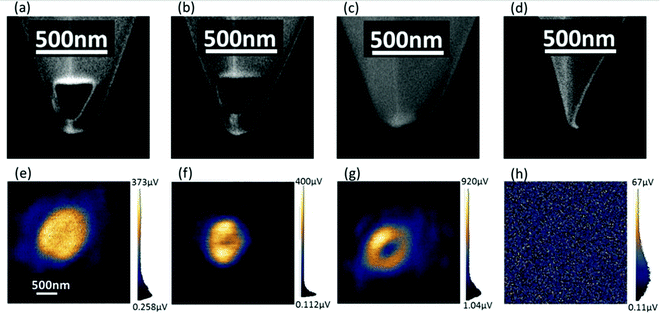 | ||
| Fig. 20 (a)–(d) Focused ion beam images of the “on-state” Si truncated cone probe, “off-state” Si truncated cone probe, blunt Si probe, and sharp Si probe, respectively; (e)–(h) Corresponding measured force maps upon APB illumination from the bottom of the glass slip using the on-state Si truncated cone probe, off-state Si truncated cone probe, blunt Si probe, and sharp Si probe, respectively. The on-state probe (a) is measuring the solid-centre circular spot (e) typical of the APB magnetic field. (Reproduced from Zeng et al.94). | ||
7. In situ and real-time measurements
NSOM96 has been developed to take accurate measurements in the aqueous environment but requires complex setup and is strongly affected by the extent of signal absorption by the water.97 AFM-IR and PiFM are simple alternatives to NSOM, but cantilever oscillations are mechanically damped in water leading to a significant degradation of measurements.97 One approach proposed to overcome the weaker signals in solution is to enhance the local electric field using metal nanoantennas in the substrate.98 In 2021, Li et al.99 exploited this approach to obtain aqueous measurements with PiFM using a standard vista scope instrument with the assistance of gold nanoantennas supported upon ZnSe wafers. Initial experiments used the PIF signal arising from specific vibrational frequencies of a 1–2 nm thick polydimethylsiloxane (PDMS) coating on the AFM tip to, qualitatively, map the electric field distribution around the antenna, demonstrating a lateral resolution of less than 10 nm even in the aqueous environment, Fig. 21. Having established the effectiveness of the approach, a self-assembled monolayer of bovine haemoglobin was imaged over the nanoantennas; the data suggests that the method has considerable promise for future studies in solution.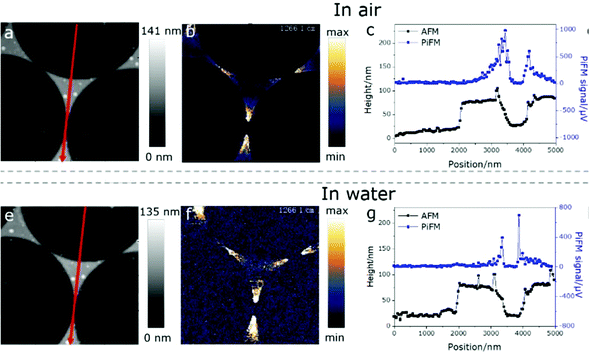 | ||
| Fig. 21 PiFM measurements on an antenna fabricated with a mask of 5 μm PS sphere. (a) and (e): AFM images of the same region recorded in air and water, respectively. Scale bar: 1 μm. (b) and (f): PiF images of the same region of the antennas in (a) and (e) were simultaneously recorded at 1266 cm−1, respectively. (c) and (g): Signals along the red arrows of the topography (black curves) and PiFM images (blue curves). (This figure has been published in CCS Chemistry 2021; “Antenna Enhanced Infrared Photoinduced Force Imaging in Aqueous Environment with Super-Resolution and Hypersensitivity” is available online at https://doi.org/10.31635/ccschem.021.20210134199). | ||
Connor et al.100 used the fast signal response of PiFM to make real-time measurements of the reversible electrochemical oxidation of poly[2,5-bis(thiophenyl)-1,4-bis(2-(2-(2-methoxyethoxy)ethoxy)-ethoxy)benzene] (PB2T–TEG) polymers in vacuum. The paper shows that the polymer can switch between two different crystalline phases depending on the oxidation environment and that these phases can impact the ion-polar pair transport characteristics of the material.
Wide-angle X-ray spectroscopy (WAXS) shows that there is a change in the lattice spacing of the polymer when exposed to voltages between 0.2–0.5 V, corresponding to a change between the oxidised and neutral forms. The proposed mechanism is that under the applied bias, the gylcolated side chains lose their crystallinity which allows the backbone of the polymer to untwist leading to the nucleation of dopant ions in the lattice. No clear change in the topography of the material is detected using AFM, but by following the 843 cm−1 P–F vibration of PF6−, the movement of the ion front can be monitored in real time using PiFM. Using a scan rate of 1 line per second over the same field of view, the movement of the interface between the two forms of the polymer was recorded in a series of movies. Fig. 22 shows the ion front moving across the 3 × 3 μm field of view over a period of 240 minutes. An important observation is that the ion front maintains a sharp edge during the motion of the ions demonstrating non-Fickian transport.
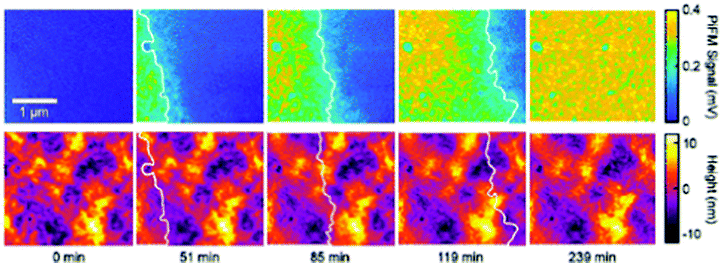 | ||
| Fig. 22 Ion front movement in PB2T–TEG and P3MEEMT. (A) Example image of the samples used for ion front imaging. The grey area is oxidized in 100 mM KCl at +0.7 V (vs. Ag/AgCl) and the red area is neutral. (B) Optical transmission images of the interface between oxidized and neutral regions of the film for PB2T–TEG and P3MEEMT. The transmission images are acquired in the same spectral region as the polaron absorption (750 ± 25 nm). (C) Time series of spatially correlated PiFM and topography images as the interface migrates in PB2T–TEG. The white line designates the 50% intensity threshold from the PiFM channel. (Reprinted with permission from Bischak et al., “A Reversible Structural Phase Transition by Electrochemically-Driven Ion Injection into a Conjugated Polymer”, J. Am. Chem. Soc., 2020, 142, 7434–7442 Copyright 2020 American Chemical Society100). | ||
Delen et al.101 have also used PiFM in real time, studying the absorption of deuterated water on a bifunctional surface layer composed of the hydrophilic HKUST-1 surface-anchored metal–organic framework (SURMOF) described in Section 2.1, and a hydrophobic, zeolitic–imidazolate Frameworks (ZIF-8). Nanometre-sized hydrophilic and hydrophobic domains were identified in the mixed layer and the hydrophilic HKUST-1 material shown to absorb D2O on existing defective sites, as well as generating free deuterated carboxylic acid confirming proposed mechanisms of the hydrolysis of HKUST-1 paddlewheels.
7.1 Tandem measurements
Tip based surface spectroscopy techniques have different strengths and weaknesses, that effects the combination of multiple techniques Is an area of much research. PIFM has been combined with two other systems in recent years, TERS,102 SNOM103 and Kelvin probe force microscopy (KPFM).104Meyer et al.102 integrated a typical TERS system with a PiFM to image 2D MoS2 monolayer flakes. Signal optimisation is a crucial aspect of any TERS experiment but since PiFM can map the electromagnetic field of various materials and light, it can be used in tandem with the TERS to assist in the focusing and alignment of the laser. The PiFM was able to agree with computational calculations of the field distribution of light in three separate cases: Overfocused focused and under focused. These each resulted in a distinct electromagnetic field distribution. When measuring the A1g mode of the samples in each condition. When the laser was over-focused, the TERS signal showed a slight lobe structure as the intensity of the A1g follows the Ez field distribution. In under-focused conditions, no clear signal was obtained as the Exy field and did not affect the A1g out of phase mode. Lastly, a well-focused beam showed that the A1g follows the predicted double lobe model.
Otto et al.105 obtained simultaneous measurements of Magnetic Force Microscopy (MFM), PIFM and SNOM of heat-assisted magnetic recording (HAMR) heads which have applications in new types of hard disk drives. Characterisation of the HAMR materials by MFM, PiFM and SNOM allows a full characterisation of the magnetic and plasmonic properties of these materials and a direct comparison between PiFM and SNOM as shown in Fig. 23. Both PiFM and SNOM identify the nanoantenna of the HAMR head, with the maxima of the two techniques overlapping. Measurements were taken at the same time using the same tip, however there are some differences between the two measurements. Most notably the PiFM images have a higher resolution than those taken by SNOM, a comparison between the two can be seen in Fig. 23e where the inner ring represents the reading taken by PiFM. The authors suggest that this is likely to be an effect of a less efficient coupling of the SNOM signal due to a long working distance.
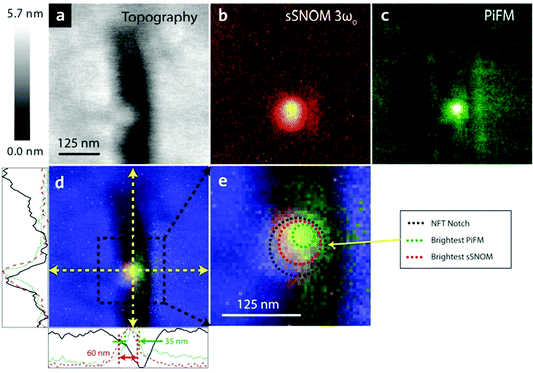 | ||
| Fig. 23 AFM, sSNOM, and PiFM of a HAMR head. Simultaneous topography (a), sSNOM (b), and PiFM (c) of the NFT region. The sSNOM image is generated by demodulation of the 3ω0. The laser diode for the NFT is modulated such that it satisfies the difference between the first and second mechanical modes. Images (d) and (e) give a combined overlay of the three imaging modes to aid in visualization of the areas of maximum intensity for the measured fields. In (d), the cross-sectional lines of the topography (black line), sSNOM (red dashed), and PiFM (green dotted) show the relative sizes of the NFT notch and its measured fields. In (e), the dashed concentric circles represent the size and location of the topography (outermost), sSNOM field (middle), and PiFM field (innermost). The 125 nm scale bar in (a) applies to (b)–(d) as well. The sSNOM and PiFM colour bars are linearly scaled and of arbitrary units (reproduced with permission from Otto et al.105). | ||
Jakob et al.104 designed a system that can obtain KPFM and PiFM simultaneously as an alternative to the more complex PFIR-KPFM systems. In the study, the system was used to characterise a perovskite thin film formed from formamidinium (FA), methylammonium (MA) and Cs (Cs0.05(FA0.93MA0.07)0.95PbI3). KPFM was used to image the surface potential of the sample at 200 kHz while PiFM was used to monitor the C–N asymmetric stretch and NH3+ symmetric stretch of FA and MA respectively. Using this technique, FA rich and deficient areas could be located on the surface of the film. MA was shown to be homogenously mixed throughout the film, there are some deficient areas present in both the MA and FA signals which could be formed by the absorption of Cs+ ions. The surface potential and FA maps appeared to have a similar distribution across the surface. When the two maps were plotted across an FA rich cluster a correlation between the two signals was found. Using the number of pixels corresponding to Cs, FA and MA, the composition of the surface of the film was calculated, with 64% and 33% of pixels corresponding to FA rich and FA deficient areas respectively. This is very different to the bulk measurement of 95% FA.
8. Summary
Since its first incarnation as a means of measuring molecular resonances at surfaces with AFM just over a decade ago,26 PiFM has developed rapidly, with applications now spanning many different areas of interface science. Experiments have shown the technique to be reliable and highly informative, adding a new dimension to the topographic information previously available. A reliable lateral resolution of the order of 5–10 nm has been demonstrated in a variety of different experimental systems and there are realistic expectations of that being improved with careful experimental design and choice of AFM probe. The frequency range studied to date stretches across the electromagnetic spectrum from mid infrared to the visible region, encompassing not only plasmonic oscillations but also the very interesting molecular vibrational frequencies that have been a source of chemical information for 70 years or more. Comparison between PiFM and far field FTIR shows an excellent match in peak intensities and positions allowing direct reference to the rich library of FTIR spectra in the literature, but PiFM also shows much improved spectral resolution offering the prospect of mapping of very closely related domains at surfaces with far more precision than has been possible previously and will allow much more rigorous testing of theoretical models of the surface adsorption. The theoretical understanding of PiFM has also developed, to put modelling of the phenomenon on a firm foundation capable of underpinning predictive calculations that will inspire future developments. Real time measurements with PiFM have also started to appear; so far these have reported phenomena that can be monitored on a timescale of minutes using full AFM images but since signal detection in the PiFM is of the order of 10 milliseconds,106 there is the potential for much more progress in this area. Closely related to that point and an aspect that has not received a great deal of attention so far, is the question of the quantitative measurement of surface species with PiFM. This is an area that needs careful investigation in the near future and is likely to offer new challenges to the experimentalist and theoretician alike. Development of the technique to tackle more demanding environments particularly in situ experiments in aqueous environments is inevitably on the wish list of interface scientists and recent results have shown this is possible but before such difficult experiments are fully developed we can expect a great deal more work in gas phase environments to be undertaken. Thermal effects have also not yet been explored in any great detail and we can confidently predict there will be much to discover in the surface chemistry of systems as the temperature is changed.In conclusion, PiFM has made great strides in just over a decade but there is much more to be done and many more opportunities to exploit.
Conflicts of interest
There are no conflicts to declare.References
- J. B. Taylor and I. Langmuir, The Evaporation of Atoms, Ions and Electrons from Caesium Films on Tungsten, Phys. Rev., 1933, 44, 423 CrossRef CAS.
- M. W. Roberts and C. S. McKee, Chemistry of the metal-gas interface, 1978, p. 594 Search PubMed.
- C. Davisson and L. H. Germer, Diffraction of Electrons by a Crystal of Nickel, Phys. Rev., 1927, 30, 705 CrossRef CAS.
- J. M. Morabito and G. A. Somorjai, Low energy electron diffraction: The technique and its application to metallurgical science, J. Met., 2017, 20(5), 17–24 Search PubMed.
- L. A. Harris, Analysis of Materials by Electron-Excited Auger Electrons, J. Appl. Phys., 2003, 39, 1419 CrossRef.
- D. D. Eley, H. Pines and P. B. Weisz, Adv. Catal., 1982, 31, 351 Search PubMed.
- D. A. King, Thermal desorption from metal surfaces: A review, Surf. Sci., 1975, 47, 384–402 CrossRef CAS.
- A. Fahlman, K. Hamrin, J. Hedman, R. Nordberg, C. Nordling and K. Siegbahn, Electron Spectroscopy and Chemical Binding, Nature, 1966, 210(5031), 4–8 CrossRef CAS.
- C. R. Brundle and M. W. Roberts, Some observations on the surface sensitivity of photoelectron spectroscopy, Proc. R. Soc. London, Ser. A, 1972, 331, 383–394 CAS.
- G. Binnig and H. Rohrer, Scanning tunneling microscopy—from birth to adolescence, Rev. Mod. Phys., 1987, 59, 615 CrossRef CAS.
- A. F. Carley, P. R. Davies and M. W. Roberts, An STM–XPS study of ammonia oxidation: the molecular architecture of chemisorbed imide ‘strings’ at Cu(110) surfaces, Chem. Commun., 1998, 1793–1794 RSC.
- A. F. Carley, P. R. Davies, R. v. Jones, G. U. Kulkarni and M. W. Roberts, Flexibility of the Cu(110)–O structure in the presence of pyridine, Chem. Commun., 1999, 687–688 RSC.
- P. R. Davies and G. G. Mariotti, Oxidation of methanol at Cu(110) surfaces: New TPD studies, J. Phys. Chem., 1996, 100, 19975–19980 CrossRef CAS.
- B. C. Stipe, M. A. Rezaei and W. Ho, Single-molecule vibrational spectroscopy and microscopy, Science, 1998, 280, 1732–1735 CrossRef CAS.
- M. Fleischmann, P. J. Hendra and A. J. McQuillan, Raman spectra of pyridine adsorbed at a silver electrode, Chem. Phys. Lett., 1974, 26, 163–166 CrossRef CAS.
- I. Pockrand, Surface enhanced raman scattering (SERS) from silver, copper, and gold films in UHV: excitation spectra, J. Electron Spectrosc. Relat. Phenom., 1983, 29, 357–362 CrossRef CAS.
- S. Guan, G. A. Attard and A. J. Wain, Observation of Substituent Effects in the Electrochemical Adsorption and Hydrogenation of Alkynes on Pt{hkl} Using SHINERS, ACS Catal., 2020, 10, 10999–11010 CrossRef CAS.
- X. Wang, S. C. Huang, S. Hu, S. Yan and B. Ren, Fundamental understanding and applications of plasmon-enhanced Raman spectroscopy, Nat. Rev. Phys., 2020, 2(5), 253–271 CrossRef.
- J. H. Kim and K. B. Song, Recent progress of nano-technology with NSOM, Micron, 2007, 38, 409–426 CrossRef CAS PubMed.
- K. Venkatraman, B. D. A. Levin, K. March, P. Rez and P. A. Crozier, Vibrational spectroscopy at atomic resolution with electron impact scattering, Nat. Phys., 2019, 15(12), 1237–1241 Search PubMed.
- F. S. Hage, R. J. Nicholls, J. R. Yates, D. G. McCulloch, T. C. Lovejoy, N. Dellby, O. L. Krivanek, K. Refson and Q. M. Ramasse, Nanoscale momentum-resolved vibrational spectroscopy, Sci. Adv., 2018, 4, eaar7495 Search PubMed.
- A. Dazzi, F. Glotin, J. M. Ortega and R. Prazeres, Local infrared microspectroscopy with subwavelength spatial resolution with an atomic force microscope tip used as a photothermal sensor, Opt. Lett., 2005, 30, 2388–2390 CrossRef CAS.
- F. Lu and M. A. Belkin, Infrared absorption nano-spectroscopy using sample photoexpansion induced by tunable quantum cascade lasers, Opt. Express, 2011, 19, 19942–19947 CrossRef CAS PubMed.
- A. Dazzi, C. B. Prater, Q. Hu, D. B. Chase, J. F. Rabolt and C. Marcott, AFM–IR: Combining Atomic Force Microscopy and Infrared Spectroscopy for Nanoscale Chemical Characterization, Appl. Spectrosc., 2012, 66, 1365–1384 CrossRef CAS PubMed.
- J. Jahng, D. A. Fishman, S. Park, D. B. Nowak, W. A. Morrison, H. K. Wickramasinghe and E. O. Potma, Linear and Nonlinear Optical Spectroscopy at the Nanoscale with Photoinduced Force Microscopy, Acc. Chem. Res., 2015, 48, 2671–2679 CrossRef CAS.
- I. Rajapaksa, K. Uenal and H. K. Wickramasinghe, Image force microscopy of molecular resonance: A microscope principle, Appl. Phys. Lett., 2010, 97, 073121 CrossRef.
- K. Dholakia and P. Zemánek, Colloquium: Gripped by light: Optical binding, Rev. Mod. Phys., 2010, 82, 1767–1791 CrossRef.
- J. R. Arias-González and M. Nieto-Vesperinas, Optical forces on small particles: attractive and repulsive nature and plasmon-resonance conditions, J. Opt. Soc. Am. A, 2003, 20, 1201–1209 CrossRef.
- J. Jahng, J. Brocious, D. A. Fishman, F. Huang, X. Li, V. A. Tamma, H. K. Wickramasinghe and E. O. Potma, Gradient and scattering forces in photoinduced force microscopy, Phys. Rev. B: Condens. Matter Mater. Phys., 2014, 90, 155417 CrossRef.
- J. Jahng, D. A. Fishman, S. Park, D. B. Nowak, W. A. Morrison, H. K. Wickramasinghe and E. O. Potma, Linear and Nonlinear Optical Spectroscopy at the Nanoscale with Photoinduced Force Microscopy, Acc. Chem. Res., 2015, 48, 2671–2679 CrossRef CAS PubMed.
- J. Jahng, H. Kwon and E. S. Lee, Photo-Induced Force Microscopy by Using Quartz Tuning-Fork Sensor, Sensors, 2019, 19, 1530 CrossRef CAS.
- M. A. Almajhadi, S. M. A. Uddin and H. K. Wickramasinghe, Observation of nanoscale opto-mechanical molecular damping as the origin of spectroscopic contrast in photo induced force microscopy, Nat. Commun., 2020, 11, 5691 CrossRef CAS.
- J. Jahng, E. O. Potma and E. S. Lee, Tip-Enhanced Thermal Expansion Force for Nanoscale Chemical Imaging and Spectroscopy in Photoinduced Force Microscopy, Anal. Chem., 2018, 90, 11054–11061 CrossRef CAS PubMed.
- B. Kim, J. Jahng, A. Sifat, E. S. Lee and E. O. Potma, Monitoring Fast Thermal Dynamics at the Nanoscale through Frequency Domain Photoinduced Force Microscopy, J. Phys. Chem. C, 2021, 125, 7276–7286 CrossRef CAS.
- G. E. Sommargren, Optical heterodyne profilometry, Appl. Opt., 1981, 20(4), 610–618 CrossRef CAS PubMed.
- M. Cuberes, H. E. Assender, G. A. D. Briggs and O. v. Kolosov, Heterodyne force microscopy of PMMA/rubber nanocomposites: nanomapping of viscoelastic response at ultrasonic frequencies, J. Phys. D: Appl. Phys., 2000, 33, 2347 CrossRef CAS.
- W. Zhao, S. Li, H. Yao, S. Zhang, Y. Zhang, B. Yang and J. Hou, Molecular Optimization Enables over 13% Efficiency in Organic Solar Cells, J. Am. Chem. Soc., 2017, 139, 7148–7151 CrossRef CAS PubMed.
- Z. Chen, X. Chen, B. Qiu, G. Zhou, Z. Jia, W. Tao, Y. Li, Y. M. Yang and H. Zhu, Ultrafast Hole Transfer and Carrier Transport Controlled by Nanoscale-Phase Morphology in Nonfullerene Organic Solar Cells, J. Phys. Chem. Lett., 2020, 11, 3226–3233 CrossRef CAS.
- L. D. B. Mandemaker, M. Filez, G. Delen, H. Tan, X. Zhang, D. Lohse and B. M. Weckhuysen, Time-Resolved In Situ Liquid-Phase Atomic Force Microscopy and Infrared Nanospectroscopy during the Formation of Metal–Organic Framework Thin Films, J. Phys. Chem. Lett., 2018, 9, 1838–1844 CrossRef CAS PubMed.
- L. D. B. Mandemaker, M. Rivera-Torrente, G. Delen, J. P. Hofmann, M. Lorenz, A. Belianinov and B. M. Weckhuysen, Nanoweb Surface-Mounted Metal–Organic Framework Films with Tunable Amounts of Acid Sites as Tailored Catalysts, Chem. – Eur. J., 2020, 26, 691–698 CrossRef CAS PubMed.
- G. Delen, Z. Ristanović, L. D. B. Mandemaker and B. M. Weckhuysen, Mechanistic Insights into Growth of Surface-Mounted Metal-Organic Framework Films Resolved by Infrared (Nano-) Spectroscopy, Chem. – Eur. J., 2018, 24, 187–195 CrossRef CAS PubMed.
- D. Fu, K. Park, G. Delen, Ö. Attila, F. Meirer, D. Nowak, S. Park, J. E. Schmidt and B. M. Weckhuysen, Nanoscale infrared imaging of zeolites using photoinduced force microscopy, Chem. Commun., 2017, 53, 13012–13014 RSC.
- Q. Chen, S. van der Slot, S. Kreisig, M. Tian, R. Peters and J. Loos, Revealing nanoscale chemical heterogeneity at the surface of water-based coatings prepared from urethane–acrylic hybrids by photo-induced force microscopy, J. Coat. Technol. Res., 2019, 16(6), 1553–1558 CrossRef CAS.
- I. C. ten Have, A. J. A. Duijndam, R. Oord, H. J. M. van, B. den Broek, I. Vollmer, B. M. Weckhuysen and F. Meirer, Photoinduced Force Microscopy as an Efficient Method Towards the Detection of Nanoplastics, Chemistry – Methods, 2021, 1, 205–209 CrossRef.
- G. B. B. M. Sutherland, Application of Infrared Spectroscopy to Biological Problems, Rev. Mod. Phys., 1959, 31, 118 CrossRef CAS.
- H. H. Mantsch, D. G. Cameron, J. Umemura and H. L. Casal, Fourier transform infrared spectroscopy of aqueous systems: applications to the study of biological membranes, J. Mol. Struct., 1980, 60, 263–268 CrossRef CAS.
- H. Ping, L. Poudel, H. Xie, W. Fang, Z. Zou, P. Zhai, W. Wagermaier, P. Fratzl, W. Wang, H. Wang, P. O’Reilly, W.-Y. Ching and Z. Fu, Synthesis of monodisperse rod-shaped silica particles through biotemplating of surface-functionalized bacteria, Nanoscale, 2020, 12, 8732–8741 RSC.
- A. S. Cristie-David, J. Chen, D. B. Nowak, A. L. Bondy, K. Sun, S. I. Park, M. M. B. Holl, M. Su and E. N. G. Marsh, Coiled-Coil-Mediated Assembly of an Icosahedral Protein Cage with Extremely High Thermal and Chemical Stability, J. Am. Chem. Soc., 2019, 141, 9207–9216 CrossRef PubMed.
- C. Rosu, S. Jacobeen, K. Park, E. Reichmanis, P. Yunker and P. S. Russo, Domed Silica Microcylinders Coated with Oleophilic Polypeptides and Their Behavior in Lyotropic Cholesteric Liquid Crystals of the Same Polypeptide, Langmuir, 2016, 32, 13137–13148 CrossRef CAS.
- B. Ji, A. Kenaan, S. Gao, J. Cheng, D. Cui, H. Yang, J. Wang and J. Song, Label-free detection of biotoxins via a photo-induced force infrared spectrum at the single-molecular level, Analyst, 2019, 144, 6108–6117 RSC.
- J. C. Abrego-Martinez, M. Jafari, S. Chergui, C. Pavel, D. Che and M. Siaj, Aptamer-based electrochemical biosensor for rapid detection of SARS-CoV-2: Nanoscale electrode-aptamer-SARS-CoV-2 imaging by photo-induced force microscopy, Biosens. Bioelectron., 2022, 195, 113595 CrossRef CAS PubMed.
- N. Zhu, D. Zhang, W. Wang, X. Li, B. Yang, J. Song, X. Zhao, B. Huang, W. Shi, R. Lu, P. Niu, F. Zhan, X. Ma, D. Wang, W. Xu, G. Wu, G. F. Gao and W. Tan, A Novel Coronavirus from Patients with Pneumonia in China, 2019, N. Engl. J. Med., 2020, 382, 727–733 CrossRef CAS PubMed.
- B. W. Neuman, B. D. Adair, C. Yoshioka, J. D. Quispe, G. Orca, P. Kuhn, R. A. Milligan, M. Yeager and M. J. Buchmeier, Supramolecular Architecture of Severe Acute Respiratory Syndrome Coronavirus Revealed by Electron Cryomicroscopy, J. Virol., 2006, 80, 7918 CrossRef CAS PubMed.
- D. L. Kitane, S. Loukman, N. Marchoudi, A. Fernandez-Galiana, F. Z. el Ansari, F. Jouali, J. Badir, J.-L. Gala, D. Bertsimas, N. Azami, O. Lakbita, O. Moudam, R. Benhida and J. Fekkak, A simple and fast spectroscopy-based technique for Covid-19 diagnosis, Sci. Rep., 2021, 11(1), 1–11 CrossRef PubMed.
- S. Gamage, M. Howard, H. Makita, B. Cross, G. Hastings, M. Luo and Y. Abate, Probing structural changes in single enveloped virus particles using nano-infrared spectroscopic imaging, PLoS One, 2018, 13, e0199112 CrossRef PubMed.
- K. K. Kesari, P. O’Reilly, J. Seitsonen, J. Ruokolainen and T. Vuorinen, Infrared photo-induced force microscopy unveils nanoscale features of Norway spruce fibre wall, Cellulose, 2021, 28, 7295–7309 CrossRef CAS.
- M. Reza, C. Bertinetto, J. Ruokolainen and T. Vuorinen, Cellulose Elementary Fibrils Assemble into Helical Bundles in S1 Layer of Spruce Tracheid Wall, Biomacromolecules, 2017, 18, 374–378 CrossRef CAS PubMed.
- S.-Y. Ding and M. E. Himmel, The Maize Primary Cell Wall Microfibril: A New Model Derived from Direct Visualization, J. Agric. Food Chem., 2006, 54, 597–606 CrossRef CAS PubMed.
- S.-Y. Ding, S. Zhao and Y. Zeng, Size, shape, and arrangement of native cellulose fibrils in maize cell walls, Cellulose, 2013, 21, 863–871 CrossRef.
- C. Gusenbauer, D. S. Jakob, X. G. Xu, D. v. Vezenov, É. Cabane and J. Konnerth, Nanoscale Chemical Features of the Natural Fibrous Material Wood, Biomacromolecules, 2020, 21, 4244–4252 CrossRef CAS PubMed.
- Y. Zhao, Z. Yao, C. D. Snow, Y. Xu, Y. Wang, D. Xiu, L. A. Belfiore and J. Tang, Stable Fluorescence of Eu3+ Complex Nanostructures Beneath a Protein Skin for Potential Biometric Recognition, Nanomaterials, 2021, 11, 2462 CrossRef CAS PubMed.
- L. M. Otter, M. W. Förster, E. Belousova, P. O’Reilly, D. Nowak, S. Park, S. Clark, S. F. Foley and D. E. Jacob, Nanoscale Chemical Imaging by Photo-Induced Force Microscopy: Technical Aspects and Application to the Geosciences, Geostand. Geoanal. Res., 2021, 45, 5–27 CrossRef CAS.
- S. Patabendigedara, D. Nowak, M. J. B. Nancarrow and S. M. Clark, Determining the water content of nominally anhydrous minerals at the nanometre scale, Rev. Sci. Instrum., 2021, 92, 023103 CrossRef CAS PubMed.
- J. Nan, H. E. King, G. Delen, F. Meirer, B. M. Weckhuysen, Z. Guo, X. Peng and O. Plümper, The nanogeochemistry of abiotic carbonaceous matter in serpentinites from the Yap Trench, western Pacific Ocean, Geology, 2021, 49, 330–334 CrossRef.
- M. J. Werny, J. Zarupski, I. C. ten Have, A. Piovano, C. Hendriksen, N. H. Friederichs, F. Meirer, E. Groppo and B. M. Weckhuysen, Correlating the Morphological Evolution of Individual Catalyst Particles to the Kinetic Behavior of Metallocene-Based Ethylene Polymerization Catalysts, JACS Au, 2021, 1, 1996–2008 CrossRef CAS.
- C. J. Allender, J. L. Bowen, V. Celorrio, J. A. Davies-Jones, P. R. Davies, S. Guan, P. O’Reilly and M. Sankar, The Role of Growth Directors in Controlling the Morphology of Hematite Nanorods, Nanoscale Res. Lett., 2020, 15, 1–12 CrossRef.
- C. Frandsen, B. A. Legg, L. R. Comolli, H. Zhang, B. Gilbert, E. Johnson and J. F. Banfield, Aggregation-induced growth and transformation of β-FeOOH nanorods to micron-sized α-Fe2O3 spindles, CrystEngComm, 2014, 16, 1451–1458 RSC.
- L. Allen, J. A. Davies-Jones, P. R. Davies, S. King and P. O’Reilly, Tuning the structure of cerium phosphate nanorods, CrystEngComm, 2021, 23, 8215–8225 RSC.
- A. v. Zayats, I. I. Smolyaninov and A. A. Maradudin, Nano-optics of surface plasmon polaritons, Phys. Rep., 2005, 408, 131–314 CrossRef CAS.
- Doubling the propagation distance of surface plasmon polaritons, https://spie.org/news/6454-doubling-the-propagation-distance-of-surface-plasmon-polaritons?SSO=1#B4, (accessed October 13, 2021).
- C. Luo, X. Guo, H. Hu, D. Hu, C. Wu, X. Yang and Q. Dai, Probing Polaritons in 2D Materials, Adv. Opt. Mater., 2020, 8, 1901416 CrossRef CAS.
- J. Liu, S. Park, D. Nowak, M. Tian, Y. Wu, H. Long, K. Wang, B. Wang and P. Lu, Near-Field Characterization of Graphene Plasmons by Photo-Induced Force Microscopy, Laser Photonics Rev., 2018, 12, 1800040 CrossRef.
- A. N. Grigorenko, M. Polini and K. S. Novoselov, Graphene plasmonics, Nat. Photonics, 2012, 6, 749–758 CrossRef CAS.
- A. Ambrosio, M. Tamagnone, K. Chaudhary, L. A. Jauregui, P. Kim, W. L. Wilson and F. Capasso, Selective excitation and imaging of ultraslow phonon polaritons in thin hexagonal boron nitride crystals, Light: Sci. Appl., 2018, 7, 1–9 CrossRef CAS PubMed.
- M. Tamagnone, A. Ambrosio, K. Chaudhary, L. A. Jauregui, P. Kim, W. L. Wilson and F. Capasso, Ultra-confined mid-infrared resonant phonon polaritons in van der Waals nanostructures, Sci. Adv., 2018, 4, aat7189 CrossRef PubMed.
- C. Xu, Z. Bo, S. Wu, Z. Wen, J. Chen, T. Luo, E. Lee, G. Xiong, R. Amal, A. T. S. Wee, J. Yan, K. Cen, T. S. Fisher and K. (Ken) Ostrikov, Vertical graphene nano-antennas for solar-to-hydrogen energy conversion, Sol. Energy, 2020, 208, 379–387 CrossRef CAS.
- M. Z. Baykara, Noncontact Atomic Force Microscopy for Atomic-Scale Characterization of Material Surfaces, Surface Science Tools for Nanomaterials Characterization, 2015, pp. 273–316 Search PubMed.
- B. T. O’Callahan, J. Yan, F. Menges, E. A. Muller and M. B. Raschke, Photoinduced Tip–Sample Forces for Chemical Nanoimaging and Spectroscopy, Nano Lett., 2018, 18, 5499–5505 CrossRef PubMed.
- J. Yamanishi, Y. Naitoh, Y. J. Li and Y. Sugawara, Heterodyne technique in photoinduced force microscopy with photothermal effect, Appl. Phys. Lett., 2017, 110, 123102 CrossRef.
- L. Wang, D. S. Jakob, H. Wang, A. Apostolos, M. M. Pires and X. G. Xu, Generalized Heterodyne Configurations for Photoinduced Force Microscopy, Anal. Chem., 2019, 91, 13251–13259 CrossRef CAS PubMed.
- J. Yamanishi, Y. Naitoh, Y. J. Li and Y. Sugawara, Heterodyne Frequency Modulation in Photoinduced Force Microscopy, Phys. Rev. Appl., 2018, 9, 024031 CrossRef CAS.
- L. Wang, D. S. Jakob, H. Wang, A. Apostolos, M. M. Pires and X. G. Xu, Generalized Heterodyne Configurations for Photoinduced Force Microscopy, Anal. Chem., 2019, 91, 13251–13259 CrossRef CAS PubMed.
- J. Yamanishi, H. Yamane, Y. Naitoh, Y. J. Li, N. Yokoshi, T. Kameyama, S. Koyama, T. Torimoto, H. Ishihara and Y. Sugawara, Optical force mapping at the single-nanometre scale, Nat. Commun., 2021, 12, 1–7 CrossRef PubMed.
- H. Ishihara, H. Yamane, J. Yamanishi, N. Yokoshi, Y. Sugawara, H. Ishihara and H. Ishihara, Theoretical analysis of optically selective imaging in photoinduced force microscopy, Opt. Express, 2020, 28, 34787–34803 CrossRef PubMed.
- H. Yamane, N. Yokoshi and H. Ishihara, High-Resolution Measurement of Molecular Internal Polarization Structure by Photoinduced Force Microscopy, Appl. Sci., 2021, 11, 6937 CrossRef CAS.
- F. Huang, V. Ananth Tamma, Z. Mardy, J. Burdett and H. Kumar Wickramasinghe, Imaging Nanoscale Electromagnetic Near-Field Distributions Using Optical Forces, Sci. Rep., 2015, 5, 10610 CrossRef PubMed.
- J. Zeng, F. Huang, C. Guclu, M. Veysi, M. Albooyeh, H. K. Wickramasinghe and F. Capolino, Sharply Focused Azimuthally Polarized Beams with Magnetic Dominance: Near-Field Characterization at Nanoscale by Photoinduced Force Microscopy, ACS Photonics, 2017, 5, 390–397 CrossRef.
- H. K. Wickramasinghe, J. Zeng, M. A. Almajhadi and M. Rajaei, Near-field nanoprobing using Si tip-Au nanoparticle photoinduced force microscopy with 120:1 signal-to-noise ratio, sub-6-nm resolution, Opt. Express, 2018, 26(20), 26365–26376 CrossRef PubMed.
- J. Zeng, M. Darvishzadeh-Varcheie, M. Albooyeh, M. Rajaei, M. Kamandi, M. Veysi, E. O. Potma, F. Capolino and H. K. Wickramasinghe, Exclusive Magnetic Excitation Enabled by Structured Light Illumination in a Nanoscale Mie Resonator, ACS Nano, 2018, 12, 12159–12168 CrossRef CAS PubMed.
- F. Monticone and A. Alù, The quest for optical magnetism: from split-ring resonators to plasmonic nanoparticles and nanoclusters, J. Mater. Chem. C, 2014, 2, 9059–9072 RSC.
- Q. Zhan, Cylindrical vector beams: from mathematical concepts to applications, Adv. Opt. Photonics, 2009, 1(1), 1–57 CrossRef CAS.
- J. Zeng, M. Darvishzadeh-Varcheie, M. Albooyeh, M. Rajaei, M. Kamandi, M. Veysi, E. O. Potma, F. Capolino and H. K. Wickramasinghe, Exclusive Magnetic Excitation Enabled by Structured Light Illumination in a Nanoscale Mie Resonator, ACS Nano, 2018, 12, 12159–12168 CrossRef CAS PubMed.
- J. Zeng, F. Huang, C. Guclu, M. Veysi, M. Albooyeh, H. K. Wickramasinghe and F. Capolino, Sharply Focused Azimuthally Polarized Beams with Magnetic Dominance: Near-Field Characterization at Nanoscale by Photoinduced Force Microscopy, ACS Photonics, 2017, 5, 390–397 CrossRef.
- J. Zeng, M. Albooyeh, M. Rajaei, A. A. Sifat, E. O. Potma, H. K. Wickramasinghe and F. Capolino, Photoinduced Magnetic Force Microscopy: Enabling Direct and Exclusive Detection of Optical Magnetism.
- J. Zeng, M. Kamandi, M. Darvishzadeh-Varcheie, M. Albooyeh, M. Veysi, C. Guclu, M. Hanifeh, M. Rajaei, E. O. Potma, H. K. Wickramasinghe and F. Capolino, In pursuit of photo-induced magnetic and chiral microscopy, EPJ Appl. Metamater., 2018, 5, 7 CrossRef.
- D. Virmani, A. Bylinkin, I. Dolado, E. Janzen, J. H. Edgar and R. Hillenbrand, Amplitude-and Phase-Resolved Infrared Nanoimaging and Nanospectroscopy of Polaritons in a Liquid Environment, Nano Lett., 2021, 21, 1360 CrossRef CAS PubMed.
- M. Jin, F. Lu and M. A. Belkin, High-sensitivity infrared vibrational nanospectroscopy in water, Light: Sci. Appl., 2017, 6(7), e17096–e17096 CrossRef CAS PubMed.
- T. Taubner, T. W. W. Maß, U. Schnakenberg and V. H. Nguyen, Tailoring grating strip widths for optimizing infrared absorption signals of an adsorbed molecular monolayer, Opt. Express, 2019, 27, 10524–10532 CrossRef PubMed.
- J. Li, J. Pang, Z. Yan, J. Jahng, J. Li, W. Morrison, J. Liang, Q.-Y. Zhang and X.-H. Xia, Antenna Enhanced Infrared Photoinduced Force Imaging in Aqueous Environment with Super-Resolution and Hypersensitivity, CCS Chem., 2021, 2717–2726 CrossRef.
- C. G. Bischak, L. Q. Flagg, K. Yan, T. Rehman, D. W. Davies, R. J. Quezada, J. W. Onorato, C. K. Luscombe, Y. Diao, C.-Z. Li and D. S. Ginger, A Reversible Structural Phase Transition by Electrochemically-Driven Ion Injection into a Conjugated Polymer, J. Am. Chem. Soc., 2020, 142, 7434–7442 CrossRef CAS PubMed.
- G. Delen, M. Monai, F. Meirer and B. M. Weckhuysen, In situ Nanoscale Infrared Spectroscopy of Water Adsorption on Nanoislands of Surface-Anchored Metal-Organic Frameworks, Angew. Chem., Int. Ed., 2021, 60, 1620–1624 CrossRef CAS PubMed.
- R. Meyer, S. Trautmann, K. Rezaei, A. George, A. Turchanin and V. Deckert, Synergy of Photoinduced Force Microscopy and Tip-Enhanced Raman Spectroscopy—A Correlative Study on MoS2, ACS Photonics, 2019, 6, 1191–1198 CrossRef CAS.
- L. M. Otto, D. Nowak, W. Morrison, S. Park, B. C. Stipe and A. T. Hammack, Simultaneous multimethod scanning probe microscopy of complex nano-systems, J. Appl. Phys., 2021, 130, 024506 CrossRef CAS.
- D. S. Jakob, N. Li, H. Zhou and X. G. Xu, Integrated Tapping Mode Kelvin Probe Force Microscopy with Photoinduced Force Microscopy for Correlative Chemical and Surface Potential Mapping, Small, 2021, 17, 2102495 CrossRef CAS PubMed.
- L. M. Otto, D. Nowak, W. Morrison, S. Park, B. C. Stipe and A. T. Hammack, Simultaneous multimethod scanning probe microscopy of complex nano-systems, J. Appl. Phys., 2021, 130, 024506 CrossRef CAS.
- J. Jahng, J. Brocious, D. A. Fishman, S. Yampolsky, D. Nowak, F. Huang, V. A. Apkarian, H. K. Wickramasinghe and E. O. Potma, Ultrafast pump-probe force microscopy with nanoscale resolution, Appl. Phys. Lett., 2015, 106, 083113 CrossRef.
| This journal is © the Partner Organisations 2022 |

