 Open Access Article
Creative Commons Attribution 3.0 Unported Licence
An integrated magneto-opto-fluidic biosensor for rapid on-chip assay of respiratory viruses of livestock
Qinming
Zhang
a,
Gaurav
Rawal
b,
Jingjing
Qian
a,
Hussam
Ibrahim
a,
Jianqiang
Zhang
 *b,
Liang
Dong
 *ac and
Meng
Lu
 *acd
*acd
aDepartment of Electrical and Computer Engineering, Iowa State University, Ames, Iowa 50011, USA. E-mail: ldong@iastate.edu; menglu@iastate.edu
bDepartment of Veterinary Diagnostic & Production Animal Medicine, Iowa State University, Ames, Iowa 50011, USA
cMicroelectronics Research Centre, Iowa State University, Ames, Iowa 50011, USA
dDepartment of Mechanical Engineering, Iowa State University, Ames, Iowa 50011, USA
First published on 25th July 2022
Abstract
Respiratory disease is one of the most important causes of economic loss in swine production. In the USA, porcine reproductive and respiratory syndrome virus (PRRSV) and influenza A virus (IAV) are currently the top two primary viruses causing swine respiratory diseases. The commonly used PCR-based virus detection methods require virus extraction, nucleic acid purification, and detection, which are relatively time-consuming and expensive. This work reports an integrated magneto-opto-fluidic (iMOF) platform, in which antibody functionalized magnetic nanoparticles (MNPs) can enable efficient enrichment of multiple swine respiratory viruses and a photonic crystal (PC) biosensor can transduce the amount of captured MNP–virus nanoparticles to the change of their reflection signatures. Owing to the high refractive index of Fe2O3 MNPs, the use of MNPs can significantly enhance the PC sensor output. The proof-of-concept validation involves using antibody-functionalized MNPs to recognize IAV and PRRSV and transferring the formed MNP–virus conjugates onto the surface of the PC biosensors to quantify these viruses. The iMOF platform offers a high sensitivity of 3.5 TCID50 mL−1 and 5.9 TCID50 mL−1 for detecting IAV and PRRSV, respectively, and a rapid turnaround within one hour, including the MNP–virus conjugation, enrichment, and detection. The on-chip virus platform has a great potential for in-field surveillance of viral infections.
Introduction
Swine respiratory diseases caused by virus infections are considered as one of the primary problems to the porcine production industry worldwide.1 Although primary pathogens involved in the porcine respiratory disease complex vary between countries, regions, and farms, the top two viral agents currently involved with porcine respiratory disease in the USA are porcine reproductive and respiratory syndrome virus (PRRSV) and influenza A virus (IAV).2,3 The spread of IAV and PRRSV has resulted in huge economic losses.4 The diagnosis and monitoring of these infections are often carried out in diagnostic laboratories. The methods commonly used for IAV and PRRSV screens include the reverse transcription-quantitative polymerase chain reaction (RT-qPCR) for detecting viral RNA and enzyme-linked immunosorbent assay (ELISA) for detecting viral antibodies.5,6 However, the ELISA and PCR tests require specific and bulky equipment and expensive reagents to prepare and test samples. These gold standard assays are also time-consuming and laborious.7 In contrast, compact biosensors, such as surface plasmon resonance sensors, photonic crystal (PC) sensors, giant magnetoresistance sensors, electrochemical sensors, field-effect transistor-based biosensors, and piezoelectric biosensors, with pre-coated ligands can capture target viruses via their surface receptors and generate quantitative output signals.8–15 Compared to ELISA and PCR tests, these biosensors have the advantages of a short assay time, small footprint, and ease of use but their specificities are relatively low for the detection of complex samples, such as oral fluid, nasal swabs, and plasma.Although the sensitivity and specificity of virus biosensors have been significantly improved, an upstream purification or enrichment process would always benefit virus detection, particularly when large amounts of interference molecules are present in samples. The most common purification methods are differential centrifugation and filtration, which can enrich viruses but often take several hours.16 Microfluidic chips have also been implemented to purify and enrich viruses using trapping nanostructures or chromatography microcolumns.17 Immunomagnetic extraction of target virus using antibody-coated magnetic microbeads has been realized.18,19 More recently, immunomagnetic virus extractions were demonstrated using microfluidic platforms for in-field applications.20,21 To achieve a fully automated and rapid assay, it is highly desirable to integrate virus extraction, enrichment, and quantification on a single chip.
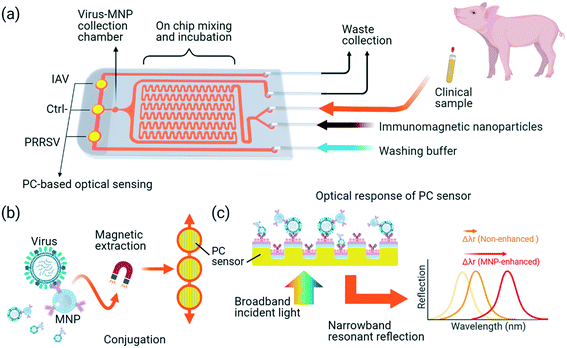
This work reports an integrated magneto-opto-fluidic (iMOF) virus sensor system that integrates magnetic nanoparticle (MNP)-based virus enrichment and a PC-based label free sensor in a single flow cell for rapid analysis of multiple swine respiratory viruses. The antibody-functionalized MNPs can not only specifically recognize and enrich the target viruses but also transfer the MNP–virus conjugates to the surface of PC biosensors. Due to their high reflective index, the MNP labels can significantly boost the output of the PC sensor. In addition, the coating of both MNP and PC surfaces using virus-specific antibodies warranted a high sensing specificity to PRRSVs or IAVs. With the integrated virus extraction and detection, the iMOF platform (Fig. 1) provides a solution to improve the simultaneous detection of IAV and PRRSV in less than one hour.
Results and discussion
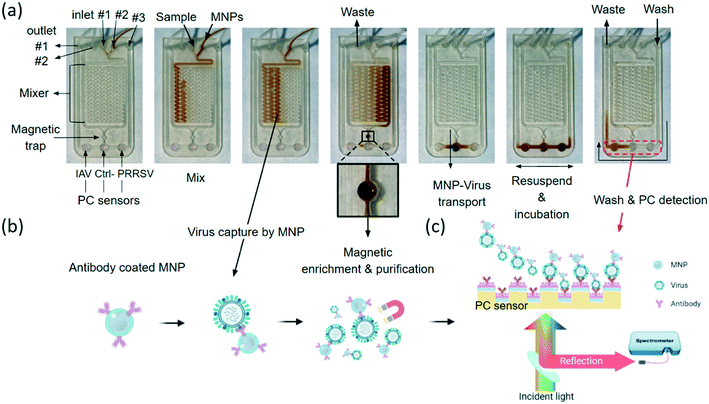
As summarized in Fig. 1, the iMOF virus analysis assay integrates three key functions: immunomagnetic capture of viruses from test samples, virus enrichment, and quantitative detection of target viruses. The iMOF chip includes three inlets, two outlets, a sample mixer, an MNP collection chamber, and three PC sensing chambers (Fig. 1(a)). The MNPs were functionalized using virus-specific antibodies and blocked before being used. The chosen antibodies were specific to the hemagglutinin (HA) protein and glycoproteins on the surface of IAVs and PRRSVs, respectively. When flowing in the sample mixer, the antibody-coated MNPs can bind to the target viruses and the MNP–virus conjugates are trapped in the MNP collection chamber. After being washed, the MNP–virus conjugates are transferred into the PC detection chambers and the reflection spectra from the PCs are recorded, as illustrated in Fig. 1(b).Numerical characterization of MNP-enhanced virus detection
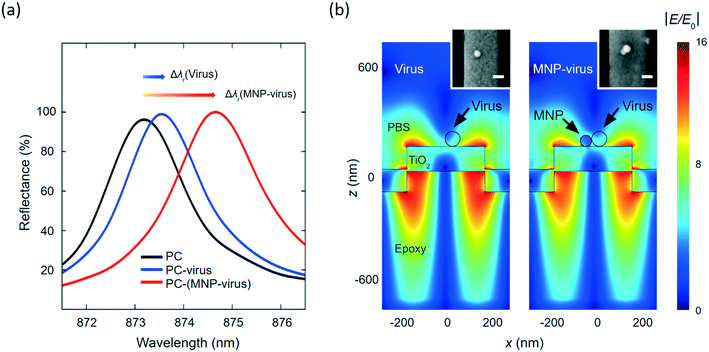
The MNPs offered the functions of enriching viral particles and enhancing PC sensor output. The PC biosensor, consisting of a one-dimensional (1D) nanograting illustrated in Fig. 1(b), can reflect broadband excitation in a relatively narrow wavelength band. Here, the PC's nanograting was fabricated by the replica molding process using an ultraviolet-sensitive polymer.22,23 A high-refractive dielectric film (TiO2) was deposited onto the grating as a waveguide layer to support the narrowband reflection resonance from the PC.23–25 The wavelength of this narrowband reflection depends on the refractive index around the PC sensor surface. The adsorption of viral nanoparticles on the biosensor increases the refractive index on the PC surface and results in a shift in the PC resonance mode, as illustrated in Fig. 1(c). With a refractive index as high as 2.82, Fe2O3 MNPs can shift the resonance further to a longer wavelength. As a result, the conjugation of MNPs to viruses can enhance the PC-based detection of viruses.We used the finite-difference time-domain (FDTD) simulation to evaluate the contribution of the MNPs to the PC sensor output. The details of the FDTD simulation are described in the Methods and materials section. The PC sensor has a period of Λ = 555 nm, and the TiO2 grating has a thickness of 100 nm. In the simulation, the PC sensor was excited using a transverse magnetic (TM) polarized plane wave along the perpendicular direction. The reflectance of a bare PC sensor was calculated and shown as the black curve in Fig. 2(a), where the TM reflection resonance was located at λr = 873.24 nm. The absorption of a virus nanoparticle (diameter = 70 nm; refractive index = 1.5) caused a red shift of the PC's resonance reflection to λr = 873.6 nm. By conjugating the virus with a 50 nm-diameter Fe2O3 MNP, the peak of the PC reflection showed a larger shift to λr = 874.71 nm (red curve in Fig. 2(a)). The PC sensor output, defined as the resonance wavelength shift (Δλ), was increased from 0.36 nm to 1.11 nm, by the presence of the 50 nm-diameter MNP. To further investigate the MNP's contribution, the near field distributions at the resonant wavelength are plotted in Fig. 2(b) for the PC sensor with a virus particle and MNP–virus conjugate, respectively. It can be seen that the evanescent field confined around the PC surface is slighted changed by the virus nanoparticle. Owing to the higher refractive index of the MNP, the evanescent field exhibited a more significant change around the MNP. The scanning electron microscopy (SEM) images in the insets of the left and right panels illustrate the virus and MNP–virus immobilized on the PC sensors' surface, respectively.
On-chip virus enrichment using antibody-coated MNPs
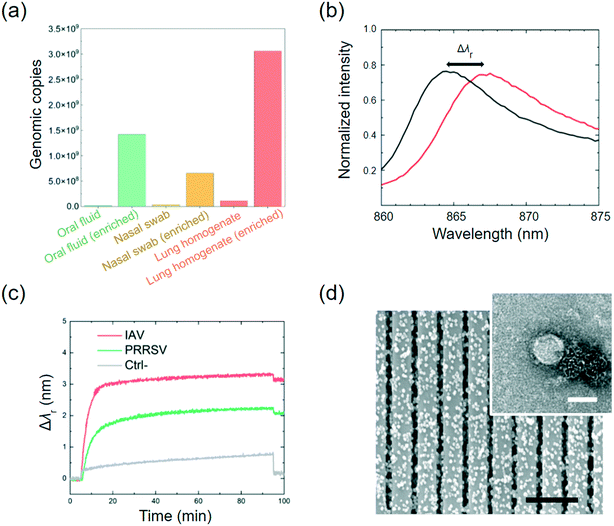
Here, the MNPs were coated using anti-IAV and anti-PRRSV antibodies, respectively. These two types of antibody-coated MNPs were combined and injected into the on-chip mixer, where they were mixed with the clinical sample that was spiked with both IAV and PRRSV isolates (6.25 × 10² TCID50 mL−1 for each virus). The isolated samples were filtered using a 0.22 μm filter to remove cell debris and large particles before being pumped into the mixer. The IAV-antibody-coated MNP and PRRSV-antibody-coated MNP mixture at 1011 particles per mL was injected into the mixer, as shown in Fig. 3(a). While flowing through the mixer at a flow rate of 0.13 mL min−1, viruses can bind to the MNPs and form the MNP–virus conjugates. After passing through the mixer, the MNP–virus conjugates were collected in the 3.14 μL trapping chamber using a magnet placed directly below the chamber (middle photo in Fig. 3(b)). To estimate the virus enrichment efficiency, the rRT-PCR assay was used to measure the IAV concentrations of the samples before and after the on-chip extraction process. Later on, the results of the rRT-PCR tests were also used to calibrate the PC biosensor output. The results in Fig. 4(a) show the genomic copies before and after the MNP-based enrichment. The lung homogenate clinical sample increases the IAV genomic copies from 2.15 × 10⁷ to 1.42 × 10⁹ copies per mL, which represents an enrichment factor of 66 times.After the enriched MNP–virus samples were collected, PBS buffer was injected into the MNP inlet to push the remaining MNP–virus to the magnetic trap and wash the mixer. The waste can exit the chip through waste outlet #2 shown in Fig. 3(a). After the MNP extraction process, the inlets and outlet were closed, and the MNP–virus conjugates were resuspended and transferred to the PC detection chambers using a magnet, the reflection spectra of the biosensors were recorded every 5 s using a spectrometer shown in Fig. 3(c), and the Δλr values were calculated for each PC sensor. Fig. 4(b) shows the wavelength peak value shift before (black) and after (red) the immobilization of the MNP–virus conjugates on the PC sensor. Fig. 4(c) shows the measured Δλr values as a function of time when the MNP–virus samples were adsorbed onto the sensor surfaces. After the biosensor outputs were fully stabilized (at t ≅ 90 min), all unbound MNPs were washed away using phosphate buffered saline (PBS) buffer to obtain the endpoint reading. The BSA blocked PC sensor without antibody functionalization was used as the negative control, which exhibited an output of Δλr = 0.08 nm. In contrast, the IAV–MNP sample (6.25 × 10² TCID50 mL−1) and PRRSV samples showed Δλr = 3.12 and 2.05 nm, respectively. Based on the dynamic binding curves shown in Fig. 4(c), the Δλr values reached saturation after less than 30 min of incubation. The transmission electron microscopy (TEM) and SEM images in Fig. 4(d) show the conjugated MNP–virus particles and adsorbed conjugates on the PC surface, respectively.
Quantitative analysis of IAV and PRRSV
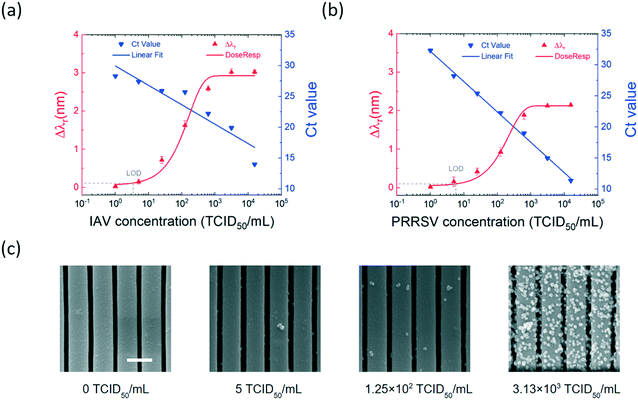
To establish the on-chip integrated assay as a quantitative virus sensing method, we evaluated the assay performance using serial dilutions of IAV and PRRSV isolates, respectively. A five-fold serial dilution of the viral stock, with the virus concentrations ranging from 1 to 1.56 × 10⁴ TCID50 mL−1, was prepared for each virus. The virus titers were analyzed using the MNP-enhanced photonic crystal sensor and the RT-qPCR assays. For the on-chip virus analysis, the IAV and PRRSV samples with the same virus concentration were mixed and conjugated to the antibody-coated MNPs, enriched, and subsequently measured using the label-free PC biosensor. For each concentation, the MNP–virus samples were incubated in the detection chamber for 30 min before the endpoint Δλr values were measured. The RT-qPCR tests determined the Ct values of the virus at each dilution.Fig. 5(a) compares the measured Δλr and Ct values for the dilution series of the IAV samples. The Δλr value increased from 0.03 nm to 3.02 nm with the increase of the IAV concentration from 1 to 1.56 × 10⁶ TCID50 mL−1. Meanwhile, the RT-qPCR Ct value decreased from 28.3 to 14. The measured resonant wavelength shift as a function of virus concentration was fitted using a sigmoid function to generate the dose–response curve. Using the dose–response curve (red line in Fig. 5(a)), the limit of detection (LOD) of the on-chip assay for the IAV samples was found as 3.5 TCID50 mL−1. Fig. 5(b) shows the Δλr and Ct values for the isolated PRRSV samples with the concentrations of 1 to 1.56 × 10⁶ TCID50 mL−1. Based on the dose–response curve, the LOD of the on-chip assay for the PRRSV samples was 5.9 TCID50 mL−1. The PC sensors used for the PRRSV titration tests were removed from the chip and SEM was used to check the density of PRRSV–MNPs. It can be seen from the SEM images in Fig. 5(c) that the number of immobilized PRRSV–MNPs on the PCs is proportional to the PRRSV concentration.
Detection of IAV and PRRSV in clinical samples
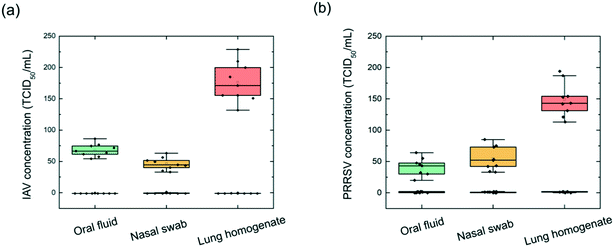
Next, the on-chip virus sensor was implemented to three different types of clinical specimens, including swine oral fluid, nasal swab, and lung homogenate. The clinical samples were filtered through a 0.22 μm filter to remove cell and debris and then injected into the flow cell. The anti-IAV antibody-coated and anti-PRRSV antibody-coated MNPs were combined and pumped into the inlet to mix with the filtered clinical samples. After being mixed through the on-chip mixer channel, the MNP–virus conjugates were collected in the trapping chamber. The detection chambers include one PC sensor, which was pre-functionalized with IAV antibodies and PRRSV antibodies, and a negative control sensor blocked using BSA. The PC reflection spectra were measured every 0.5 min until the Δλr outputs reached a plateau. Then, the reaction chamber was washed using DPBS buffer, and endpoint Δλr reading was recorded.Three different clinical samples including oral fluid, nasal swab, and lung homogenate were tested. To investigate the repeatability of the iMOF assay, the test of each clinical sample was repeated nine times using single-use PC sensors and the re-generated flow cells. To analyze all the samples, we prepared 108 PC sensor disks and six reusable flow cells. Fig. 6 summarizes the calculated virus concentrations based on measured Δλr values for IAV ((a)) and PRRSV ((b)). A threshold was set for the sensor's LOD to distinguish positive and negative events. For the IAV positive samples, the oral fluid, nasal swab, and lung homogenate exhibited averaged Δλr of 1.03 nm, 0.76 nm, and 1.92 nm, respectively. The virus concentrations were subsequently calculated using the dose–response curve in Fig. 5(a). Based on the calculation, the average IAV concentrations in the examined oral fluid, nasal swab, and lung homogenate samples were 68, 46, and 176 TCID50 mL−1. These clinical samples were also analyzed using the RT-qPCR assay. The oral fluid, nasal swab, and lung homogenate had an IAV PCR Ct value of 15.8, 16.9, and 14.7, respectively. The PCR tests also found nine samples with a Ct value above 38, which represented the negative samples. The PCR analysis of the IAV samples showed that, among the tested lung homogenate, oral fluid and nasal swab samples, the lung homogenate sample had the highest IAV concentration while the nasal swab sample had the lowest IAV concentration. The results suggested that the on-chip virus sensor can be used to distinguish positive and negative samples and quantify virus concentrations in these samples. The same analysis was performed to PRRSV using the dose–response curve shown in Fig. 5(b). The average PRRSV concentrations in the oral fluid, nasal swab, and lung homogenate samples were found to be 42, 54, and 149 TCID50 mL−1. For the PRRSV samples, the oral fluid, nasal swab, and lung homogenate exhibited averaged Δλr of 0.82 nm, 1.24 nm, and 1.73 nm, respectively. The PRRSV concentration was also confirmed using the PCR with the negative sample Ct values above 38. The results in Fig. 6 indicate that the viral load varies depending on the type of sample and virus. The lung homogenate samples demonstrated the highest level of viral load for both IAV and PRRSV. Based on the clinical sample detection from the four swines, we can confirm that one of the swine was infected by IAV, one swine was infected by PRRSV, and two swine were uninfected.
Conclusions
This work demonstrated an on-chip virus analysis technology that can characterize multiple viruses in clinical samples with automated sample processing and detection. The on-chip virus analysis consists of two main functions: immunomagnetic virus enrichment using MNPs and label-free detection using PC biosensors. The advantages of the on-chip virus assay include multiplexed detection, low-cost and disposable sensors, short total assay time of one hour, and automated assay. The iMOF platform exhibited LODs of 3.5 TCID50 mL−1 and 5.9 TCID50 mL−1 for the detection of IAV and PRRSV, respectively. In comparison, the existing RT-qPCR approach can detect swine respiratory viruses with an LOD as low as 1 TCID50 mL−1 but require an approximately two times longer assay time to extract and amplify RNAs using laboratory equipment. In contrast, the compact iMOF platform could be implemented for in-field detection of these swine respiratory viruses. This proof-of-concept study showed that we could use the on-chip assay to detect and quantify swine respiratory viruses (IAV and PRRSV) present in various clinical samples.The on-chip virus sensor technology can be further improved in the following aspects. First, a flow cell with a higher density of reaction chambers can be implemented to study a larger panel of viruses that are associated with swine respiratory diseases and other viral infections. Second, to simplify the assay, antibody-coated MNPs can be lyophilized inside the flow cell. The on-chip storage capability will eliminate the need for preparing and injecting the MNPs by users. Third, a portable and compact reflection reader can be developed to measure the PC sensor output and analyze the results in real time. Last but not least, the system can be fully automated by mounting an electromagnet on a motorized stage and synchronizing the operations of the syringe pump, electromagnet, and detector of the PC sensor. Once fully developed, the on-chip virus analyzer can be a point-of-care diagnostic tool for rapid and specific detection of target viruses to benefit the clinical diagnosis and treatment of viral diseases.
Methods and materials
Materials and reagents
The PRRSV-specific antibody, which targets PRRSV's glycoproteins, was purchased from VWR International, LLC. Anti-swine IAV (H1N1) hemagglutinin antibody (anti-HA antibody) was from Sigma-Aldrich (St. Louis, MO, USA). The 50 nm MNP conjugation kit was provided by Ocean NanoTech (San Diego, CA, USA). DPBS (Dulbecco's phosphate buffered saline) was obtained from Thermo Fisher Scientific (Waltham, MA, USA). Polyvinylamine was purchased from BASF (Ludwigshafen, Germany). The GA solution was obtained from Sigma-Aldrich (St. Louis, MO, USA). Syringe filters were purchased from MilliporeSigma (Burlington, MA, USA).Electromagnetic simulation
The FDTD simulations were performed in two dimensions using a software package (FDTD Solutions, Lumerical Inc.). The simulation domain was set to one period of the 555 nm-pitch grating with periodic boundary conditions imposed along the grating direction. The perfect matching layers were used as the boundary condition perpendicular to the grating. The incident field was set as a plane wave, whose propagation direction was perpendicular to the grating surface. The incident light was TM polarized in the wavelength range from 750 nm to 950 nm. The reflection and transmission from the PC grating were recorded using two frequency domain monitors. When the resonant wavelength was found from the reflection spectrum, the electric field distribution inside the simulation domain was plotted as the local field around the PC grating.Surface functionalization of MNPs for IAV and PRRSV
To coat the MNPs with anti-IAV and anti-PRRSV antibodies, the carboxyl acid-modified MNPs were activated using the EDC/sulfo-NHS covalent coupling procedure.26 First, 0.2 mL of the MNPs (10 mg mL−1), 0.2 mL activation buffer, and 20 μL EDC solution (20 mg mL−1) were mixed and incubated at room temperature for 15 min. Then, the 0.1 mL anti-IAV or anti-PRRSV antibody (1 mg mL−1 in activation buffer) was mixed with the MNP solution for 3 h at room temperature with continuous shaking. After the antibody coating, the MNP surface was blocked using 0.1 mL quenching buffer for 30 min to prevent non-specific bindings. A permanent magnet was used to attract the antibody-coated MNPs, followed by resuspension in 200 μL phosphate-buffered saline (PBS) solution and storage at 4 °C for future use.Preparation of PC biosensors
The PC biosensor measures the change of the refractive index induced by the adsorption of biomaterials onto its surface.27–29 Here, the nanoreplica molding approach was used to replicate the 1D PC structure from a 555.5 nm-period silicon grating (LightSmyth Technologies) to an optical adhesive (NOA 86, Norland Products) on a 180 μm-thick plastic sheet. A 100 nm TiO2 thin film was coated on the replicated grating using an electron beam evaporator. The PC sensors were cut into 5 mm-diameter disks and attached to the 3D-printed flow cells. To immobilize specific virus antibodies, the PC sensor was incubated in polyvinylamine (PVAm, BASF) for 5 h and then activated using glutaraldehyde (Sigma-Aldrich) for 1.5 h at room temperature. The anti-HA and anti-PRRSV antibodies were dispensed and incubated on the PC sensor disks at 0.1 mg mL−1 for 2 h. Then, the BSA-GA blocker was used to prevent unspecific binding of bare MNPs and interfering molecules.29Design and fabrication of the integrated sensor chip
The flow cells were 3D-printed by SHAPEWAYS (Long Island City, NY). The flow cell comprises three inlets, two outlets, an on-chip sample mixer, an MNP extraction chamber, and three PC detection chambers, as shown in Fig. 1(a) and 2. The width and depth of the flow channels and the mixer were 1 mm and 1 mm, respectively. The total channel length of the mixer was 490 mm. The diameters of the inlet/outlet, extraction chamber, and PC detection chamber were 2 mm, 2 mm, and 4 mm, respectively. The antibody-coated PC sensor disks were attached to the bottom of the detection chambers and stored in PBS buffer prior to use.Virus isolates and clinical samples
The IAV isolate A/swine/MO/A01203163/2012 (H1N1) was isolated, propagated, and titrated in MDCK cells (ATCC CCL-34), following the published protocol.30 This IAV isolate stock had an infectious titer of 107 median tissue culture infectious dose per mL (TCID50 mL−1). The PRRSV isolate VR-2385 was propagated and titrated in MARC-145 cells (ATCC CRL-12231) following the previously described protocol with the stock virus titer of 105 TCID50 mL−1.31 When making the five-fold serial dilutions of the virus isolates, a minimum essential medium (MEM) was used. The isolated virus samples were spiked with given concentrations, including 1.56 × 10³, 3.13 × 10³, 6.25 × 10², 1.25 × 10², 25, 5, and 1 TCID50 mL−1 of IAV or PRRSV, for the initial evaluation of the on-chip assay. The clinical samples, including oral fluids, nasal swabs, and lung tissue homogenates, were selected from the samples submitted to the Iowa State University Veterinary Diagnostic Laboratory. These clinical samples were also tested by the IAV RT-qPCR and PRRSV RT-qPCR to verify their status.Nucleic acid extraction and IAV and PRRSV PCR testing
Nucleic acids were extracted from 100 μL virus isolates or clinical samples using a MagMAX Pathogen RNA/DNA extraction kit (Thermo Fisher Scientific, Waltham, MA) and a Kingfisher Flex instrument (Thermo Fisher Scientific) following the instructions of the kit manufacturer. Nucleic acids were eluted with 90 μL of elution buffer. For IAV PCR testing, a commercial IAV RT-qPCR kit targeting conserved matrix gene and/or nucleoprotein gene (VetMAX-Gold SIV One-Step RT-PCR assay, Thermo Fisher Scientific) was used, and the previously described procedures were followed.32 Ct < 38 was considered positive and Ct ≥ 38 was considered negative for IAV. For PRRSV PCR testing, a commercial PRRSV RT-qPCR kit targeting conserved ORF6 and ORF7 genomic regions (VetMAX PRRSV NA&EU One-Step RT-PCR assay, Thermo Fisher Scientific) was used following the previously described protocols.33 Ct < 37 was considered positive, and Ct ≥ 37 was considered negative for PRRSV. Standard curves generated using known concentrations of in vitro transcribed viral RNA provided in the assay kits were used to quantify the genomic copies of the virus.Conflicts of interest
The authors declare no competing financial interest.Acknowledgements
This work was supported by the United States National Science Foundation under Grant No. ECCS 17-11839 and ECCS 16-53673, the National Institute of Food and Agriculture under Award No. 2018-67021-27968, and Iowa State University's COVID-19 Seed Grant. Any opinions, findings, and conclusions or recommendations expressed in this material are those of the authors and do not necessarily reflect the views of the National Science Foundation.References
- C. W. Olsen, S. Carey, L. Hinshaw and A. I. Karasin, Arch. Virol., 2000, 145, 1399–1419 CrossRef CAS PubMed.
- M. J. Yaeger and W. G. Alstine, Dis. Swine, 2019, 393–407 Search PubMed.
- G. Trevisan, K. J. Schwartz, E. R. Burrough, B. Arruda, R. J. Derscheid, M. C. Rahe, E. de Magalhães, M. N. Almeida, R. G. Main and D. C. Linhares, J. Vet. Diagn. Invest., 2021, 33, 428–438 CrossRef PubMed.
- E. J. Neumann, J. B. Kliebenstein, C. D. Johnson, J. W. Mabry, E. J. Bush, A. H. Seitzinger, A. L. Green and J. J. Zimmerman, J. Am. Vet. Med. Assoc., 2005, 227, 385–392 CrossRef PubMed.
- J. S. Ellis and M. C. Zambon, Rev. Med. Virol., 2002, 12, 375–389 CrossRef CAS PubMed.
- S. Payungporn, S. Chutinimitkul, A. Chaisingh, S. Damrongwantanapokin, C. Buranathai, A. Amonsin, A. Theamboonlers and Y. Poovorawan, J. Virol. Methods, 2006, 131, 143–147 CrossRef CAS PubMed.
- H. Lu, Avian Dis., 2003, 47, 361–369 CrossRef PubMed.
- S. Wang, X. Shan, U. Patel, X. Huang, J. Lu, J. Li and N. Tao, Proc. Natl. Acad. Sci. U. S. A., 2010, 107, 16028–16032 CrossRef CAS PubMed.
- V. D. Krishna, K. Wu, A. M. Perez and J.-P. Wang, Front. Microbiol., 2016, 7, 400 Search PubMed.
- X. Li, K. Scida and R. M. Crooks, Anal. Chem., 2015, 87, 9009–9015 CrossRef CAS PubMed.
- A. Poghossian, M. Jablonski, D. Molinnus, C. Wege and M. J. Schöning, Front. Plant Sci., 2020, 11, 598103 CrossRef PubMed.
- P. Skládal, C. dos Riccardi, H. Yamanaka and P. I. da Costa, J. Virol. Methods, 2004, 117, 145–151 CrossRef PubMed.
- Y.-T. Yeh, Y. Tang, A. Sebastian, A. Dasgupta, N. Perea-Lopez, I. Albert, H. Lu, M. Terrones and S.-Y. Zheng, Sci. Adv., 2016, 2, e1601026 CrossRef PubMed.
- M. Niimi, T. Masuda, K. Kaihatsu, N. Kato, S. Nakamura, T. Nakaya and F. Arai, Sens. Actuators, B, 2014, 201, 185–190 CrossRef CAS PubMed.
- G. Seo, G. Lee, M. J. Kim, S.-H. Baek, M. Choi, K. B. Ku, C.-S. Lee, S. Jun, D. Park, H. G. Kim, S.-J. Kim, J.-O. Lee, B. T. Kim, E. C. Park and S. I. Kim, ACS Nano, 2020, 14, 5135–5142 CrossRef CAS PubMed.
- R. J. Hall, J. Wang, A. K. Todd, A. B. Bissielo, S. Yen, H. Strydom, N. E. Moore, X. Ren, Q. S. Huang, P. E. Carter and M. Peacey, J. Virol. Methods, 2014, 195, 194–204 CrossRef CAS PubMed.
- D. Akin, H. Li and R. Bashir, Nano Lett., 2003, 4, 257–259 CrossRef.
- A. Sakudo, Int. J. Mol. Med., 2012, 30, 3–7 CAS.
- Y. Chen, Y. Xianyu, Y. Wang, X. Zhang, R. Cha, J. Sun and X. Jiang, ACS Nano, 2015, 9, 3184–3191 CrossRef CAS PubMed.
- K.-Y. Lien, J.-L. Lin, C.-Y. Liu, H.-Y. Lei and G.-B. Lee, Lab Chip, 2007, 7, 868 RSC.
- G. D. Chen, C. J. Alberts, W. Rodriguez and M. Toner, Anal. Chem., 2009, 82, 723–728 CrossRef PubMed.
- L. Liu, H. Monshat, H.-Y. Wu and M. Lu, Nanotechnology, 2020, 31, 375302 CrossRef CAS PubMed.
- L. Liu, H. A. Khan, J. Li, A. C. Hillier and M. Lu, Nanotechnology, 2016, 27, 295301 CrossRef PubMed.
- J.-N. Liu, M. V. Schulmerich, R. Bhargava and B. T. Cunningham, Opt. Express, 2011, 19, 24182 CrossRef PubMed.
- B. T. Cunningham, P. Li, S. Schulz, B. Lin, C. Baird, J. Gerstenmaier, C. Genick, F. Wang, E. Fine and L. Laing, J. Biomol. Screening, 2004, 9, 481–490 CrossRef CAS PubMed.
- J. Qian, Q. Zhang, M. Liu, Y. Wang and M. Lu, Biosens. Bioelectron., 2022, 196, 113707 CrossRef CAS PubMed.
- I. D. Block, N. Ganesh, M. Lu and B. T. Cunningham, IEEE Sens. J., 2008, 8, 274–280 CAS.
- Y. Wang, Q. Zhang, W. Yuan, Y. Wang, H. J. Loghry, Z. Zhao, M. J. Kimber, L. Dong and M. Lu, Lab Chip, 2021, 21, 196–204 RSC.
- Q. Zhang, H. J. Loghry, J. Qian, M. J. Kimber, L. Dong and M. Lu, Lab Chip, 2021, 21, 3541–3549 RSC.
- J. Zhang and P. C. Gauger, Methods Mol. Biol., 2020, 281–294 CrossRef PubMed.
- W. Yim-im, H. Huang, J. Park, C. Wang, G. Calzada, P. Gauger, K. Harmon, R. Main and J. Zhang, J. Clin. Microbiol., 2021, 59, e01757-20 CrossRef PubMed.
- J. Zhang and K. M. Harmon, Methods Mol. Biol., 2020, 295–310 CrossRef PubMed.
- G. Rawal, W. Yim-Im, F. Chamba, C. Smith, J. Okones, C. Francisco and J. Zhang, Transboundary Emerging Dis., 2021, 1212–1226 Search PubMed.
| This journal is © The Royal Society of Chemistry 2022 |

