 Open Access Article
Symmetric CEST-active lanthanide complexes for redox monitoring†
Damien
Mouchel dit Leguerrier
a,
Richard
Barré
a,
Quentin
Ruet
bc,
Véronique
Frachet
 bc,
Daniel
Imbert
 d,
Fabrice
Thomas
 *a and
Jennifer K.
Molloy
 *a
*a
aUniv. Grenoble Alpes, CNRS, DCM, 38000 Grenoble, France. E-mail: jennifer.molloy@univ-grenoble-alpes.fr
bInstitute for Advanced Biosciences, INSERM U1209, UMR CNRS 5309, Grenoble Alpes University, 38700 La Tronche, France
cEPHE, PSL Research University, 75014 Paris, France
dUniv. Grenoble Alpes, CEA, CNRS, IRIG-LCBM, 38000 Grenoble, France
First published on 15th November 2022
Abstract
Two symmetric ligands harbouring two TEMPO radicals and two functionalized acetamide arms (R = OMe (L1), CF3 (L2)) were prepared and chelated to lanthanide ions (EuIII, YbIII for both L1 and L2, DyIII for L1). Luminescence measurements on the europium complexes support the coordination of a single water molecule. The TEMPO arms are magnetically interacting in L1 (and its complexes) but not in L2. The TEMPO moieties can be reversibly oxidized into an oxoammonium (0.33–0.36 V vs. Fc+/Fc) or reduced into a hydroxylamine (ill-defined redox wave, reduction by ascorbate), which are both diamagnetic. The europium complexes [Eu(L1)]3+ and [Eu(L2)]3+ in their hydroxylamine form exhibit a temperature dependent CEST effect, which is maximal at 25 °C (30%) and 37 °C (12%), respectively. The CEST activity is dramatically reduced in the corresponding nitroxide forms due to the paramagnetism of the ligand. The europium complexes show no cytotoxicity against M21 cell lines over long incubation times (72 h) at high concentration (40 μM).
1. Introduction
Redox switches have recently been proposed as a new alternative in smart responsive imaging in order to track and monitor the implication of reactive oxygen species (ROS) in several illnesses.1 Increasing concentrations of ROS have been, for instance, reported in incurable (or hard to cure) diseases such as cancers or neurodegenerative disorders.2–4 The detection of these molecular species is thus essential for a more complete understanding, diagnosis and treatment.5Lanthanide complexes have been extensively used in medical imaging due to their fascinating optical and magnetic properties, lending them to ratiometric detection.6 Responsive medical imaging has been increasingly reported with detection of metal ions, pH, redox conditions etc.1,7,8 However, the development of lanthanide complexes, both luminescent and magnetic, which are sensitive to redox stimuli are not very well reported.1 In particular, lanthanides ions are stable to redox stimuli, existing predominantly in their +III oxidation state (with some exceptions such as EuII/EuIII).1,9 Redox sensitive lanthanide complexes depend on a novel approach that combines a redox active ligand with the lanthanide ion.10–12,37 The redox active ligand is thus the detector and the lanthanide ion then functions as a reporter with luminescent and magnetic responses. The Chemical Exchange Saturation Transfer (CEST) technique is a relatively new derivative technique of MRI, which utilises exchangeable protons on the ligand structure.13,14 Selective irradiation followed by proton exchange results in a decrease in the bulk water signal. This technique presents a distinct advantage over classical MRI: selective irradiation can be employed in order to tailor the response.15 The selective irradiation means that the activity can be switched on and off on demand.
CEST imaging has been shown to demonstrate changes in redox activity in biological systems such as the NAD+/NADH couple. This activity is based on small changes in diamagnetic CEST.16 Much larger shifts of the exchange proton signals can be achieved using paraCEST, limiting the risk of off-resonance.17 We have recently reported redox active EuIII complexes with amide pendant arms presenting a 12% CEST effect at 50 ppm upon reduction, demonstrating a proof of concept for redox sensitive paraCEST probes.18,19 The CEST active complex showed a modest 6% switch in CEST activity between oxidised and reduced states. The asymmetric nature of these complexes was potentially the reason for the very low CEST effect observed. The CEST effect can indeed be dependent on the symmetry, which can increase the water exchange rate. D. Sherry et al. suggested that symmetric complexes, particularly forming the SAP isomer could show increased CEST activity.20 The design of symmetric systems containing both a CEST function and a redox active function was of immense interest to us, potentially increasing the number of equivalent protons and the CEST effect. The incorporation of two redox active arms instead of one could also increase the difference between the oxidized and reduced state. We herein report two symmetric macrocyclic ligands containing two CEST active amide functions and two redox active TEMPO functions. We demonstrate that the CEST effect is significantly improved in the europium complexes (up to 30%) in CH3CN/H2O in comparison to the previous series of compounds.
2. Results and discussion
2.1 Synthesis & characterisation
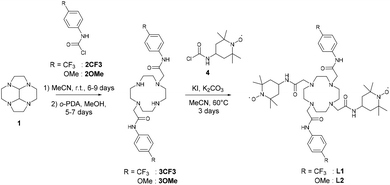
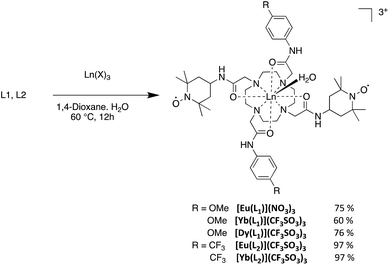
The synthesis of ligands L1 and L2 (Scheme 1) was performed via selective N-alkylation of the cyclen macrocycle. For this purpose we used the glyoxal cyclen precursor 1 (Scheme 1) and followed the procedure developed by Tripier et al.21 This allowed specific functionalization with the 2-chloro-N-(4-methoxyphenyl)acetamide (2OMe)22 or the 2-chloro-N-(4-trifluoromethylphenyl)acetamide (2CF3),23 affording 3OMe and 3CF3, respectively, after treatment with PDA. The final ligands were generated via functionalization of the remaining two secondary amines with the TEMPO acetamide precursor 4. This yields the symmetrically functionalised macrocycles L1 and L2, with a modest yield of 29% (L1) and 38% (L2) respectively (Scheme 1). The NMR characterization of the ligands was performed in the presence of ascorbate to reduce the nitroxide moieties into diamagnetic hydroxylamines. In particular, the resonances of the phenyl moieties are observed at δ = 6.84 and 7.53 ppm for L1 and 7.56 and 7.83 ppm for L2. The significant shielding in the case of L1 is a consequence of the strong electron donating ability of the methoxy substituent. Noteworthy, L2 exhibits a single peak at −63.6 ppm in 19F NMR.The EuIII, DyIII, YbIII complexes were prepared by reaction in H2O at pH 7.4, with the respective lanthanide salts (Scheme 2). The complexes were isolated by precipitation with yields of 60–97%. The complexes gave molecular signals corresponding to the tri-cations in ESI-MS, as exemplified by the peaks at m/z = 357.83, 359.63, 361.51 and 364.84, respectively for the EuIII, YbIII, DyIII of the first series. The complexes [Eu(L2)]3+ and [Yb(L2)]3+ show two peaks in 19F NMR, −61.5 and −77.6 for the first and −62.0, −78.7 for the second. Similar values have been reported for CF3 containing EuIII complexes.24,25 The resonance at 78 ppm is assigned to the triflate counter-ion, the other to the trifluoromethyl substituent of the phenyl ring.
2.2 Electrochemistry
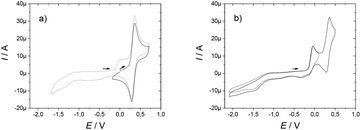
The ligands L1 and L2 are symmetric and possess two redox active functions. Hence, we conducted an electrochemical characterisation on both the ligands and the corresponding complexes. Electrochemical analysis was performed using cyclic voltammetry (CV) and rotating disk electrode (RDE) measurements in acetonitrile solution with 0.1 M tetra-n-butyl ammonium perchlorate (TBAP) as supporting electrolyte. Ferrocene was used as an external redox standard.The ligands L1 and L2 each present an ill-defined irreversible reduction wave in the range −1 to −1.5 V versus Fc+/Fc, which is assigned to the reduction of the nitroxide moieties. Upon scanning towards the anodic region, an irreversible oxidation wave was observed at 0.01 V and −0.04 V for L1 and L2, respectively. It is followed by a reversible oxidation wave at 0.33 V, which is assigned to the oxoammonium/nitroxide redox couple (Table 1). This latter potential is similar to that measured for the simple nitroxide arm 4 used as a reference, with an oxidation wave at 0.33 V. The irreversible oxidation wave seems to be associated with either an acido-basic equilibrium due to the nitroxide units18 or the oxidation of the hydroxylamine into the nitroxide. Indeed, a proton-coupled electron transfer is expected to shift the oxidation wave close to the oxoammonium/nitroxide redox potential. The intensity of this peak increases when the scan is expanded to a larger range to include the nitroxide/hydroxylamine wave. RDE measurements showed that the reversible oxidation wave corresponded to two electrons, thus suggesting that the nitroxide moieties are electrochemically equivalent for each ligand (Fig. 1).
| Complexes |
E
p![[thin space (1/6-em)]](https://www.rsc.org/images/entities/char_2009.gif) a a |
E 1/2 | Complexes |
E
p![[thin space (1/6-em)]](https://www.rsc.org/images/entities/char_2009.gif) a a |
E 1/2 |
|---|---|---|---|---|---|
| a From cyclic voltammetry experiments in CH3CN (+0.1 M TBAP). The potentials are referenced to the regular Fc+/Fc redox couple that was used as an external reference. | |||||
| L1 | 0.01 | 0.33 | L2 | −0.01 | 0.33 |
| [Eu(L1)]3+ | 0.04 | 0.36 | [Eu(L2)]3+ | −0.05 | 0.33 |
| [Yb(L1)]3+ | 0.01 | 0.36 | [Yb(L2)]3+ | 0.03 | 0.33 |
| [Dy(L1)]3+ | −0.01 | 0.36 | |||
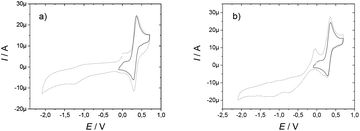
The complexes demonstrated electrochemical behaviour very similar to that of the ligands (Table 1). For example, the EuIII complexes demonstrate an oxidation wave at 0.36 V and 0.33 V for [Eu(L1)]3+ and [Eu(L2)]3+ respectively, which can be assigned to the nitroxide oxoammonium couple, in addition to an irreversible system similar to the free ligand at 0.01 V and 0.05 V, respectively (Fig. 2).
No redox event was clearly observed that could be assigned to the EuIII/EuII redox couple. Additionally, the metal ion has little or no effect on the oxidation potentials as each complex shows very similar E1/2 values.
2.3 Luminescence spectroscopy
Luminescence spectroscopy can provide structural information from the f–f transitions for the EuIII complexes and can be used to calculate the number of coordinated water molecules.26 Luminescence spectra were recorded both in MeOH and CH3CN/H2O, due to solubility, via excitation in the ligand at 280 nm for [Eu(L1)]3+ and [Eu(L2)]3+. This yielded the distinctive transitions 5D0 → 7F0–4 for the EuIII luminescence corresponding to the main emissive levels of the species (Fig. 3). Excitation spectra confirmed sensitisation occurs via population of the ligand excited state. In particular, the 5D0 → 7F0 is a quite intense and fine emission band suggesting low symmetry for the coordination sphere, with an intense emission for the 5D0 → 7F2 commonly observed for DOTAM based derivatives.38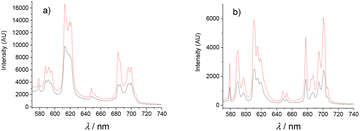 | ||
| Fig. 3 Emission spectra of (a) [Eu(L1)]3+ and (b) [Eu(L2)]3+ in MeOH. Black: before addition of ascorbate; Red: after addition of one equivalent of ascorbate. T = 298 K. | ||
The emission profiles of [Eu(L1)]3+ and [Eu(L2)]3+ were very similar. As an example, the calculated ratios of the bands I (5D0 → 7F2)/I (5D0 → 7F1) were 3.1 and 3.6 respectively for the [Eu(L1)]3+ and [Eu(L2)]3+ in MeOH. The intensity ratios I (5D0 → 7F4)/I (5D0 → 7F1) gave 2.8 and 2.7 respectively, indicating closely related coordination spheres. The emission spectra recorded for the YbIII complexes demonstrated only weak luminescence upon excitation at 280 nm for [Yb(L1)]3+. Emission spectra for [Yb(L2)]3+ showed no successful sensitisation of the excited state in this complex. This is potentially due to the high excitation wavelength permitting destabilisation of the excited state by non-radiative decay.
Luminescence lifetime measurements permitted the determination of the number of bound water molecules on the metal ion. Solutions of CH3CN/H2O and CD3N/D2O (10/90) were used to estimate the influence of OH oscillators on the luminescence decay. The luminescent lifetimes in deuterated and non-deuterated solvent were determined as τ = 0.48 ms and 1.43 ms respectively for H2O and D2O for the complex [Eu(L1)]3+. These values were then extrapolated using the formulas of Horrocks and Parker, which take into consideration the NH oscillators in proximity to the coordination sphere of the EuIII cation.27,28 It must be stressed that the formula was initially developed for complexes in neat aqueous solutions. Assuming that the CH3CN has very small influence on the parameters, we calculated one water molecule bound in the coordination sphere of the metal ion for both the [Eu(L1)]3+ and [Eu(L2)]3+ consistent with coordination complexes based on 9-coordinate DOTAM derivative structures. This was supported by performing the same measurements in MeOH using the Horrocks formula which also suggested one bound water molecule. Finally, the addition of ascorbate to reduce the nitroxide moieties results in an increase in the intensity of the emission bands by approximately one half. The quenching of the lanthanide luminescence in the oxidised form could be tentatively assigned to intramolecular quenching of the excited state due to the radical.
2.4 Electron paramagnetic resonance
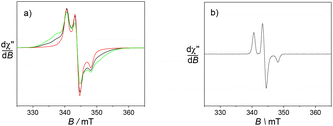
Electron Paramagnetic Resonance (EPR) measurements were utilised to gain insight into the environment of the nitroxide radicals and metal ion.First, the spectra of the ligands in fluid CH3CN solution mainly show an isotropic three-line pattern reminiscent of the TEMPO radical (Fig. 4). It is indeed centred at giso = 2.006 with the hyperfine splitting AN of 1.6 mT. L1 demonstrates two additional features overlapped with the three line nitroxide pattern, which can be assigned to magnetic interactions between the nitroxide moieties.29 These two features are in fact part of a five-line pattern overlapped with the dominant three-line pattern. The five-line splitting arises from exchange interactions between two nitroxide moieties, with the assumption that the coupling constant J is greater than the hyperfine splitting AN. It is centred at the same g value and the resulting system exhibits hyperfine coupling constants that are half those of the isolated nitroxide. The spectrum of L2 does not feature such peculiarities, suggesting different positioning and thus interaction of the nitroxide arms.
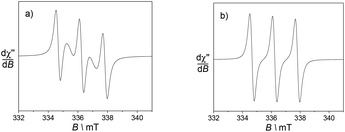 | ||
| Fig. 4 X band EPR spectra of 0.5 mM CH3CN solutions of the ligands (a) L1 and (b) L2. Microwave freq. 9.42 GHz; power, 3.5 mW; modulation amp., 0.2 mT; freq. 100 KHz. T = 293 K. | ||
Hence, the EPR spectrum of L1 supports the presence of a conformation that places the nitroxides units in a favourable situation for magnetic interactions between the two redox functions.
Both [Eu(L1)]3+ and [Eu(L2)]3+ exhibit isotropic spectra very similar to those of the corresponding ligands, with only the resonances of the nitroxide unit (see ESI†), unsurprising considering the weak magnetic moment of the EuIII ion.
The ytterbium and dysprosium ions cannot be detected at room temperature due to their fast relaxation. In both cases the spectra were recorded at low temperature. Below 20 K an anisotropic nitroxide signature is observed around g = 2.00 for [Yb(L1)]3+, with outermost broad resonances covering the 320–370 mT region (Fig. 5). The spectra recorded at different microwave powers show the same behaviour, confirming that it is not due to saturation effects. The most likely origin for these features is a magnetic coupling between the nitroxides units and the ytterbium ion. However, the nature of the ground spin state and the associated zero field splitting parameters could not be determined due to the significant linewidth. It is worth noting that no such resonances are observed for [Yb(L2)]3+. Hence the phenyl para substituents play a role in orientating the nitroxide moieties, although the details remain yet unclear.
After reduction with sodium ascorbate, the complex [Yb(L1)]3+ demonstrates well-defined resonances at g = 5.47, 4.35 and 3.60, with intensity ratios corresponding to the natural abundances of the Yb(III) isotopes. In comparison, the complex [Yb(L2)]3+ shows a less defined resonance at g = 5.41. This behaviour is reminiscent of isolated Yb(III) complexes, confirming reduction of the TEMPO moiety.
The same behaviour is observed for the dysprosium complexes (see ESI†). More specifically, [Dy(L1)]3+ displays the features of magnetically coupled system.
2.5 CEST activity
The addition of two substituted phenyl substituents (CF3 and OMe) provides NH exchangeable protons which have been previously shown to demonstrate significant CEST activity.22,30 The ligands L1 and L2 thus provide three potential CEST active moieties, the NH of the amide arms, the NH of the acetamide function and the coordinated water molecule. Selective irradiation of each of the exchangeable protons on the ligand at their Larmor frequency saturates their magnetisation. It is transferred by chemical exchange to bulk water, leading to a decrease in the water peak intensity. In order to observe a CEST effect the ligand proton exchange rate needs to be in the intermediate to slow exchange regime.31The paraCEST spectra of [Ln(L1)]3+ and [Ln(L2)]3+ were recorded at 25 °C at pH 7.4 in a H2O![[thin space (1/6-em)]](https://www.rsc.org/images/entities/char_2009.gif) :
:![[thin space (1/6-em)]](https://www.rsc.org/images/entities/char_2009.gif) CH3CN (2
CH3CN (2![[thin space (1/6-em)]](https://www.rsc.org/images/entities/char_2009.gif) :
:![[thin space (1/6-em)]](https://www.rsc.org/images/entities/char_2009.gif) 1) mixture at 25 μT.
1) mixture at 25 μT.
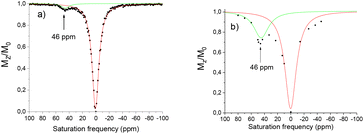
In its nitroxide form, the complex [Eu(L1)]3+ presents a paramagnetically shifted resonance at 46 ppm from bulk water, exhibiting a CEST effect of 4% at 25 °C (Fig. 6). This peak can be assigned to the H2O molecule coordinated to the lanthanide ion compared to reported literature resonances for coordinated H2O.20,32,33 From the ratio of intensities of the ligand proton resonance and the water peak the CEST effect was estimated to 4%. Reduction of the nitroxide unit to the hydroxylamine using ascorbate results in an increase of this peak at 46 ppm to 30%. This is much larger than that reported in our previous work with simple amide arms.18
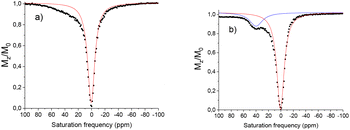
This difference of 26% is significant and could potentially be interesting in the development of new CEST probes, however before such projections could be undertaken the solubility problems need to be resolved. Variable temperature measurements were performed to determine if the water exchange rate is limiting. The maximum CEST activity was observed at 25 °C at 30%, decreasing to 21% at 37 °C (Fig. 7). The residence time of the water molecule was calculated via Omega plot34 (variation of the CEST intensity as a function of the pulse irradiation strength) to be 380 μs, decreasing to 310 μs at 37 °C, suggesting that the water exchange rate is optimal.
In the case of [Eu(L2)]3+ in its nitroxide form only a weak shoulder is observed (under the same conditions as [Eu(L1)]3+). Complexes containing functional groups with CF3 moieties have been reported to demonstrate significantly different water exchange rates due to fluorous and π-stacking interactions.30 For example Allen et al., demonstrate an 80 fold difference between the exchange rates in GdIII phenyl CF3 and OMe substituted complexes.35 The CF3 functionalised complex thus entered into a slow/intermediate exchange regime and presented no visible CEST activity at ambient temperature.
Variable temperature measurements demonstrate at 37 °C that a CEST peak becomes more defined at 40 ppm with an intensity of 12%, suggesting that the CEST activity, similar to the example above could be limited by the water exchange rate. Variable temperature measurements demonstrate an exchange rate of 2450 s−1 at 15° and 3270 s−1 at 37 °C. The absence of CEST signal at ambient temperature is most likely due to this slow exchange (Table 2).
| Complex | T (°C) | δ (ppm) | CEST (%) | k ex (s−1) | τ M (μs) |
|---|---|---|---|---|---|
a 20 mM solution of the complexes reduced by 2 eq. of sodium ascorbate. B0 = 11.7 T; B1 = 19 μT; T = 298 K; mixture H2O![[thin space (1/6-em)]](https://www.rsc.org/images/entities/char_2009.gif) : :![[thin space (1/6-em)]](https://www.rsc.org/images/entities/char_2009.gif) CD3CN (2 CD3CN (2![[thin space (1/6-em)]](https://www.rsc.org/images/entities/char_2009.gif) : :![[thin space (1/6-em)]](https://www.rsc.org/images/entities/char_2009.gif) 1), [HEPES] = 0.07 M à pH 7.4; irradiation time = 4 s. 1), [HEPES] = 0.07 M à pH 7.4; irradiation time = 4 s.
|
|||||
| [Eu(L1)]3+ | 15 | 50 | 10 | 2450 | 410 |
| [Eu(L1)]3+ | 25 | 45 | 30 | 2650 | 380 |
| [Eu(L1)]3+ | 37 | 37 | 21 | 3270 | 310 |
| [Eu(L1)]3+ | 45 | 27 | 18 | nd | nd |
| [Eu(L2)]3+ | 25 | 41 | 4 | nd | nd |
| [Eu(L2)]3+ | 37 | 40 | 12 | 4000 | 250 |
| [Eu(L2)]3+ | 45 | 34 | 8 | nd | nd |
The corresponding dysprosium complex [Dy(L1)]3+ demonstrated no CEST activity in both the oxidised and reduced forms, under the same conditions. The [Yb(L1)]3+ complex shows no CEST activity in the oxidised form. Reduction using sodium ascorbate results in a CEST spectrum presenting two potential CEST resonances very close to the bulk water signal at −10 ppm and −20 ppm. These signals increase to 12% and 4% respectively upon reduction, however further studies were difficult due to their proximity to the H2O bulk signal. Indeed, saturation could allow some offset resonance. These resonances are tentatively assigned to the acetamide exchangeable protons similar to those reported for similar complexes.36 The oxidised and reduced [Yb(L2)]3+ complex shows no well-defined CEST peak, with only a weak shoulder for the reduced species. This complex was thus not studied further.
2.6 Cytotoxicity
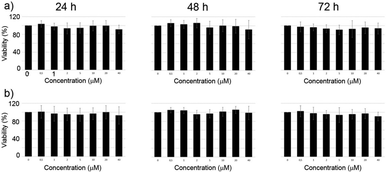
The cytotoxicity of the complexes was investigated by MTT assays on M21 cell line. Due to the limited hydrosolubility of the complexes the medium contains 2% DMSO in H2O. The cells were incubated with the complexes and the viability was determined after 24 h, 48 h and 72 h. Over the whole range of concentrations investigated (1–40 μM) the complexes did not demonstrate any cytotoxicity (Fig. 8).3. Conclusions
In summary two series of lanthanide(III) complexes [Ln(L1)]3+ and [Ln(L2)]3+ were prepared from symmetrical DOTA ligands appended by two TEMPO and two substituted (OMe, CF3) phenylacetamide arms. Luminescence measurements demonstrated the presence of one water molecule in the first coordination sphere, with a similar coordination environment in both series of complexes. The TEMPO moiety could be reversibly oxidized into an oxoammonium function. It can be also reduced by a biological reductant like ascorbate into hydroxylamine. EPR measurements unravel interspin interactions in the ligand L1, which suggests a conformation distinct from L2. Such interaction is preserved in the complexes and at the solid state. It has been reported in some europium macrocycles that the CF3 substituents of pendent phenyl groups are sufficiently fluorophilic to interact together, driving π–π interactions between the aromatics.30 This results in a shielding of the coordinated water molecule from the bulk and subsequent lowering of the rate of exchange. Even if the shorter linker in our case certainly decreases the degree of freedom of the pendent phenylacetamide arms, this behaviour might nicely explain the absence of interspin interactions between the TEMPO units of [Eu(L1)]3+, the two phenylacetamide arms hindering the coordination site.Complex [Eu(L1)]3+ is CEST active in both in its oxidised and reduced forms, with a peak at 46 ppm attributed to the coordinated water. The CEST effect is however much greater in the reduced form (30%) than in the oxidized form (4%) in mixed solvent conditions (that can exhalt slightly the reported values). This difference can be attributed to the acceleration of the relaxation rate due to the paramagnetism of the nitroxide. On the other hand, complex [Eu(L2)]3+ demonstrates almost no CEST activity at 25 °C, but an increase of the temperature to 37 °C results in a 12% effect at 40 ppm of 12%. This indicates that the water exchange is limited in this case.
Altogether, these results suggest that these redox active lanthanide complexes could be interesting probes of redox state. Further studies are in progress to increase the CEST response and the solubility of these probes before they can be interesting for bimodal targeted imaging.
4. Experimental
4.1 Materials and methods
All chemicals were of reagent grade and were used without purification. NMR spectra were recorded on a Bruker AM 400 (1H at 400 MHz) spectrometer. Chemical shifts are quoted relative to tetramethylsilane (TMS). Mass spectra were recorded on an ESI/QTOF Waters Xevo G2-S apparatus. The FTIR spectra were recorded using a Nicolet iS10 spectrometer on crystalline material (ATR mode). Luminescence data were recorded both at room and low temperature using an FLS-1000® (Edinburgh Instruments) equipped with automatic filters to remove the harmonic bands. Quartz cuvette with 1 cm optical path was used. For visible detection a PMT RP928 was used cooled at −20 C and for NIR, a InGAs was used cooled using pelletier. The signals were analysed with the Origin lab Origin Pro software. Lifetimes are averages of 3 independent determinations with a calculated Chi-square <2. Data and lifetimes were also confirmed on a Fluorolog FL3-22 spectrometer from Horiba-Jobin Yvon-Spex equipped with a double grating excitation monochromator and an iHR320 imaging spectrometer. X-band EPR spectra were recorded on a Bruker EMX Plus spectrometer equipped with a Bruker Helium flow cryostat and a dual mode cavity. Electrochemical measurements were carried out using a Biologic SP300 potentiostat. Experiments were performed in a standard three-electrode cell under argon atmosphere. A glassy carbon disc electrode (3 mm diameter), which was polished with 1 mm diamond paste, was used as the working electrode. The auxiliary electrode was a platinum wire, while the reference was an Ag/AgNO3 0.01 M in CH3CN. All the potentials are given vs. the Fc+/Fc redox couple, which was used as standard.4.2 CEST protocols
Z spectra of the EuIII complexes were recorded at 11.7 T (corresponding to a 500 MHz proton Larmor frequency) using a Bruker Avance III spectrometer equipped with a Prodigy cryo probe. The paramagnetic complexes were dissolved at a concentration of 20 mM in H2O![[thin space (1/6-em)]](https://www.rsc.org/images/entities/char_2009.gif) :
:![[thin space (1/6-em)]](https://www.rsc.org/images/entities/char_2009.gif) CD3CN (66
CD3CN (66![[thin space (1/6-em)]](https://www.rsc.org/images/entities/char_2009.gif) :
:![[thin space (1/6-em)]](https://www.rsc.org/images/entities/char_2009.gif) 33 v
33 v![[thin space (1/6-em)]](https://www.rsc.org/images/entities/char_2009.gif) :
:![[thin space (1/6-em)]](https://www.rsc.org/images/entities/char_2009.gif) v) solution. The complexes were analysed in their oxidised form. Spin lattice relaxation times were recorded in order to adjust the relaxation time D1 (<5 × T1) between 4 and 15 s. Z spectra were acquired with an irradiation time of 4 s at 19–25 μT and between 2.4 and 19 μT for saturation power study. The water signal is calibrated to 0 ppm and the spectral irradiation offset within a range of +100 ppm and −100 ppm for EuIII complexes and +100 and −600 ppm for the DyIII signals, between +250 ppm and −100 for YbIII complexes relative to the water resonance. To obtain each spectrum an accumulation of 200 points was collected. The saturation transfer experiments were carried out between 15 and 45 °C by irradiating the EuIII complexes samples at increments of 1 ppm in the frequency range ±100 ppm. The Yb complexes samples at increments of 1 ppm in the frequency range ±100 ppm, then at increments of 5–10 ppm in the frequency range +100 and +250 ppm. The Dy complexes samples at increments of 1 ppm in the frequency range ±100 ppm, then at increments of 5 ppm in the frequency range −100 and −600 ppm. Data were processed manually by integrating the area below the water signal. The percent saturation transfer (ST%) was calculated by the following formula: ST = (1 − I/I0) where I is the intensity of the water signal at a given irradiation frequency and I0 is the maximum intensity of the water signal (off-resonance pre-saturation). After completion of all this sequence, 2 equivalents of sodium ascorbate were added in the solution. The complex is then in the “reduced form”. The sequence is then reapplied following the same protocol.
v) solution. The complexes were analysed in their oxidised form. Spin lattice relaxation times were recorded in order to adjust the relaxation time D1 (<5 × T1) between 4 and 15 s. Z spectra were acquired with an irradiation time of 4 s at 19–25 μT and between 2.4 and 19 μT for saturation power study. The water signal is calibrated to 0 ppm and the spectral irradiation offset within a range of +100 ppm and −100 ppm for EuIII complexes and +100 and −600 ppm for the DyIII signals, between +250 ppm and −100 for YbIII complexes relative to the water resonance. To obtain each spectrum an accumulation of 200 points was collected. The saturation transfer experiments were carried out between 15 and 45 °C by irradiating the EuIII complexes samples at increments of 1 ppm in the frequency range ±100 ppm. The Yb complexes samples at increments of 1 ppm in the frequency range ±100 ppm, then at increments of 5–10 ppm in the frequency range +100 and +250 ppm. The Dy complexes samples at increments of 1 ppm in the frequency range ±100 ppm, then at increments of 5 ppm in the frequency range −100 and −600 ppm. Data were processed manually by integrating the area below the water signal. The percent saturation transfer (ST%) was calculated by the following formula: ST = (1 − I/I0) where I is the intensity of the water signal at a given irradiation frequency and I0 is the maximum intensity of the water signal (off-resonance pre-saturation). After completion of all this sequence, 2 equivalents of sodium ascorbate were added in the solution. The complex is then in the “reduced form”. The sequence is then reapplied following the same protocol.
4.3 Cell cultures
Human melanoma cell line M21 was purchased from ATCC (Manassas, VA, USA). Cells were cultured in DMEM medium supplemented with 10% (v/v) fetal calf serum (FCS) and 2 mM glutamine (Thermo Fisher Scientific, Courtaboeuf, France). Cells were maintained at 37 °C in a 5% CO2-humidified atmosphere and tested to ensure freedom from mycoplasma contamination. All cell lines were used within 5–50 passages of thawing the original stocks.4.4 MTT assay
M21 cells were seeded into 96-well plates (1.5 × 10³ cells per well) in 100 μl of culture medium. After 24 h, cells were treated with the lanthanide(III) complexes at various concentrations. Following incubation for 24 h, 48 h or 72 h, 10 μl of a MTT (3-(4,5-dimethylthiazol-2-yl)-2,5-diphenyltetrazolium bromide) stock solution (Euromedex, Mundolsheim, France) in PBS at 5 mg ml−1 was added in each well and the plates were incubated at 37 °C for 2 h. To solubilize water-insoluble purple formazan crystals, 100 μl of SDS 10%/HCl 0.1% solution was added. After 24 h, absorbance was measured on an ELISA reader (Tecan, Männedorf, Switzerland) at a test wavelength of 570 nm and a reference wavelength of 650 nm.4.5 Synthetic procedures
2OMe and 2CF3 were synthesised according to literature procedures.22,234 was synthesised according to literature procedure.193OMe (1,7-(N-(4-methoxyphenyl)acetamide)-1,4,7,10-tetraazacyclododecane). A solution of glyoxal protected cyclen 1 in 6 mL of MeCN (0.50 g, 2.6 mmol) was added slowly to a solution of 2OMe (1.02 g, 5.2 mmol)22 in MeCN (10 mL). KI (1.71 g, 10.3 mmol, 4 eq.) was then added to the mixture and stirred at room temperature for 6 days. The precipitate was removed by filtration and a white powder was obtained in quantitative yield (100%). This powder was dissolved in MeOH and o-phenylenediamine (o-PDA, 1.1 eq.) was added. The solution was stirred for 1 week under argon, the reaction was filtered and the solvents were removed in vacuo. The red oil was purified using DCVC chromatography (eluent from cyclohexane 100%, cyclohexane/dcm; 50/50; v/v, to MeOH 100%). After evaporation of solvents, it afforded compound 3OMe (1.30 g, quantitative yield) as a pale yellow solid. 1H NMR (400 MHz, MeOD) δ = 7.40 (d, J = 8.7 Hz, 4H), 6.67 (d, J = 8.7 Hz, 4H), 3.70 (s, 6H), 3.62 (s, 4H), 3.35–3.28 (cyclen). 13C NMR (100 MHz, MeOD) δ = 170.7, 157.9, 132.3, 122.9, 114.9, 56.2, 55.9, 51.3, 44.4. FT-IR (solid, cm−1): 3419, 3246, 3046, 2935, 2834, 2766, 1652, 1601, 1537, 1508, 1442, 1414, 1300, 1236, 1025, 830. HRMS (m/z): calcd for C26H38O4N6 [M + H]+: 499.30273; found, 499.30200.
3CF3 (1,7-(N-(4-trifluoromethyl)acetamide)-1,4,7,10-tetraazacyclododecane). 2CF3 (1.71 g, 7.2 mmol) was added to a solution of glyoxal protected cyclen, 1 (0.70 g, 3.6 mmol) in MeCN (50 mL) containing KI (1.20 g, 7.2 mmol, 2 eq.). The mixture was then stirred at room temperature for 6 days. The precipitate was removed by filtration and a white powder was obtained in quantitative yield (100%). This powder was dissolved in MeOH and a solution of PDA (1.1 eq.) was stirred for 5 days under argon. Upon completion, the solvents were removed in vacuo. The red oil was dissolved in THF (40 mL) and stirred overnight. The precipitate was filtrated to afford compound 3CF3 in 72% yield. 1H NMR (400 MHz, MeOD) δ = 7.69 (d, J = 8.5 Hz, 4H), 7.30 (d, J = 8.7 Hz, 4H), 3.71 (s, 4H), 3.31–2.89 (m br, 16H). 13C NMR (100 MHz, MeOD) δ = 171.8, 142.8, 126.9, 120.7, 68.9, 56.4, 51.4, 44.4, 26.5, 24.2. 19F NMR (375 MHz, MeOD) δ = −63.8. FT-IR (solid, cm−1): 3690, 3443, 3342, 3166, 3024, 2920, 2831, 2771, 1686, 1644, 1617, 1583, 1528, 1412, 1322, 1254, 1164, 1104, 1065, 1015, 938, 841. HRMS (m/z): calcd for C26H32F6N6O2 [M + H]+: 575.25637; found, 575.25446.
L1 (1,7-(N-(4-methoxyphenyl)acetamide)-4,10-(N-(2′,2′,6′,6,′-tetramethyl-1′-oxyl-4′-piperidyl)-amide-1,4,7,10-tetraazacyclododecane). The nitroxide derivative 4 (0.525 g, 2.1 mmol)18 was added to a solution of 3OMe (0.637 g, 1 mmol) in MeCN (50 mL) containing K2CO3 (0.552 g, 4 mmol, 4 eq.) and KI (0.664 g, 4 mmol, 4 eq.). The mixture was then stirred at 60 °C for 3 days. The solvents were removed in vacuo and the mixture was purified using DCVC chromatography (eluent gradient from dichloromethane 100%, CH2Cl2/MeOH; 50/50; v/v). After evaporation of solvents, it afforded L1 as an orange solid (0.267 g, 29%). Reduction with sodium ascorbate was used to characterize the ligand by NMR. 1H NMR (400 MHz, CDCl3): δ = 7.70 (s, 2H), 7.53 (s, 2H), 8.28), 6.82 (s, 2H), 6.77 (s, 2H), 3.73 (m, 8H), 3.65 (s, 4H), 3.24 (s, 4H), 3.07 (s, 4H), 2.87 (s, 4H), 2.81 (s, 4H), 1.30–1.0 (m, 32H TEMPOH). 13C NMR (125 MHz, CDCl3): δ = 206.5, 157.4, 70.1, 62.7, 58.0, 53.2, 31.4, 30.5, 29.2, 22.2, 18.1, 13.6, 13.4, 0.47. FT-IR (solid, cm−1): 3406, 3229, 3085, 2974, 2927, 2861, 1615, 1574, 1504, 1462, 1363, 1323, 1239, 1177, 1084, 1025, 959, 833. HRMS (m/z): calcd for C48H77O8N10 [M]+, 921.59204. Found, 921.59137. Elem. anal. calcd for C48H85N10O12I (L1, I− + 4H2O): C, 51.4104; H, 7.6561; N, 12.4941. Found: C, 51.34; H, 7.59; N, 12.42.
L2 (1,7-(N-(4-trifluoromethylphenyl)acetamide)-4,10-(N-(2′,2′,6′,6,′-tetramethyl-1′-oxyl-4′-piperidyl)-amide-1,4,7,10-tetraazacyclododecane). The nitroxide derivative 4 (0.275 g, 1.1 mmol, 2 eq.) REF was added to a solution of 3CF3 (0.306 g, 0.56 mmol) in MeCN (30 mL) containing K2CO3 (0.309 g, 2.2 mmol, 4 eq.) and KI (0.186 g, 1.1 mmol, 2 eq.). The mixture was then stirred at 70 °C for 13 days, filtered on celite and the solvents were removed in vacuo. The mixture was purified using DCVC chromatography (eluent from DCM 100% to DCM/MeOH; 50/50; v/v, to EtOH/NH4OH; 50/50; v/v). After evaporation of solvents, it afforded compound L2 (0.211 g, 38%) as an orange solid. Reduction with sodium ascorbate was used to characterize the ligand. 1H NMR (400 MHz, MeOD) δ = 7.83 (d, J = 8.6 Hz, 4H), 7.56 (d, J = 8.6 Hz, 4H), 4.14 (tt, J = 12.3 Hz, J = 3.7 Hz, 2H), 1.79 (d, J = 12.5 Hz, 4H), 1.44 (t, J = 12.2 Hz, 4H), 1.17 (d, J = 4.0 Hz, 24H). 13C NMR (100 MHz, CDCl3) δ = 179.3, 163.8, 126.9, 120.7, 74.3, 73.5, 64.9, 59.9, 55.6, 46.1, 45.7, 42.7, 32.8, 8.0. 19F NMR (375 MHz, MeOD) δ = −63.6. FT-IR (solid, cm−1): 3435, 3211, 3049, 2981, 2941, 2358, 1684, 1602, 1539, 1452, 1322, 1234, 1165, 1112, 1067, 848. HRMS (m/z): calcd for C48H71O6N10F6 [M]+: 997.54568; found, 997.54512.
4.6 General procedure for the synthesis of the complexes
To a solution of the ligand (0.06 mmol) in a mixture of 1,4-dioxane and water 1![[thin space (1/6-em)]](https://www.rsc.org/images/entities/char_2009.gif) :
:![[thin space (1/6-em)]](https://www.rsc.org/images/entities/char_2009.gif) 1 (10 mL) was added 0.06 mmol of the metal (1 eq.) under its triflate salt (except for [Eu(L1)]3+, nitrate salt). The solution was stirred and heated at 50 °C for 1 day. The solvents were evaporated under reduced pressure and the residue was solubilized in minimum of methanol, precipitated in ether and centrifuged.
1 (10 mL) was added 0.06 mmol of the metal (1 eq.) under its triflate salt (except for [Eu(L1)]3+, nitrate salt). The solution was stirred and heated at 50 °C for 1 day. The solvents were evaporated under reduced pressure and the residue was solubilized in minimum of methanol, precipitated in ether and centrifuged.
Conflicts of interest
There are no conflicts to declare.Acknowledgements
The authors thank the French National Research Agency in the framework of the “Investissements d'avenir” program (ANR-15-IDEX-02), Labex ARCANE and CBH-EUR-GS (ANR-17-EURE-0003) and the French National Agency for Research, program Co-Lantha (ANR-17-CE07-0034) for financial support. This work was performed under the auspices of the COST Action AC15209, EURELAX. The ICMG Platform (FR 2607) is acknowledged for the analytical support.References
- S. M. Pinto, V. Tomé, M. J. F. Calvete, M. M. C. A. Castro, É. Tóth and C. F. G. C. Geraldes, Coord. Chem. Rev., 2019, 390, 1–31 CrossRef CAS.
- K. L. Eales, K. E. R. Hollinshead and D. A. Tennant, Oncogenesis, 2016, 5, e190 CrossRef CAS PubMed.
- M. W. Dewhirst and S. R. Birer, Cancer Res., 2016, 76, 769 CrossRef CAS PubMed.
- J. P. B. Connor, J. K. R. Boult, Y. Jamin, M. Babur, K. G. Finegan, K. J. Williams, R. A. Little, A. Jackson, G. J. M. Parker, A. R. Reynolds, J. C. Waterton and S. P. Robinson, Cancer Res., 2016, 76, 787 CrossRef PubMed.
- J.-T. Hou, M. Zhang, Y. Liu, X. Ma, R. Duan, X. Cao, F. Yuan, Y.-X. Liao, S. Wang and W. Xiu Ren, Coord. Chem. Rev., 2020, 421, 213457 CrossRef CAS.
- S. Lacerda and É. Tóth, ChemMedChem, 2017, 12, 883–894 CrossRef CAS PubMed.
- Q. Meng, M. Wu, Z. Shang, Z. Zhang and R. Zhang, Coord. Chem. Rev., 2022, 457, 214398 CrossRef CAS.
- A. C. Harnden, D. Parker and N. J. Rogers, Coord. Chem. Rev., 2019, 383, 30–42 CrossRef CAS.
- D. Mouchel Dit Leguerrier, R. Barré, J. K. Molloy and F. Thomas, Coord. Chem. Rev., 2021, 446, 214133 CrossRef CAS.
- J. K. Molloy, L. Fedele, O. Jarjayes, C. Philouze, D. Imbert and F. Thomas, Inorg. Chim. Acta, 2018, 483, 609–617 CrossRef CAS.
- J. K. Molloy, O. Jarjayes, C. Philouze, L. Fedele, D. Imbert and F. Thomas, Chem. Commun., 2017, 53, 605–608 RSC.
- R. Barré, D. Mouchel dit Leguerrier, L. Fedele, D. Imbert, J. K. Molloy and F. Thomas, Chem. Commun., 2020, 56, 435–438 RSC.
- B. Wu, G. Warnock, M. Zaiss, C. Lin, M. Chen, Z. Zhou, L. Mu, D. Nanz, R. Tuura and G. Delso, EJNMMI Phys., 2016, 3, 19–19 CrossRef CAS PubMed.
- P. C. M. van Zijl and N. N. Yadav, Magn. Reson. Med., 2011, 65, 927–948 CrossRef CAS PubMed.
- G. Liu, X. Song, K. W. Y. Chan and M. T. McMahon, NMR Biomed., 2013, 26, 810–828 CrossRef CAS PubMed.
- K. J. Cai, H. N. Xu, A. Singh, L. Moon, M. Haris, R. Reddy and L. Z. Li, Mol. Imaging Biol., 2014, 16, 670–679 CrossRef PubMed.
- F. Kogan, H. Hariharan and R. Reddy, Curr. Radiol. Rep., 2013, 1, 102–114 CrossRef PubMed.
- D. Mouchel Dit Leguerrier, R. Barré, Q. Ruet, D. Imbert, C. Philouze, P. H. Fries, V. Martel-Frachet, J. K. Molloy and F. Thomas, Dalton Trans., 2021, 50, 10826–10837 RSC.
- Q. N. Do, J. S. Ratnakar, Z. Kovács and A. D. Sherry, ChemMedChem, 2014, 9, 1116–1129 CrossRef CAS PubMed.
- S. J. Ratnakar, T. C. Soesbe, L. L. Lumata, Q. N. Do, S. Viswanathan, C.-Y. Lin, A. D. Sherry and Z. Kovacs, J. Am. Chem. Soc., 2013, 135, 14904–14907 CrossRef CAS PubMed.
- F. Oukhatar, M. Beyler and R. Tripier, Tetrahedron, 2015, 71, 3857–3862 CrossRef CAS.
- M. Milne, M. Lewis, N. McVicar, M. Suchy, R. Bartha and R. H. E. Hudson, RSC Adv., 2014, 4, 1666–1674 RSC.
- L. Ma, C. Xie, Y. Ma, J. Liu, M. Xiang, X. Ye, H. Zheng, Z. Chen, Q. Xu, T. Chen, J. Chen, J. Yang, N. Qiu, G. Wang, X. Liang, A. Peng, S. Yang, Y. Wei and L. Chen, J. Med. Chem., 2011, 54, 2060–2068 CrossRef CAS PubMed.
- R. Pujales-Paradela, T. Savić, P. Pérez-Lourido, D. Esteban-Gómez, G. Angelovski, M. Botta and C. Platas-Iglesias, Inorg. Chem., 2019, 58, 7571–7583 CrossRef CAS PubMed.
- R. Pujales-Paradela, T. Savić, D. Esteban-Gómez, G. Angelovski, F. Carniato, M. Botta and C. Platas-Iglesias, Chem. – Eur. J., 2019, 25, 4782–4792 CrossRef CAS PubMed.
- K. Binnemans, Chem. Rev., 2009, 109, 4283–4374 CrossRef CAS PubMed.
- R. M. Supkowski and W. D. Horrocks, Inorg. Chim. Acta, 2002, 340, 44–48 CrossRef CAS.
- A. Beeby, I. M. Clarkson, R. S. Dickins, S. Faulkner, D. Parker, L. Royle, A. S. de Sousa, J. A. Gareth Williams and M. Woods, J. Chem. Soc., Perkin Trans. 2, 1999, 493–504, 10.1039/A808692C.
- G. Ionita, V. Meltzer, E. Pincu and V. Chechik, Org. Biomol. Chem., 2007, 5, 1910–1914 RSC.
- L. A. Basal, M. D. Bailey, J. Romero, M. M. Ali, L. Kurenbekova, J. Yustein, R. G. Pautler and M. J. Allen, Chem. Sci., 2017, 8, 8345–8350 RSC.
- T. Gambino, L. Valencia, P. Pérez-Lourido, D. Esteban-Gómez, M. Zaiss, C. Platas-Iglesias and G. Angelovski, Inorg. Chem. Front., 2020, 7, 2274–2286 RSC.
- E. Vinogradov, A. D. Sherry and R. E. Lenkinski, J. Magn. Reson., 2013, 229, 155–172 CrossRef CAS PubMed.
- S. J. Ratnakar, S. Viswanathan, Z. Kovacs, A. K. Jindal, K. N. Green and A. D. Sherry, J. Am. Chem. Soc., 2012, 134, 5798–5800 CrossRef CAS PubMed.
- R. Wu, G. Xiao, I. Y. Zhou, C. Ran and P. Z. Sun, NMR Biomed., 2015, 28, 376–383 CrossRef CAS PubMed.
- S. A. A. S. Subasinghe, J. Romero, C. L. Ward, M. D. Bailey, D. R. Zehner, P. J. Mehta, F. Carniato, M. Botta, J. T. Yustein, R. G. Pautler and M. J. Allen, Chem. Commun., 2021, 57, 1770 RSC.
- A. C. L. Opina, Y. Wu, P. Zhao, G. Kiefer and A. D. Sherry, Contrast Media Mol. Imaging, 2011, 6, 459–464 CrossRef CAS PubMed.
- R. Barré, D. Mouchel dit Leguerrier, Q. Ruet, L. Fedele, D. Imbert, V. Martel-Frachet, P. H. Fries, J. K. Molloy and F. Thomas, Chem. – Asian J., 2022, e202200544 Search PubMed.
- D. Kovacs, E. Matthieu, S. R. Kiraev, J. A. L. Wells, E. Demeyere, A. SIpos and K. E. Borbas, J. Am. Chem. Soc., 2020, 142(30), 13190–13200 CrossRef CAS PubMed.
Footnote |
| † Electronic supplementary information (ESI) available: CV curves, EPR, CEST and luminescence spectra. See DOI: https://doi.org/10.1039/d2dt02776c |
| This journal is © The Royal Society of Chemistry 2022 |

