 Open Access Article
A review on the use of DFT for the prediction of the properties of nanomaterials
Priyanka Makkar and
Narendra Nath Ghosh *
*
Nano-materials Lab, Department of Chemistry, Birla Institute of Technology and Science, Pilani K K Birla Goa Campus, Goa 403726, India. E-mail: naren70@yahoo.com; Fax: +91 832 25570339; Tel: +91 832 2580318
First published on 17th August 2021
Abstract
Nanostructured materials have gained immense attraction because of their extraordinary properties compared to the bulk materials to be used in a plethora of applications in myriad fields. In this review article, we have discussed how the Density Functional Theory (DFT) calculation can be used to explain some of the properties of nanomaterials. With some specific examples here, it has been shown that how closely the different properties of nanomaterials (such as optical, optoelectronics, catalytic and magnetic) predicted by DFT calculations match well with the experimentally determined values. Some examples were discussed in detail to inspire the experimental scientists to conduct DFT-based calculations along with the experiments to derive a better understanding of the experimentally obtained results as well as to predict the properties of the nanomaterial. We have pointed out the challenges associated with DFT, and potential future perspectives of this new exciting field.
1. Introduction
Currently, a significant number of scientists and technologists from renowned companies, R&D organizations, and academic research laboratories are dedicating an enormous amount of effort in developing nanotechnology by exploiting the range of novel properties of nanostructured materials. The applications of nanomaterials include the fields of information storage technology, semiconductors, microelectronics, aerospace technology, defense, biomedicine, biomedical imaging, pharmaceuticals, catalysis, petrochemicals, clean-energy sectors, new-energy resources (e.g., fuel cells, lithium-ion batteries), photonics, glass, ceramic industries, etc. Nanomaterials have gained immense prominence owing to their tunable properties (such as physical, chemical, biological, etc.) with enhanced performance over their bulk counterparts, mainly arising from their relatively small size, surface effect, and quantum tunneling effect. As a classical example, the change of the photoluminescence color of CdSe (quantum dot) from red to blue with the reduction of its diameter from 6 to 2 nm, can be explained with the help of quantum confinement effects. The size-dependent changes in the Density of States (DOS) of the nanocrystalline CdSe and the separation of energy between them, which are revealed by the increase of the bandgap (Eg) (or HOMO–LUMO energy gap) and the appearance of discrete energy levels near the band edges with decreasing dimensions (Fig. 1) are the main cause of this property of CdSe nanoparticles.1 This quantum confinement effect provides an insight into the origin of the optoelectronic properties of the semiconducting nanoparticles and also suggested how to tune their optical and opto-electronic properties by simply manipulating their size.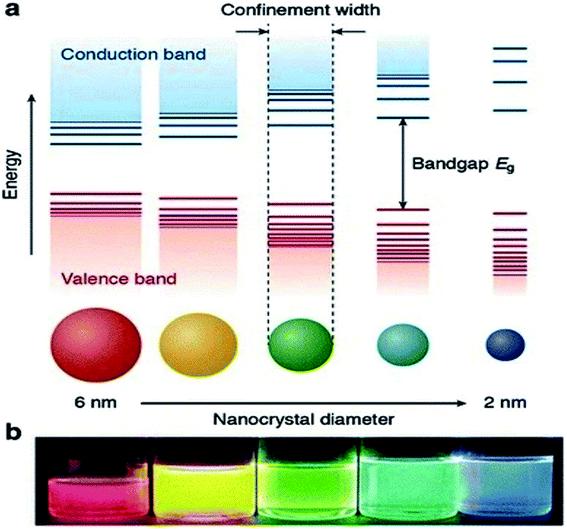 | ||
| Fig. 1 (a) Schematic representation of the quantum confinement effects: the bandgap (or HOMO–LUMO gap) of the semiconductor nanocrystal increases with decreasing size, while discrete energy levels arise at the band-edges. The energy separation between the band-edge levels also increases with decreasing size. (b) Photograph of five colloidal dispersions of CdSe QDs with different sizes, under excitation with a UV-lamp in the dark. The color of the photoluminescence changes from red to blue as the QD diameter is reduced from 6 to 2 nm. This figure has been reproduced from ref. 1 with permission from Springer Nature, copyright 2016. | ||
Therefore, the ongoing quest is to develop proper methodologies which will provide an extensive understanding of the structure of the nanomaterials at their electronic level. This will help in designing the materials with desired properties by controlling their size and structure. The advancement of sophisticated computer programs with faster computing capability and material simulation methodologies have emerged as important tools for researchers owing to their ability to model the size-dependent properties and behaviors of the nanomaterials with immense confidence.2 Therefore, nowadays, the theoretical and computational study of nanomaterials has gained immense importance. The computational methods alone, or in conjunction with experimental techniques, help in explaining and predicting the structure and properties of nanomaterials as well as designing new materials with tailor-made properties. Modern density functional theory (DFT), which is based on the first principles, is capable of predicting material properties and has now become an indispensable modeling toolbox of scientists of myriad fields. Due to its computational friendly behavior, DFT has been immersed as a popular methodology to understand the relevant properties of the engineered nanomaterials. Recognizing the importance and recent extensive development in this field, ACS Appl. Nano Mater. has recently (July 2020) dedicated a “virtual issue” on enhancing technological applications through DFT modeling of nanomaterials.3 In this review, we have reviewed the recent development of DFT calculations for explaining and predicting the optical, optoelectronic properties, catalytic properties, and magnetic properties of nanomaterials.
2. Overview of DFT
The fundamental of the first-principles method lies in quantum mechanics, which expresses the conduction of electrons and atomic nuclei in any situation.4 The Schrödinger equation (eqn (1)) is the primary equation in this calculation. However, the limitation associated with it is the complex nature of Schrödinger equation and high computational cost for the system having more than one electron. In many-electron systems, the interaction of the electrons with each other leads to the many-body problem.| ĤΨ = EΨ | (1) |
In 1964, Hohenberg and Kohn have postulated two theorems that served as fundamentals of DFT.5 The first theorem states that in a system having n interacting electrons, the many-body ground state wavefunction (Ψn…rn) of all electrons is a unique function of the electronic density (ρ(r)). This could be presented as eqn (2).
 | (2) |
According to the first theorem, the Hohenberg–Kohn equation can be expressed as
 | (3) |
![[T with combining macron]](https://www.rsc.org/images/entities/i_char_0054_0304.gif) is the sum of electronic kinetic energy, ν(r) is the function for nuclear potential energy for an electron at point r and the overbars denote the average variables. The second theory describes a minimum principle for the density and proposed that the ground state energy of any trial electron density cannot be smaller than the true ground system. This can be expressed as eqn (4):
is the sum of electronic kinetic energy, ν(r) is the function for nuclear potential energy for an electron at point r and the overbars denote the average variables. The second theory describes a minimum principle for the density and proposed that the ground state energy of any trial electron density cannot be smaller than the true ground system. This can be expressed as eqn (4):| Eν|ρtr| = Eν ≥ E0 = [ρ0] | (4) |
Kohn–Sham method offers an approach to derive the information about the energy, structure, and properties of atoms and molecules by introducing a fictitious supporting system to resemble the true many-electron system. According to the Kohn–Sham method, the total energy [Eν[ρ]] can be calculated as per eqn (5):
 | (5) |
EXC is the exchange–correlation (XC) energy having correlation energy, exchange energy, coulombic correlation energy, and self-interaction correction.8 DFT approach has been widely used to calculate the electronic structure properties of molecules and nanostructured materials. Several review papers on DFT are available in the literature which discusses in detail DFT calculations, several approximations, and their applications in a variety of systems.9,10 Therefore, here we are not discussing the DFT method in detail. We are briefly mentioning some of the important approximations which are generally used during DFT calculations to obtain better results. One of the examples is that it has been observed that conventional DFT calculations based on XC functionals to determine the band gap value of the semiconductors generally produce underestimated value compared with the experimentally derived band gap value. To improve the calculation several revised approximations, e.g., DFT+U, hybrid functional (SX, PBE0, HSE), GW approximation, DMFT etc. have been developed.
2.1. Exchange–correlation functional
Local density approximation (LDA), generalized gradient approximation (GGA), meta-GGA, hybrid functional are some of the approximations. The approximation for LDA is that for the charge density (ELDAXC) behaves locally similar to heterogeneous electron cloud (ehom) and can be presented as:5| ELDAXC[n(r)] = ∫n(r)ehomXC[n(r)]dr | (6) |
Though LDA calculates the electronic properties of some of the systems with reasonably close accuracy but in the case of certain materials especially with strongly correlated structures LDA treats their electronic structures incorrectly because of their localized character.
To improve the accuracy of LDA another approximation known as GGA has been proposed, which uses two variables, electron density and its gradient can be expressed as:
EGGAXC[n(r) = ∫n(r)ehomXC[n(r), ![[V with combining macron]](https://www.rsc.org/images/entities/i_char_0056_0304.gif) n(r)dr n(r)dr
| (7) |
Several corrected functionals (such as PBE, Perdew, Burke, and Ernzerhof for solid (PBE sol), Perdew–Wang 1991 (PW91)) are also used in GGA for the contribution of exchange and correlation part.11,12
2.2. Hubbard-U scheme
To improve the shortcomings associated with LDA and GGA, Hubbard-U correction has been widely adopted because of its simplicity, reliability of results, and economic viability for practical applications.Anisimov et al. have introduced the Hubbard-U method which deals with on-site Coulomb repulsion energy (U) into XC of LDA and GGA and is referred to as LDA+U or GGA+U respectively (eqn (8)):13
| ELDA+U[n(r) = ELDA [n(r)] + EU[(nr)] − Edc | (8) |
Several DFT codes are available to the materials science community. Some of them are proprietary, whereas others are accessible through general public licenses. The codes are based on different choices of basis sets, potentials, exchange–correlation functionals, and algorithms for solving the Schrödinger equation. A summary of many existing codes is given in Table 1.57,58
| S. no | Codes | Reference |
|---|---|---|
| 1 | ABINIT | 14–16 |
| 2 | CASTEP | 4 and 17 |
| 3 | CPMD | 18–20 |
| 4 | VASP | 21–24 |
| 5 | SIESTA | 25 |
| 6 | CRYSTAL | 26 |
| 7 | Gaussian | 27 |
| 8 | WEIN2K | 28 |
| 9 | Quantum Espresso | 29 and 30 |
| 10 | CP2K | 31–35 |
| 11 | ONETEP | 36 |
| 12 | BigDFT | 37 |
| 13 | GAMESS | 38 and 39 |
| 14 | Molpro | 40 |
| 15 | Turbomole | 41 |
| 16 | FLEUR | 42 |
| 17 | GPAW | 43 and 44 |
| 18 | Q-Chem | 45 |
| 19 | Exciting | 46 |
| 20 | Octopus | 47–49 |
| 21 | Dacapo | 50 |
| 22 | PWscf | 51 |
| 23 | Quickstep | 52 |
| 24 | QPMD-FLAPW | 53 |
| 25 | Dmol3 | 54 |
| 26 | ADF | 55 |
| 27 | FHI-aims | 56 |
3. Use of DFT for optical and opto-electronic properties of nanomaterials
Nanomaterials exhibit a variety of infrequent and fascinating optical properties which are significantly dissimilar from that of the same bulk material. The optical response of a nanomaterial depends on the nanoscale size, composition, arrangement of particles, etc. Scattering or absorption happens when incident light interacts with a nanoparticle. The diameter of the nanoparticles plays a critical role in the amount of scattering or absorption of light. When the particle diameter is less than 20 nm, almost all of the extinction occurs due to absorption, whereas in the case of sizes above 100 nm scattering is largely responsible for the extinction. By tailoring the dimension of the nanoparticles, the amount of scattering and absorption can be manipulated. The optical properties of metal nanoparticles (e.g., Ag, Au, Al, etc.) can be explained by the surface plasmon phenomena, where the free electrons in the material nanoparticles resonate at a frequency that matches the wavelength of incident light. In this condition, the nanoparticles strongly absorb or scatter the light exhibiting a strongly colored particle. With the change of size and shape the peak resonance wavelength can be shifted across the visible and infrared regions of the spectrum. Semiconductor nanoparticle quantum dots absorb and emit light at certain wavelengths which can be categorized as quantum confinement effects. The emission wavelengths of quantum dots can be changed from the UV, visible, or near-infrared region by varying their size and composition. In this section, we have discussed the application of DFT calculations with necessary modifications to explain and predict the optical and optoelectronic properties of three important types of nanoparticles: (i) metal nanoparticles, (ii) semiconductor nanoparticles, and (iii) graphene (or rGO) based nanocomposites.Generally, the optical properties of large nanoparticles can be explained by solving the classical Maxwell equations using Mie theory, discrete dipole approximation (DDA), or the finite difference time domain method.61,62 However, several authors have reported that when the sizes of the particles are below 5 to 10 nm or when the gap between two nanoparticles is approximately in the sub-nanometer scale, the quantum mechanical effects become dominant and the classical treatment of these nanoparticles may not be effective.63–65 For various types of nanoclusters, time-dependent density functional theory (TDDFT) has been successfully employed.66
To calculate the optical properties of Ag nanorods Alkan et al. have investigated the performance of time-dependent density functional tight-binding (TD-DFTB).67 They have compared the absorption spectra obtained from TD-DFT and TD-DFTB calculations and showed that the results obtained from these two methods agreed well (Fig. 2). The positions of the peak maxima for both longitudinal and transverse peaks were predicted at lower energies by TD-DFTB and TD-DFT level theory and compared the results. With increasing size from Ag19 to Ag67 systems, the longitudinal peaks were red-shifted by 1.52 eV when calculated by TD-DFT level, whereas TD-DFIB calculations resulted in the red-shifting of 0.93 eV. In principle, DFTB and TD-DFTB methods are also applicable to other plasmonic systems, such as nanoclusters of Ag, Au nanoparticles, or ligand capped nanoclusters. However, such studies require in-depth understanding of the existing as well as possible new parameter sets of the systems.
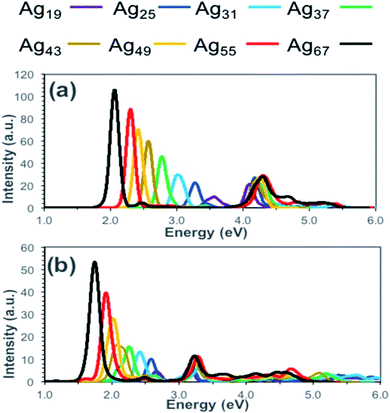 | ||
| Fig. 2 Calculated absorption spectra for silver nanorods (Ag19, Ag25, Ag31, Ag37, Ag43, Ag49, Ag55, and Ag67) at the (a) TD-DFT and (b) TD-DFTB levels of theory. This figure is reproduced from ref. 67 with permission from the American Chemical Society, copyright 2018. | ||
Gyun-Tack Bae et al. studied the time-dependent density functional theory studies of optical properties of Au nanoparticles: octahedra, truncated octahedra, and icosahedra.68 TDDFT was used to explain the change of optical properties with changing size and shape of Ag, Au nanoparticles including a series of Au nanoparticles, different types of Au nanoparticles, Au clusters of 20–171 atoms, Au nanoclusters having 1414 atoms, thiolate-stabilized Au nanoclusters, etc.69–74,76–85
Stener et al. have investigated the optical excitations of Au64+, Au444+, and Au1462+ at the scalar relativistic TDDFT level.75 Liao et al. have conducted the DFT/TDDFT calculations for a series of Agn and Aun nanorod clusters (where n = 12–120). TDDFT calculations for the optical properties of cubic, icosahedral, and cuboctahedral Au clusters72 and alloyed Ag–Au octahedral nanoclusters have also been reported.70
By using TDDFT Bae et al. have investigated how the absorption spectra of Aun change with the variation of size and shape where n varied from 6 to 85 and shapes were octahedral, icosahedral, and truncated octahedral. For optimization, BP86/DZ.4f level of theory, and to calculate the excitation energy, LB94 functional was employed using the Amsterdam density functional code.86 Fig. 3 illustrates the optical absorption spectra of Au nanoparticles having different shapes using the LB94 functional which displays the red shifting of the peak location maxima with increasing cluster size for the octahedral and truncated octahedral shaped clusters, and for the icosahedral clusters a blue shifting with the increase of the size of the cluster.68 A significant agreement was observed between the results obtained from experiment and theoretical studies.
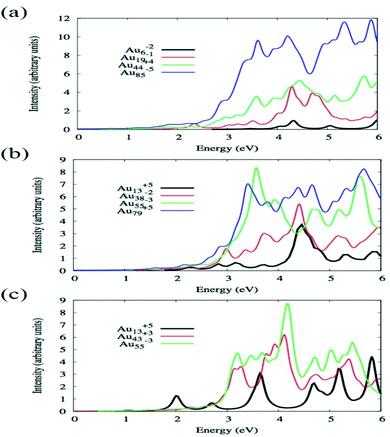 | ||
| Fig. 3 Size comparisons of optical absorption spectra for octahedral (a), truncated octahedral (b), and icosahedral (c) gold nanoparticles using the LB94 functional. This figure is reproduced from ref. 68 with permission from the American Chemical Society, copyright 2015. | ||
DFT method has frequently been used to estimate the bandgap energy (Eg) of the semiconductor materials. Generally, it has been observed that the conventional DFT method, which is based on exchange–correlation (XC) functionals of LDA and GGA, yields undervalued Eg. One of the reasons for this error is associated with a larger electronic d and f orbital system. To achieve better values, several approximations (e.g., DFT+U, hybrid functional (SX, B3LYP, PBE0, and HSE), GW approximation, DMFT, etc.) have been proposed. Moreover, to calculate interface, defects, and surfaces properties these corrected XC functionals were also used.87,88 Though the hybrid functionals and GW produce a more precise value of Eg but high computational cost is also associated with them.89 In many cases, the use of semiempirical LDA+U functional resulted in a more accurate value of Eg and electronic localization of 3d orbitals.90,91 The use of semiempirical DFT+U functionals to determine the Eg values of different semiconductors has been reported in the works of literature. The advantages these techniques offer including (i) relatively low computational cost, and (ii) the suitability of the DFT+U technique to complex or large systems with less difficulty.92–94
Recently, Harun et al. have reviewed the DFT calculations which have been used to estimate the bandgap and electronic properties of ZnO.5 The conventional DFT calculations estimated the value of the energy bandgap (∼0.7–1.0 eV) of ZnO, which is much less than the energy gap value (∼3.4 eV) obtained from the experimental results such as UV-VIS spectroscopy and X-ray spectroscopy. Table 2 shows the comparison of Eg value for ZnO among the theoretically calculated values using different XC functionals and experimental values obtained from spectroscopy measurement. The conventional XC functionals of LDA and GGA PBE calculations produce small value of Eg with ∼76% error. The binding energy in d-state is underestimated by LDA and GGA, which causes over hybridization with the anion p valence states.57
A strong p–d coupling resulted in an Eg with a lower value. However, the hybrid functionals, such as PBE0, HSE06, SX, and GW, estimate more accurate Eg of ZnO. The energy band structure and density of states (DOS) provide an idea about the electronic behavior of ZnO. The energy band structure of ZnO shows a direct-type band gap at the Brillouin zone path G–G57,100,101 or the center of the Γ k-point grid (Fig. 4).5,57,102,103 Slassi et al. have obtained an improved Eg of ZnO (2.7 eV) by employing GGA functional with TB-mBJ (Tran–Blaha modified Becke–Johnson) approximation.104 Luo et al. have utilized a hybrid functional GGA-PBE-HSE06 which produced Eg = 2.49 eV.105 Though these calculations yield improved Eg values of ZnO, but still they are significantly less than the typical experimentally obtained Eg = 3.30 eV.
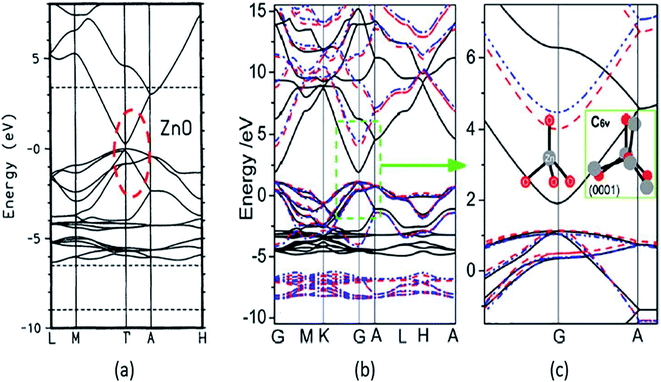 | ||
| Fig. 4 Calculated energy band structure using different XC functionals: (a) LDA with red circle showing the underestimated band gap, reproduced with permission,102 copyright 1995 American Physical Society; (b) GGA and GGA+U, and (c) the enlarged energy gap. This figure is reproduced from ref. 57 with permission from American Chemical Society, copyright 2013. | ||
Recently, several authors have determined the structural and electronic properties of ZnO with the application of Ud,Zn and Up,O in LDA+U, GGA-PBE+U, and GGAPBESol+U (Fig. 5), and achieved much improved Eg value of ZnO, and these values are close to the experimentally obtained value.106–108
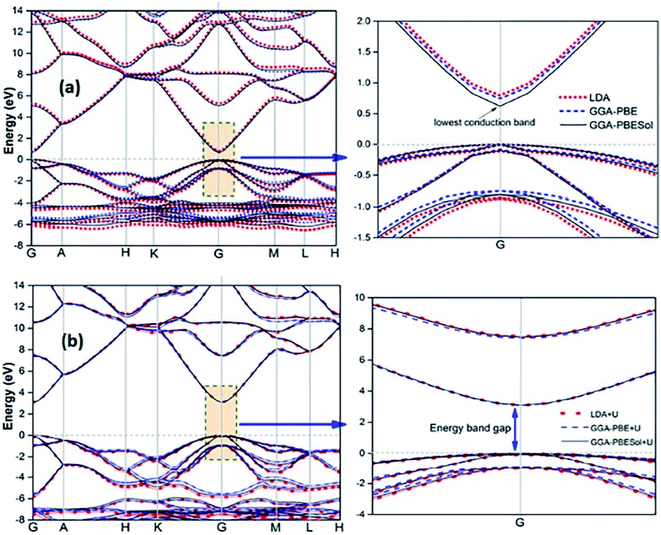 | ||
| Fig. 5 Calculated energy band structure of synthesized ZnO using different functionals: (a) LDA, GGA-PBE, and GGA-PBE Sol and (b) LDA+U, GGA-PBE+U, and GGA-PBESol+U. This figure is reproduced from ref. 106 with permission from IOPscience, copyright 2017. | ||
To provide an idea of how DFT calculations can be utilized to estimate the electronic structures and electronic properties of the graphene-based nanocomposites, now we will discuss the DFT calculations of BiFeO3–graphene nanocomposite as an example. We have investigated in detail the electronic structures of BiFeO3 (BFO), graphene, and BFO–graphene nanocomposites by using DFT calculations, with the GGA exchange–correlation parametrized by PBE.109 To address the issue related to the underestimated Eg values for semiconductors by GGA approach, the final electronic properties of the structures were calculated by performing a single-point energy calculation using a screened hybrid functional HSE06, which was optimized using PBE. As the standard PBE functional does not well define the weak interactions, we have adopted the DFT-D2 approach and performed calculations considering spin polarization. The energy calculations after geometry optimization were performed for three superlattice systems: (i) BiFeO3 with rhombohedral distorted perovskite-type structure with space group R3c, (ii) graphene superlattices and (iii) BFO–graphene nanocomposite. The relaxed superlattice structures of graphene and BFO were closely similar to the reported results and a lattice distortion (∼3.4% expansion in the z-direction) after relaxation occurred for the BFO–graphene superlattice, which suggested a strong interaction exists between graphene and BFO. This was also supported by having a binding energy of −5.4 eV. Fig. 6 and 7 display the band structure and PDOS of graphene superlattice, BFO, and BFO–rGO nanocomposite and demonstrate the interaction between graphene superlattices and BiFeO3 slab at their interface in the composite.109 These calculations also showed that (i) the zero Eg nature of graphene, and (ii) pure BiFeO3 possesses a value of 2.45 eV for majority spin Eg and 1.6 eV for minority spin Eg and this majority spin Eg value is close to the experimentally obtained optical Eg of 2.5 and 2.74 eV as reported by several researchers.110–114
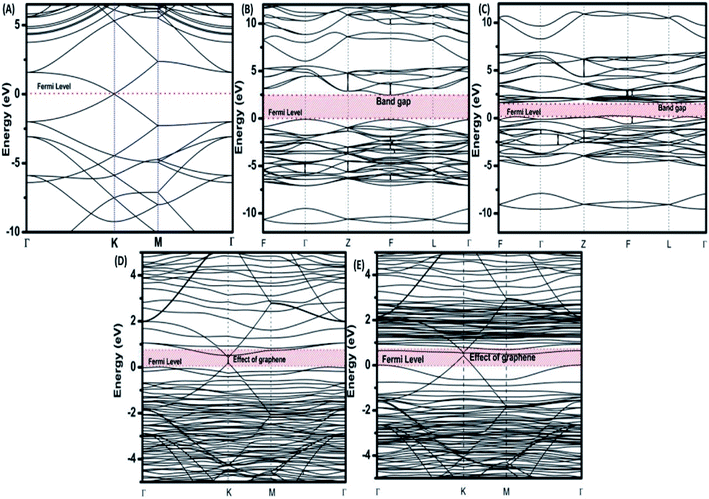 | ||
| Fig. 6 Electronic band structures of (A) superlattices, (B) BiFeO3 superlattices for spin up, (C) BiFeO3 superlattices for spin down, (D) BiFeO3–graphene superlattices for spin-up, and (E) BiFeO3–graphene superlattices for spin-down. This figure is reproduced from ref. 109 with permission from the American Chemical Society, copyright 2017. | ||
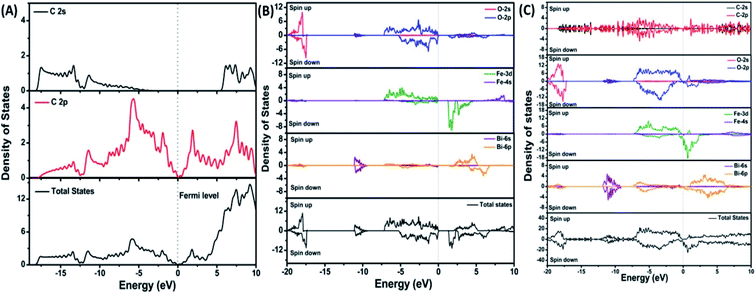 | ||
| Fig. 7 Projected density of states of (A) graphene, (B) BiFeO3, and (C) BFO–graphene superlattices. The Fermi level is referenced to zero energy, as indicated by the dotted line. This figure is reproduced from ref. 109 with permission from the American Chemical Society, copyright 2017. | ||
The BFO–graphene superlattices band structure exhibited the appearance of some new bands near the Fermi level compared to the BiFeO3 superlattice, which suggested the influence of graphene on the electronic properties of BFO–graphene superlattices.
DOS of BFO–graphene superlattices (Fig. 7) displayed that major contributors to the valence band came from the predominant localization of electronic charge around O 2p and Fe 3d states, and also the partial contribution from C 2p of graphene. Due to this orbital overlap, the electronic structure of graphene changed in the BFO–graphene composite. Bi 6p and C 2p states contributed to the conduction band. Several new states just above the Fermi level originated due to the hybrid interactions between the C 2p states of graphene and O 2p and Fe 3d orbitals.
The electronic total charge density contour plot and the difference charge density plot (Fig. 8) for the interface between graphene and BFO slab showed the existence of the electron orbital overlap between graphene and BFO in the interface and these interfacial interactions resulted in the charge depletion on those C atoms which are close to O atoms, and charge accumulation on the C atoms that are close to Fe atoms.
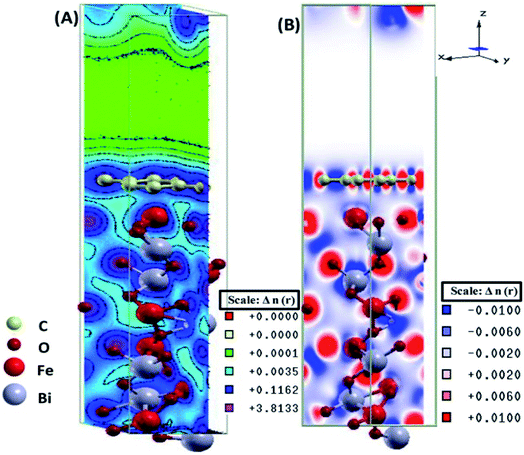 | ||
| Fig. 8 (A) Electronic total charge density and (B) difference charge density plots of the BFO–graphene composite interface. This figure is reproduced from ref. 109 with permission from the American Chemical Society, copyright 2017. | ||
Sang et al. have calculated the layer-dependent electronic and optical properties of layered tellurene by using the DFT calculations incorporating self-energy corrections and excitonic effects.115 To investigate the effect of Cu introduction in the structural and optical properties of SnO2 system, Chetri et al. have carried out DFT calculations and compared the theoretical and experimentally obtained results.116
4. DFT calculations for catalytic properties of nanostructured catalysts
Catalysis, particularly heterogeneous catalysis, is critical to most of the industrial processes, including the manufacturing of fine, specialty, petro and agrochemicals, pharmaceuticals, cosmetics, foods, and polymers. Catalysis is also central to the generation of clean energy and the protection of the environment. Recently researchers are working on developing “smart catalytic materials”, where the performance of the catalyst can be monitored by an external stimulus. A system can be developed where a sensor can provide feedback to artificial intelligence (AI). For example in the case of deactivation of a solid catalyst, AI may induce a self-regeneration (in situ) of the catalyst by an external stimulus.117The foundation of catalysis depends on, stability of the catalyst, chemical kinetics, which is a science for studying the reaction rates of chemical reactions, taking into account their reaction mechanism. As emerging materials, the application of nanomaterials in catalysis has attracted extensive attention. Various nanomaterials like metallic nanoparticles, nanocrystals have been attracting considerable attention due to their promising applications in heterogeneous catalysis.118 They acquire open surface structure and possess a high density of low-coordinated step and kink atoms, and possession of such features leads to extraordinary catalytic properties. Improved kinetic models could be developed when atomic processes on surfaces and the identification and characterization of surface species become available. DFT has emerged as an attractive tool for the computational study of chemical reactions. Extensive efforts have been put into computational methods and simulations to obtain a detailed description of nanoparticle catalyzed reactions to model future experiments. Understanding the nanoscale topography of surface sites, (e.g., terraces, steps, kinks, adatoms, and vacancies, etc.) and their effects on catalytic properties beforehand through DFT studies is the key to the architecture of new nanostructured catalysts.
4.1. Stability of nanocatalysts
High surface area is one of the key intrinsic properties of the nanostructured catalysts for their high catalytic activity, but this also results in the tendency to form agglomerate, which leads to an increase in their size and affects their property. Moreover, some catalysis reactions occur at high temperatures, some catalysts need pre-heat treatment for activation, etc. Therefore, in-depth knowledge about the crystalline phases, compositions, number of atoms in the catalysts, shape, ordering of the particles, etc. are very much essential to access the stability of the nanocatalyst and selecting a catalyst for a particular reaction or designing a new catalyst. In the search of these aforesaid properties, DFT calculations have been employed by several researchers. Cheng et al. and Yu et al. have reviewed how DFT calculations were used to evaluate the stability, activity, selectivity, catalytic performances, etc. for varieties of nanostructured and single-atom catalysts (SACs).119,120 As a representative we are now elaborating two examples where DFT calculations were performed to evaluate the stability of nanocatalysts.Li et al. have employed DFT calculations to evaluate the stability and performance of catalytically active center of a catalyst, that comprises atomically dispersed Pt over Mo2C support (Pt@Mo2C), for Water Gas Shift (WGS) reaction and also to predict the mechanism of the reaction.121 DFT calculations provided information about the stability of Pt@Mo2C and the roles of doped Pt in the catalysis reaction. By calculating formation energy using eqn (9) and (10), they have predicted the stability of various structures (M@Mo2C where M = Ni, Pd, Pt, Cu, Ag, Au) and estimated the ΔEform for various M doped C-terminated and Mo terminated Mo2C (001) surfaces.121
| Mo2mCm(001) + M → M@Mo2m−1Cm(001) + Mo | (9) |
| ΔEform = EM@Mo2m−1Cm(001) + μMo − EMo2mCm(001) − μM | (10) |
The results indicated that the formation energy of the C-terminated structure is higher than that of the Mo-terminated structure, and Pt@Mo2C was the most stable structure. It was predicted that the Mo sites and Pt–Mo sites are active sites for the activation of CO and H2O and the formation of CO2, but the Pt site is the active site for H2 release for the WGS reaction.121
DFT calculations were performed by Piccolo et al. in order to rationalize the striking bimetallic catalyst structures of Au– Rh and TiO2 supported Au–Rh clusters.122
Here, to understand the equilibrium mixing behavior of Au–Rh nanoparticles, a truncated octahedral (TO) shaped system consists of 79 atom clusters was constructed as a model. Calculations were performed for several Au–Rh nanoalloys having different compositions and morphologies e.g., core–shell, Janus, mixed ordered alloy, and ball–cup particles. These general structural types were then extended to larger TO clusters (up to 260 atoms). Mixing energy (which refers to the energy variation due to alloying with respect to the pure clusters) calculations suggested that RhcoreAushell is the most stable configuration whereas AucoreRhshell is the least stable. Then supported clustered was modeled by placing Au, Rh, and Au–Rh clusters in between bridging O rows of locally relaxed on the rutile TiO2(110) surface. Adsorption energies (energy gain due to metal–support interaction) of pure metal clusters and nanoalloys were determined, which showed that compare to the Au cluster, the adsorption strength of the Rh cluster is higher for the Rh cluster because the Rh–O interaction is stronger than the Au–O. The mixing energy, which signifies whether a particular mixing type is stabilized or destabilized, was calculated to evaluate the effect of the support on the clusters. The mixing energy for Janus and RhballAucup structures was found to be negative. Since there is no possibility for Rh–titania contact, RhcoreAushell is destabilized on the surface. They have constructed Janus, RhballAucup, and RhcoreAushell clusters with the same composition as the experimental sample (Au50Rh29) and compared their total energies on the surface which suggested RhballAucup is the lowest total energy structure (Table 3). Fig. 9 depicts the results of DFT calculations of mixing energy versus atomic composition for 79-atom Au–Rh nanoalloy and the structure and corresponding adsorption energy for clusters of selected compositions adsorbed on TiO2(110).
| Composition | Structure | Δa (eV) | Etotb (eV) | Contact to TiO2 | Δ′a (eV) | b (eV) | Eadsc (eV) |
|---|---|---|---|---|---|---|---|
a Mixing energies for free (Δ) and supported (Δ′) clusters.b Total energies for free (Etot) and supported  clusters.c Adsorption energies of supported clusters (Eads). clusters.c Adsorption energies of supported clusters (Eads). |
|||||||
| Au60Rh19 | RhcoreAushell | −5.25 | −290.58 | Through Au | −3.83 | −3119.42 | −3.39 |
| Au50Rh29 | RhcoreAushell | −4.48 | −324.53 | Through Au | −2.15 | −3153.38 | −3.45 |
| Janus | 2.67 | −317.38 | Through Au | 5.96 | −3145.47 | −2.64 | |
| Through Rh | −1.51 | −3152.79 | −9.96 | ||||
| 3.49 | −316.56 | Through both | 4.45 | −3146.84 | −4.83 | ||
| RhballAucup | 0.33 | −319.72 | Through Au | 3.36 | −3147.92 | −2.76 | |
| Through Rh | −3.31 | −3154.59 | −9.43 | ||||
| Through both | −0.96 | −3151.31 | −6.14 | ||||
| Au45Rh34 | Janus | 3.56 | −333.85 | Through Au | 7.50 | −3161.63 | −2.32 |
| Through Rh | 0.12 | −3169.01 | −9.71 | ||||
| Au41Rh38 | RhballAucup | −1.69 | −352.99 | Through Au | 0.36 | −3181.67 | −3.23 |
| Through Rh | −2.82 | −3184.85 | −6.41 | ||||
| Through both | −0.25 | −3183.65 | −5.21 | ||||
| Au19Rh60 | AucoreRhshell | 26.02 | −401.67 | Through Rh | 23.18 | −3238.74 | −11.62 |
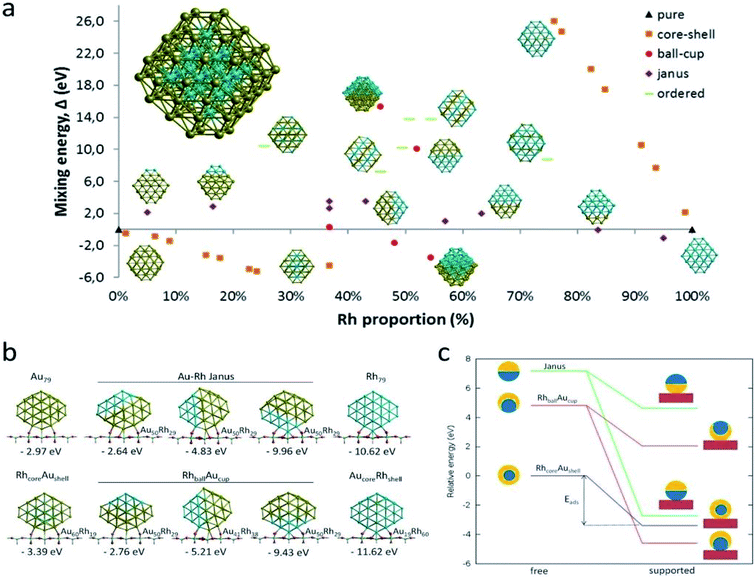 | ||
| Fig. 9 (a) Mixing energy versus atomic composition for 79-atom Au–Rh nanoalloy TO clusters and monometallic counterparts. The most stable cluster (Rh19@Au60) is enlarged in inset. (b) Structure and corresponding adsorption energy for clusters of selected compositions adsorbed on TiO2(110). Blue, yellow, cyan, and red spheres represent Rh, Au, Ti, and O atoms, respectively. Only one layer of the TiO2 slab is shown for simplicity. (c) Schematic view of the energetics of free and supported Au50Rh29 clusters. This figure is reproduced from ref. 122 with permission from Scientific Reports, copyright 2016. | ||
Dietze et al. have employed DFT to identify the stability of different shapes (e.g., cuboctahedral, octahedral, and cubic) of nanocatalysts of the late transition metals as well as Al and Mg as a function of size.123
Liu et al. have investigated the interaction between the stable structures of TiAu4 with a different number of H2O molecules (1, 2, 4, and 12) by using a DFT-based basin-hopping global optimization approach.124
DFT calculations of heterogeneous reactions on catalyst surfaces can provide insights about the reactivity and mechanisms, and can potentially allow in silico screening and design of catalysts. DFT calculations can help to estimate the stability of different nano-catalyst compositions and to unveil reaction mechanisms and rates for different chemical reactions on catalyst surfaces.
However, due to the high computational cost of these methods, other approaches have been developed to predict the properties of the surfaces of nanocatalysts. DFT calculations help to describe the catalytic activity of a nanostructured catalyst surface without explicitly determining reaction paths and transition-state structures.
To understand the role of catalysts in a catalysis reaction, how the reactants interact with the catalytically active sites (for example, metal nanoparticles), how the reactant molecules adsorb on the nano-catalyst surface, what is the role of the support matrix, what are the interfacial interactions exist between the elements present in the nanocatalysts, how these interactions affect the transition state and reaction mechanism, etc. Several researchers have utilized DFT calculations for varieties of catalysis reactions and simulated the reactions to predict the optimum reaction conditions and the reaction mechanisms. For example, by employing DFT calculations, Yang et al. have explained why the inverse hematite/palladium (Fe2O3/Pd) hybrid nanostructure exhibits significantly higher catalytic performance compared to the bare Pd NPs towards methanol oxidation reaction (MOR).125
In a recent review paper, Cui et al. have summarized the several state-of-the-art single-site catalysts, which were used for the reduction of CO2 reaction for different processes (e.g., electroreduction, photoreduction, and thermal). They have discussed the structure–activity relationships of these catalysts and used DFT calculations to predict the reaction mechanisms.126
Nørskov et al. have reviewed how the computational methods help in designing new catalysts with high activity and enhanced selectivity. They have also discussed how to tailor-made the electronic structure of the catalytically active surface by changing its structure and composition.127
As a representative of nanoparticle catalyzed reactions, in this section we will discuss how DFT calculations were carried out to get the insight of two important reactions (i) metal nanoparticle catalyzed reduction reaction of 4-nitrophenol (4-NP) to 4-aminophenol (4-AP), and (ii) the oxidation of CO over a metal catalyst (particularly Au nanoparticles).
4.2. Metal nanoparticle catalyzed reduction of 4-nitrophenol to 4-aminophenol
The reduction reaction of 4-NP to 4-AP in the presence of an excessive amount of aqueous NaBH4 solution has been studied as a model reaction by numerous researchers to assess the catalytic efficiency of nano-catalysts, particularly metal nanoparticles (e.g., Au, Pd, Pt, Ag, Ni, etc.), alloy nanoparticles, metal nanoparticles anchored on support matrix.128–134 This reduction reaction is a simple six electron transfer reaction and trustworthy. It yields a single product and the reaction kinetics can be monitored easily. Generally, bimetallic nanoparticles exhibit superior catalytic properties to their counterpart, and the catalysts, where metal nanoparticles are immobilized on graphene or rGO, show enhanced catalytic efficiency.129 Simulation and computer-based screening of the catalysis reaction pathways provide information on how the elements and atomic arrangement of alloy nanoparticles influence the catalysis reactions and help to obtain the optimal composition to obtain high catalytic properties.135 Rout et al. have reported the high catalytic activity of a graphene oxide supported Au–Cu nano-catalyst towards the 4-NP reduction reaction and demonstrated that the combined synergistic effects of the individual component are responsible for the superior catalytic activity of Au–Cu/rGO.136 To understand the role of interfacial interactions between Au–Cu nanoparticles and rGO support in the adsorption of 4-NP on the catalyst, DFT calculations were carried out for GO, Au, Au–Cu, Au/rGO and Au–Cu/rGO clusters by using the hybrid exchange–correlation functional B3LYP with LANL2DZ basis set embedded in Gaussian09 program without employing any constrain. The adsorption energy, Eads (eV) was calculated by using the following equation:137| Eads = Eadsorbate + surface − (Eadsorbate + Esurface) | (11) |
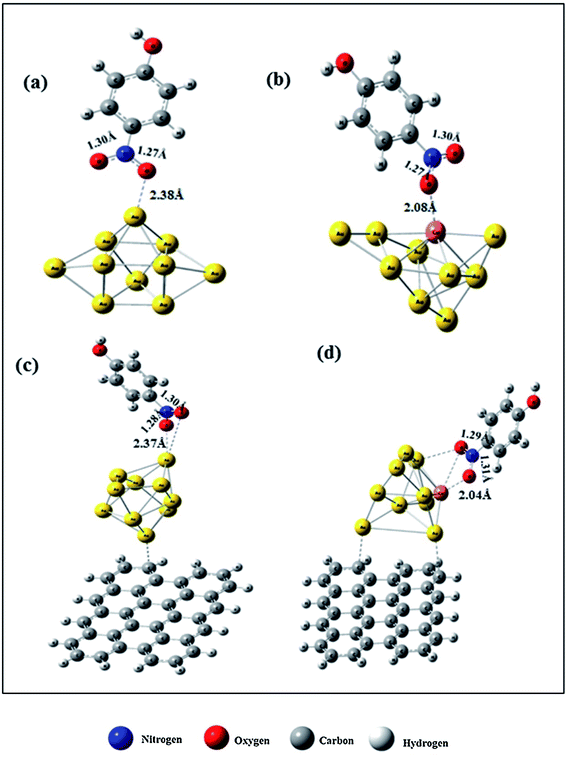 | ||
| Fig. 10 DFT-simulated 4-NP on the surface of (a) Au NPs, (b) Au–Cu NPs, (c) Au/rGO, and (d) Au–Cu/rGO. This figure is reproduced from ref. 136 with permission from Elsevier, copyright 2017. | ||
We have also developed CoNi–rGO and AgNi–rGO nanocatalysts for the reduction of 4-NP.129,131 Our experimental results indicated that the catalytic activity of pure metal nanoparticles (i.e., Co, Ni, Ag) was less than that of bimetallic alloy catalysts (e.g., Co–Ni, Ag–Ni) and when the bimetallic alloy nanoparticles were anchored on the RGO support, the catalytic efficiency was further enhanced. We have performed DFT calculations to know the interfacial interactions (i) between metal nanoparticles in the bimetallic alloy system (e.g., Co–Ni, Ag–Ni) and (ii) between alloy nanoparticles and the graphene in the nanocatalysts. The DOS and TDOS analysis of the structurally optimized Co–Ni and Co–Ni–graphene systems showed the strong contributions from C 2p, Ni 3d, and Co 3d orbitals (Fig. 11 and 12).129 The appearance of new bonds near the Fermi level for the Co–Ni interface indicated the hybridization between 3d states of Co and Ni. In the case of the Co–Ni–graphene interface, new bonds at the valence and conduction region formed which suggested that the 2p state of C was hybridized with Ni 3d and Co 3d states. The charge density plot and difference charge density plot (Fig. 13a and b) illustrate the decrease of electron density of some of the Co centers in the Co–Ni interface in comparison with pure Co and the deficiency of the electron density of Co. In the case of the Co–Ni–graphene interface, the existence of a strong interaction between Co–Ni, C–Ni, and C–Co was observed (Fig. 13c and d). These findings lead us to predict the higher electrical conductivity of Co–Ni–rGO nanocomposite than that of Co–Ni alloy and to derive an explanation why Co–Ni–rGO showed superior catalytic activity to the individual Co, Ni, and Co–Ni alloy catalysts. In the Co–Ni–rGO, the electron-deficient Co sites of Co–Ni played the role of efficient electron-storing sites during the electron transfer process in the reduction of 4-NP to 4-AP. As the reduction of 4-NP to 4-AP occurs via an electron transfer process, the electrical conductivity of the catalyst plays an important role in the catalysis reaction. In the case of the Co–Ni–graphene catalyst, the presence of hybridizations between Co–Ni, Co–C, and Ni–C made this catalyst highly conductive. It provided a shorter and faster transfer path to the electrons. Thus, the high electric conductivity of Co–Ni–graphene nanocomposite enhanced its catalytic efficiency by facilitating the electron transfer process during the reaction. Electrochemical impedance spectroscopic analysis (Fig. 14) also supported this fact by demonstrating the higher conductivity of Co–Ni–graphene nanocomposite.129
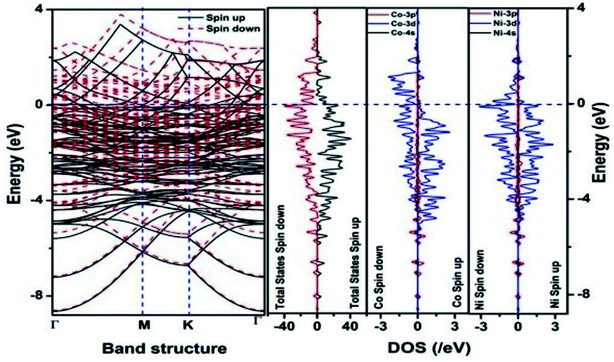 | ||
| Fig. 11 The band structure and density of states of Co–Ni interface. This figure is reproduced from ref. 129 with permission from the American Chemical Society, copyright 2019. | ||
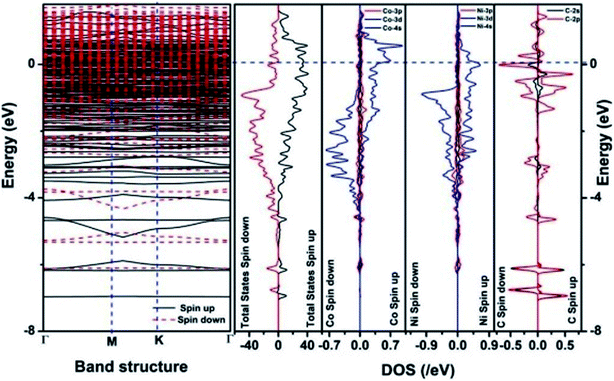 | ||
| Fig. 12 The band structure and density of states of Co–Ni–graphene superlattice. This figure is reproduced from ref. 129 with permission from American Chemical Society, copyright 2019. | ||
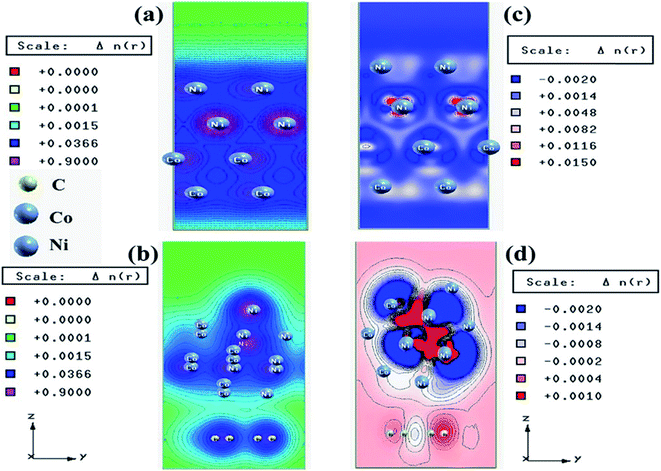 | ||
| Fig. 13 Charge density plots of the (a) Co–Ni interface and (b) Co–Ni graphene interface and difference charge density plot of the (c) Co–Ni interface and (d) Co–Ni graphene interface (where the red color represents charge accumulation and the blue color represents charge depletion in the difference charge density plot). This figure is reproduced from ref. 129 with permission from the American Chemical Society, copyright 2019. | ||
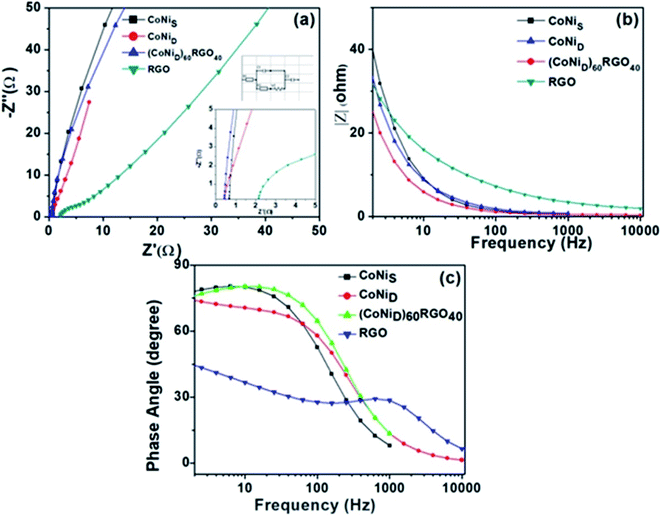 | ||
| Fig. 14 (a) Electrochemical impedance spectra of the synthesized materials, and the insets show the high-frequency region and equivalent circuit used for the fitting of the Nyquist plot. (b) |Z| versus frequency plot, (c) phase angle versus frequency plots. This figure is reproduced from ref. 129 with permission from the American Chemical Society, copyright 2019. | ||
Similar observations were attained when we have carried out DFT calculations for the Ag–Ni–rGO catalysts, to explain why Ag–Ni–rGO exhibited superior catalytic property to individual Ag or Ni particles or Ag–Ni alloy particles for the 4-NP reduction reaction.131 The plausible explanation for the higher catalytic property of Ag–Ni–rGO could be the higher electrical conductivity of Ag–Ni–rGO nanocomposite than that of Ag, Ni, or Ag–Ni nanoparticles. DFT calculations indicated that strong interfacial interactions exist between the components of the nanocomposite. DOS, PDOS, and band structures (Fig. 15–17) of the interfaces between Ag–Ni, showed the existence of hybridization between Ni 3d, Ni 4 s, Ag 4d, and Ag 5s. In the case of Ag–Ni–graphene, the hybridization occurred between Ni 3d and Ag 4d and C 2p states of graphene at the interface of Ag–Ni–graphene (Fig. 18). In the interface, the orbital overlap between Ag and resulted in the creation of electron-deficient centers on/near the Ni atoms. Fig. 18e and g clearly illustrate the interaction between Ag–Ni, C–Ag, and C–Ni in the interface of Ag–Ni–graphene.
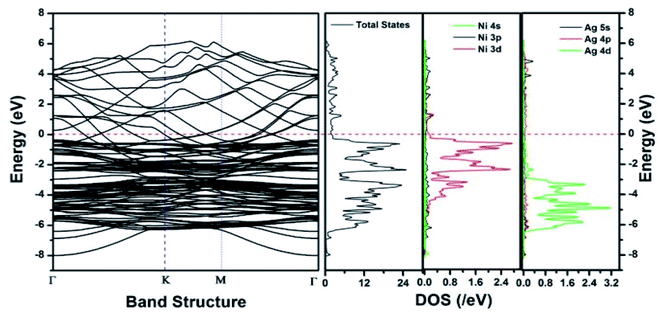 | ||
| Fig. 15 The band structure and density of states of Ag–Ni interface spin up. This figure is reproduced from ref. 131 with permission from the Royal Society of Chemistry, copyright 2018. | ||
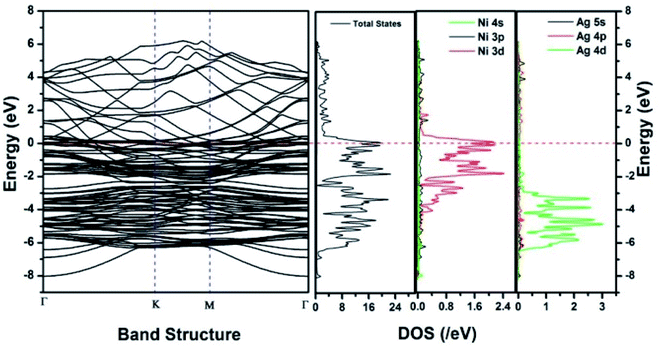 | ||
| Fig. 16 The band structure and density of states of Ag–Ni interface spin down. This figure is reproduced from ref. 131 with permission from Royal Society of Chemistry, copyright 2018. | ||
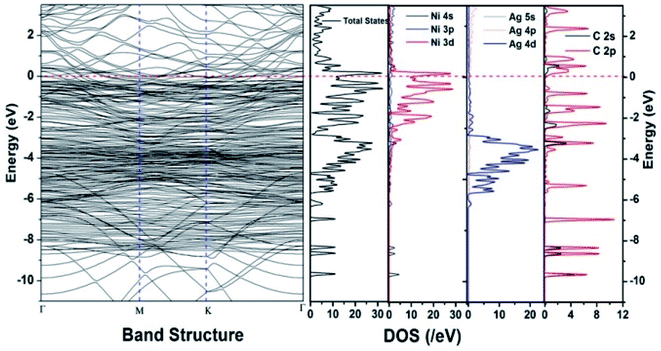 | ||
| Fig. 17 The band structure and density of states of Ag–Ni–graphene superlattice spin down. This figure is reproduced from ref. 131 with permission from the Royal Society of Chemistry, copyright 2018. | ||
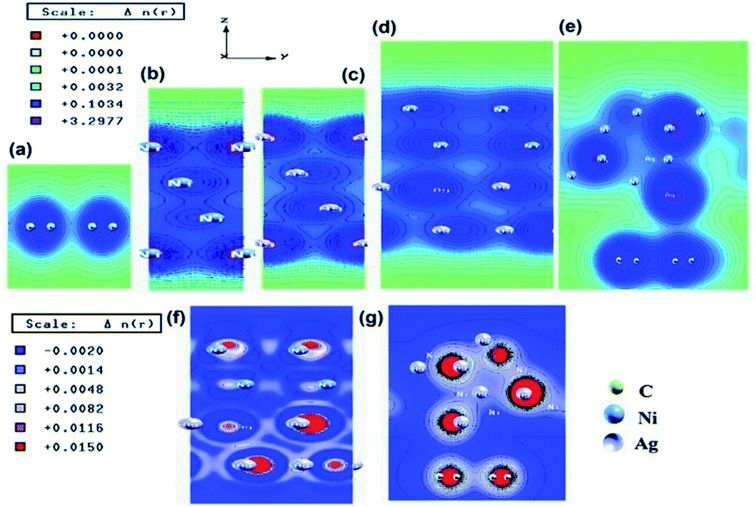 | ||
| Fig. 18 Electronic total charge density plot of (a) graphene, (b) Ni slab, (c) Ag slab, (d) Ag–Ni interface, (e) Ag–Ni–graphene superlattice, difference charge density plots of (f) Ag–Ni interface, and (g) Ag–Ni–graphene superlattice where red color represents charge accumulation and blue color represents charge depletion in difference charge density plot. This figure is reproduced from ref. 131 with permission from American Chemical Society, copyright 2018. | ||
The enhancement of catalytic efficiency of core–shell Ag@Pt nanoparticles due to their immobilization on the sepiolite nanofibers towards the reduction of 4-NP has been reported by Ying Ma et al.138 DFT calculations were performed to determine the plausible reaction mechanism and to realize the electronic structure and interaction of Ag cores and Pt shells in the Ag@Pt nanoparticles. The higher TDOS of Ag@Pt than that of Ag suggested the higher catalytic activity of Ag@Pt. The results obtained from the DFT calculations indicated the electronic structure of Ag@Pt, which showed the charge redistribution and s–p hybridization between Ag and Pt.
The accumulation of electrons on (111) plane of Pt with respect to (111) plane of Ag surfaces was observed at the interface between Pt and Ag (Fig. 19), which suggested the charge transfer from Ag to Pt.138–140 The TDOS of Ag, Pt, and Ag@Pt showed that the main contributions came from s and d orbitals in the energy level and TDOS of Ag@Pt was much higher than that of Ag (Fig. 20).138 These results suggested that the enhanced catalytic activity of Ag@Pt was due to its low stability.141–143
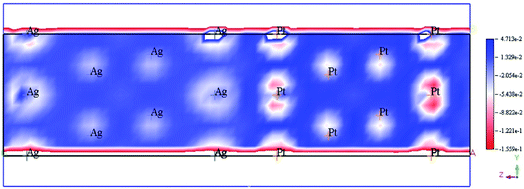 | ||
| Fig. 19 Electron deformation density of the 2 × 2 layer of Pt (111) and Ag (111) surfaces, and the loss and gain of electrons are indicated in blue and red, respectively. This figure is reproduced from ref. 138 with permission from Elsevier, copyright 2017. | ||
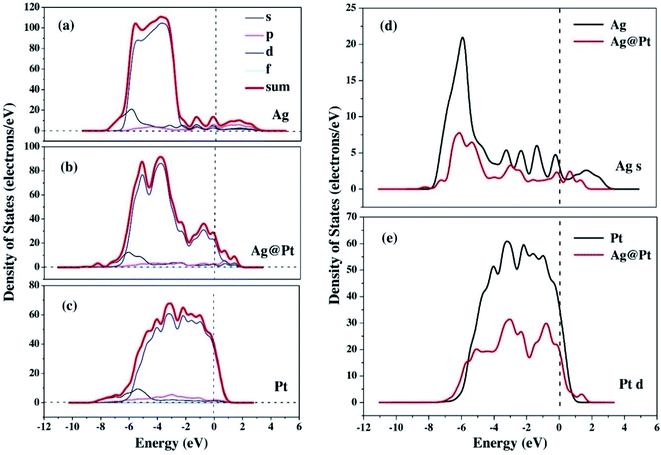 | ||
| Fig. 20 The TDOS and partial density of states (PDOS) of Ag (a), Ag@Pt (b) and Pt (c) nanoparticles, the s-electron PDOS of Ag cores (d) and the d-electron PDOS of Pt shells (e), respectively. This figure is reproduced from ref. 138 with permission from Elsevier, copyright 2017. | ||
4.3. Oxidation of CO over nanocatalyst
The selective oxidation of carbon monoxide on the nanostructured catalysts has gained the immense interest of many experimental and theoretical researchers because this catalysis reaction is important in many fields such as reduction of CO and/or NO from the flue gases, nitric acid factories, electric power, and coal-fired power plants, etc. Several researchers have performed DFT calculations to have an insight into the mechanistic aspects of CO oxidation reactions on various catalysts.144–150 Chen et al. have reviewed the results obtained from DFT studies on the CO oxidation on Au clusters and Au/oxide systems.151 The DFT calculations quantify several factors which play important roles in the Au catalyzed CO oxidation reactions namely coordination of Au atoms,146 interfacial properties of Au-oxide,148 influence from the support materials,152 effects of cluster size on metal-insulator transition,153 strain effects,154 dynamic structural fluxionality, etc. By the DFT calculation, Mavrikakis et al. have shown the stronger binding potential of Au (211) with CO than with the surface atoms of Au (111).144 Liu et al. have reported the DFT calculation of CO oxidation of Au/TiO2 and the stronger adsorption of O2 on Au/TiO2 interface than on pure Au.148Zhanpeisov et al. explained the selective oxidation of CO on Au supported on TiO2 and also how nonmetal (carbon, nitrogen) doping on TiO2 enhances its photocatalytic activity.155 Experimental results showed that either of the isolated Au or TiO2 was relatively inactive for the selective oxidation of CO, but the combination of the two produced excellent catalyst for CO oxidation at low temperature, water–gas shift reaction, propylene epoxidation, nitrogen oxide reduction, etc.156 DFT calculations were used to calculate the adsorption energy when CO was adsorbed on the surface of only Au or only TiO2 or Au–TiO2, which showed that Au stabilized on water-assisted and vacancy containing TiO2 (110). The defect-free rutile was modeled to determine the formation energy of different oxygen vacancy sites and for this purpose, the extended clusters of Ti10O32H24 (model I) and Ti13O43H34 (model II) were used. Fig. 21 exhibits all kinds of active sites of the rutile TiO2 (110) surface.155 The adsorption energies were estimated when CO has adsorbed either on Lewis acid fivefold coordinated Ti5c or an Au site and was found to be almost equal values (∼19 and 20.5 kcal mol−1) for both the cases. The interaction of CO with the oxygen vacancy site is energetically less preferable than its adsorption on an Au center of Au/TiO2 (110). Moreover, it was observed that C and N doping on TiO2 (110) resulted in two different structures. Energetically most profitable condition was obtained when C occupied an interstitial position in deep bulk and N replaced the protruded oxygen atom and formed a surface N–H group.
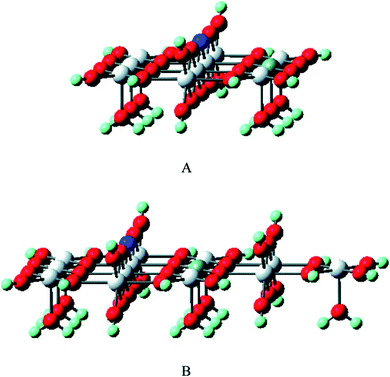 | ||
| Fig. 21 The cluster models of Ti10O32H24 (A) and Ti13O43H34 (B) were used to mimic rutile TiO2(110) as well as to estimate the formation energy of different oxygen vacancy sites. The first model A is a completely symmetrical one (with a relatively small number of structural parameters for the geometry optimization), while the second model B is a slightly extended form involving additional bulk as well as Ti5C centers. The dark blue and grey balls stand for the selected precursor bridging O center on which the vacancy would be formed and the Ti5C center, respectively. This figure is reproduced from ref. 155 with permission from the American Chemical Society, copyright 2007. | ||
Lopez et al. have used the self-consistent DFT calculations for the Au10 cluster catalyzed CO oxidation reaction. These calculations suggested that the synergistic effect, which arose from the combination of special reaction geometries of small particles, and the greater ability of low coordinated Au atoms to interact with the surrounding molecules, played a major role in the extraordinary reactivity of the catalyst.146
Sang Hoon Kim performed DFT calculations to study how the adsorbing oxygen molecules activate CO oxidation on nanoporous Au surface.157 The interactions between CO and Pt/Au clusters having varying structure, size, and composition were investigated by Song et al. by performing DFT calculations.158 The HOMO–LUMO energy gap, the cluster formation energy, binding energy, and the magnetic moment of Pt/Au clusters with the number of atoms ranging from 3 to 13 were determined, which showed that among many Pt/Au isomers the most stable structure is the planar structure and CO adsorptions to the Pt site are stronger than to the Au site. The results obtained via DFT calculations were correlated with the results obtained from the Pt/Au catalyzed CO and methanol oxidation reaction experiment. Chen et al. used DFT studies to explain the enhancement of selectivity Au nanoparticles supported on inert materials toward epoxidation on the alkenes (Fig. 22).159 Spin-polarized DFT calculations with GGA and PW91 formulation were performed to investigate the epoxidation reaction of ethylene on the Au nanoparticles and Au (111) surface. To locate the transition state for the ethylene oxidation reaction catalyzed by Au29 nanoparticle and Au (111) surface, climbing-image nudged elastic band method was employed. From these calculations, it was predicted that the Au nanoparticle was much more selective than the Au (111) surface, which could be due to the role of active sites of Au (111) having lower coordination for low-barrier ethylene oxidation. The potential energy diagram for this reaction which resulted in the formation of epoxide and acetaldehyde is illustrated in Fig. 22.159
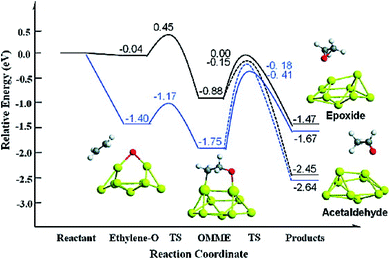 | ||
| Fig. 22 Potential energy diagram for the epoxide and acetaldehyde formation from ethylene and atomic oxygen adsorbed on a Au (111) surface (black line) and nanoparticle (blue line). This figure is reproduced from ref. 159 with permission from the American Chemical Society, copyright 2010. | ||
Through DFT studies Oprea et al. have studied the electronic structure and properties of TiO2 nanoclusters for the application in hybrid photovoltaic or as photocatalysis reactions.160 For a detailed understanding of the charge transfer processes in hybrid organic–inorganic photovoltaics or photocatalysis reactions, they have carried out computational studies of TiO2 nanoclusters and complex systems with various molecules which are adsorbed onto the clusters. In this model system, the correlation between adsorbed. Fig. 23 displays the electronic density of the HOMO and the LUMO for three clusters.160 Also they have studied the adsorption of coumarin, oligo methine cyanine, and penicillin V on TinO2n+2H4 nanoclusters and reported a significant number of distortions occurred due to adsorption for both the cluster and molecule when n = 14. From DOS analysis they predicted that the cluster with n = 14 is a poor choice for simulating the materials, whereas cluster sizes larger than or equal to n = 34 are required for photovoltaic and photocatalytic applications. It was also observed that a little improvement of performance occurred when the cluster size was increased from 44 to 54, but a high computational cost was also associated with it.160
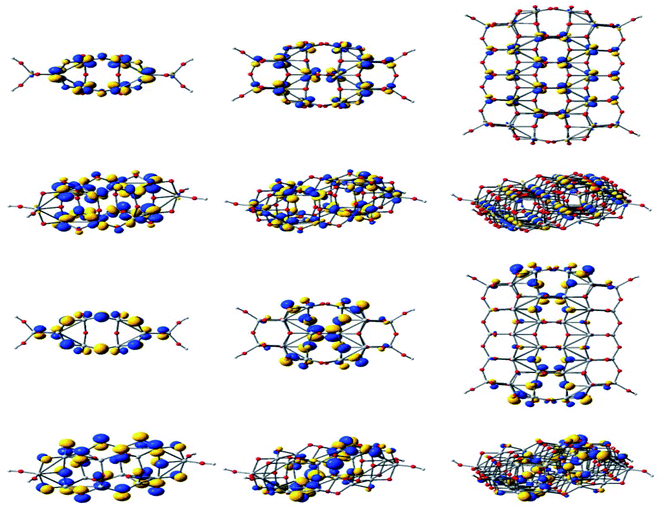 | ||
| Fig. 23 Isodensity surfaces (0.03 e bohr−3) of the key molecular orbitals of TinO2n+2H4 clusters (n = 14, 24, 54, from left to right, respectively), calculated by DFT at the B3LYP/LANL2DZ level in a water solvent. The first two rows display the top and a perspective view of the LUMOs, whereas the bottom two rows show the top and a perspective view of the HOMOs. Atom colors: Ti, grey; O, red; and H, light grey. This figure is reproduced from ref. 160 with permission from MDPI, copyright 2019. | ||
4.4. Some reactions catalyzed by graphene/GO-based nanocatalysts
As mentioned earlier, DFT calculations were extensively performed to explain and predict varieties of reactions catalyzed by graphene-based nanocomposites. To reveal the reaction mechanisms of oxidations and hydrations reactions catalyzed by graphene oxide (GO), Boukhvalov et al. have carried out DFT studies for the conversion of benzyl alcohol to benzaldehyde via oxidation reaction and reported that the hydrogen atom transfer from the organic molecule to the surface of GO during the oxidation process.161Yun-Xiang Pan et al. have the CdS nanoparticle coated GO nanosheets catalyzed the electron transfer process for the photoreduction of CO2 by performing DFT studies.162
Using DFT Xuejiao J. Gao et al. have proposed the possible reaction mechanisms of the GO or rGO catalyzed oxidation reaction of 3,3,5,5-tetramethylbenzidine (TMB) by H2O2 and showed that the carbonyl groups acted as active centers, and one of the key steps of this reaction was the activation of the CQO bond. They have also proposed the rational design of carbon-based nanoenzymes.163
Metal–graphene interfaces play an impact role in graphene device applications. To investigate the atomic and electronic structures of chemisorption and physisorption interfaces, Cho et al. have used the first-principles calculations for twelve metal–graphene interfaces.164 For NGN catalyzed oxygen reduction reaction in alkaline medium a multiscale model was proposed by Vazquez-Arenas et al.165 The activation energies were determined at the atomic level by DFT calculations. Then they were scaled up into a continuum framework to describe the cathode/electrolyte interface at the mesoscale level. Sai Zhang, et al. fabricated a novel and high efficiency visible-light-driven dual-oxygen-doped porous g-C3N4 (OPCN) photocatalysts for waste water treatment and proposed the photodegradation reaction mechanism of BPA in aqueous solution through experimental and theoretical calculations (Fig. 24).166
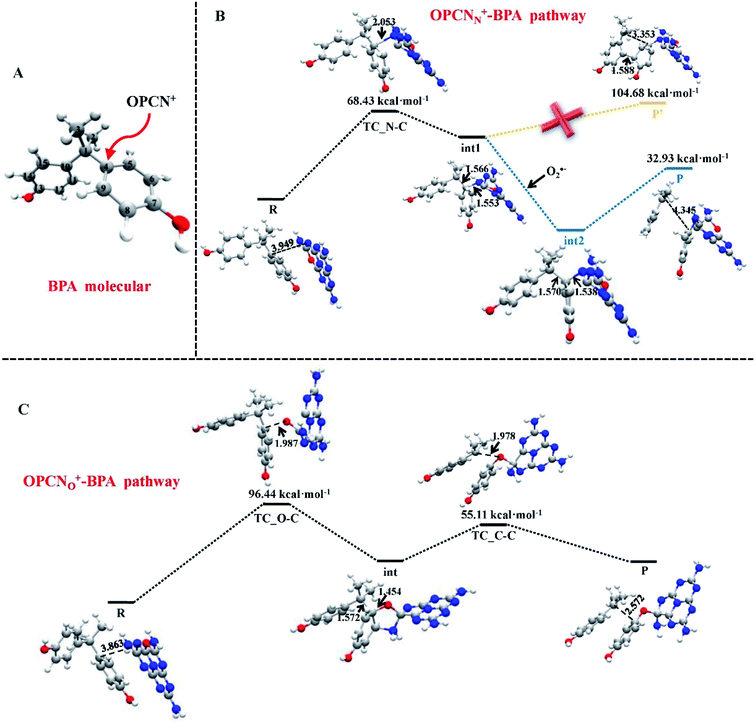 | ||
| Fig. 24 (A) The active sites of BPA for OPCN attacks. DFT calculated structures of reactants, intermediates, and transition state for the degradation of BPA attacked by OPCN catalysts with (B) N atoms or (C) doped O atoms as reactive sites white, red, gray and blue balls represented H, O, C and N elements, respectively. This figure is reproduced from ref. 166 with permission from Elsevier, copyright 2019. | ||
5. DFT calculations for magnetic properties of nanomaterials
Magnetic nanoparticles and nanocomposites have demonstrated their potentials to be used in applications including magneto-optics, high-density magnetic storage, nanomedicine, catalysis, etc.167–172 Magnetic nanoparticles have tremendous capability to be used in cutting edge spintronics technology. The spintronics devices exhibit the features of high storage density, fast operation, low power consummation, etc. The materials possessing ferromagnetism, semiconducting, and ferroelectricity properties together in a single or a heterostructure can be considered as suitable materials for the spintronics technology, such as multiferroic nanocomposites composed of two nanostructured materials possessing room temperature ferroelectric and ferromagnetic properties, functional ferromagnetic semiconductor materials with larger spin polarization. Yakout et al. in a review paper discussed the future of spintronics-based technologies.173,174For these aforesaid applications, designing nanomaterials with targeted magnetic properties is extremely important. Therefore, a clear understanding of how the changes of local densities of states (LDOS) influence the magnetic properties of nanoparticles is very critical. The interatomic distances, the charge distributions per site and orbital, the local spin magnetic moments provide key information about the dependency of magnetic nanoparticles on the size of nanoparticles.
DFT has now been extensively used to understand the magnetic properties of varieties of nanoparticles, nanoclusters, nanocomposites, etc., and to explain how different doping or creation of defects alters the magnetic properties of the materials.175–183 As for the past several years, graphene-based nanocomposites have been explored extensively for their potential applications in various fields, we will now discuss how DFT was used to estimate and/or predict important magnetic properties for some of the graphene-based nanocomposites, and to explain the experimentally observed results.
Pristine graphene is a nonmagnetic material and its DFT calculations showed the identical spin up and spin down electronic charge density and equal sharing of electronic charge between p-orbitals of two adjacent carbon atoms throughout the graphene monolayer, which confirmed its covalent bonding via sp2 hybridization (Fig. 25a and b).184
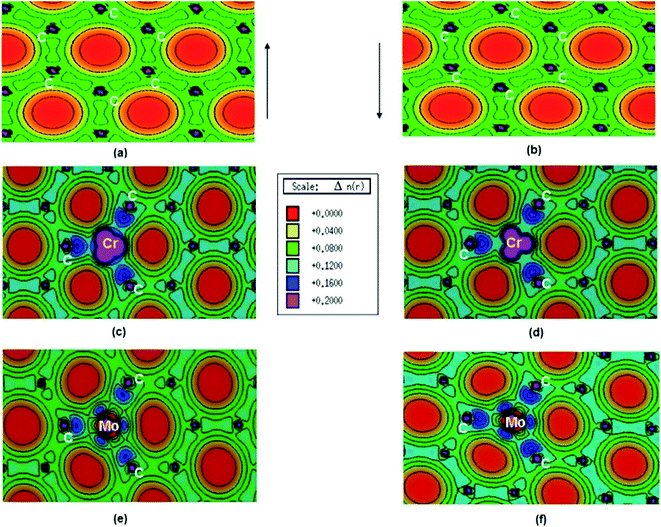 | ||
| Fig. 25 (a) Spin polarized total valence electron charge density, n(r) over the graphene plane in units of e Å−3 for (a) and (b) pristine, (c) and (d) Cr-doped and (e) and (f) Mo-doped graphene. This figure is reproduced from ref. 184 with permission from Elsevier, copyright 2016. | ||
The introduction of several dopants and defects induce magnetic properties in graphene, because of the breaking of the symmetry of the π-electron system of graphene. Till date, the reports describing the synthesis methodology for the preparation of metal-doped graphene materials are rarely available. Recently Dyck et al. have reported a method to synthesize metal-doped graphene, where the localized insertion of single dopant atoms (e.g., Si, Ti, Cr, Fe, Co, Ni, Cu, Pd, Ag, and Pt) into the graphene lattice and onto graphene edges were performed by using controlled and focused electron beam in a scanning transmission electron microscope.185–187 They have also performed DFT calculations to reveal the metal-binding energies, electronic, and magnetic properties of dopants in graphene.
Thakur et al. have studied the magnetic properties of Cr and Mo doped graphene and determined the electronic properties of the doped graphene.184 From the DOS plots of the pristine, Cr-doped, and Mo-doped graphene, the change of spin-polarized total valence electron charge density over the graphene plane due to Cr and Mo doping was observed. Cr-doped graphene showed the dissimilarity between the majority and minority of spins of the valence electronic charge densities of the Cr atom because of the influence of the Cr atom on the local environment. The transfer of charge from Cr to nearby C atoms caused the appearance of some induced moments on the nearby C atoms which made Cr–C bonds slightly polar covalent. Owing to the difference between the DOS of majority and minority spins, the magnetic moment was generated on Cr-doped graphene. Whereas, for Mo doped graphene, the presence of a radial node in Mo-4d orbital resulted in a weaker p–d hybridization and almost identical charge density in the majority and minority spin. This resulted in the generation of only a small magnetic moment in graphene due to Mo doping.
Durajski et al. have used DFT to explain the introduction of magnetic state in graphene due to doping with different metals (e.g., V, Cr, Mn, Fe, Co, Ni, and Cu) by showing the modification of its band structure.188 They have demonstrated the influence of doping on the electronic properties of the graphene layers. The Curie temperatures obtained for Cr and V-doped graphene were far exceeded the room temperature, whereas the Mn-doped graphene showed nonmagnetic behavior. DOS calculations showed (Fig. 26) the effect of dopants on the electronic properties of graphene states. For the V, Cr, Fe, and Co-doped graphene the total DOS near the Fermi level became noticeably asymmetric, whereas the symmetry of the spin-up and spin-down bands of Ni- and Cu-doped systems explained their nonmagnetic nature. The determination of the total DOS of V, Cr, and Co-doped graphene in the ferromagnetic state by with and without U parameter (Fig. 27), did not display any significant or drastic change due to the introduction of the U parameter. This fact explained why the estimated values of Curie temperatures, obtained via calculation with DFT and the DFT+U approach showed only a slight difference (Table 4).188
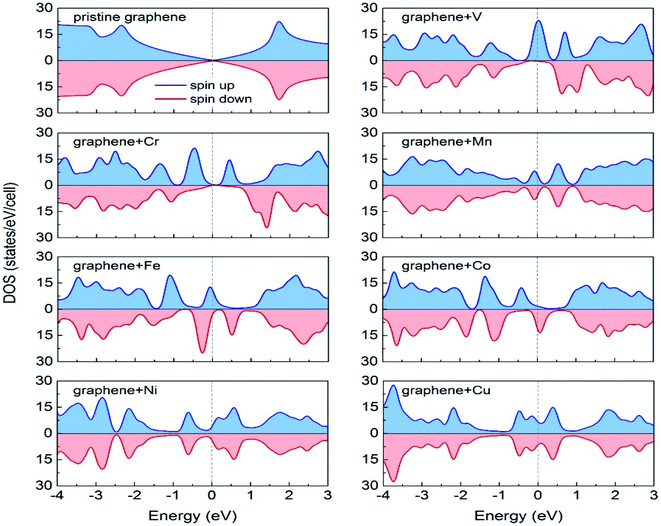 | ||
| Fig. 26 A comparison of the spin-polarized density of states (DOS) of ideal pristine and doped graphene supercells. The Fermi level set to zero is indicated as the vertical dashed line. This figure is reproduced from ref. 188 with permission from Elsevier copyright, 2020. | ||
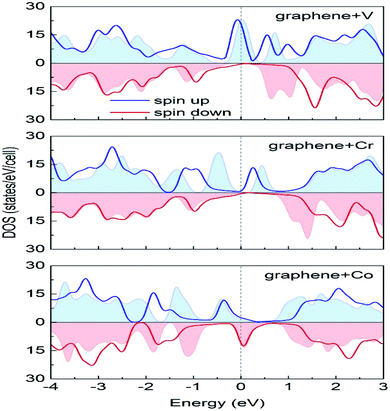 | ||
| Fig. 27 A comparison of the spin-polarized density of states computed in DFT (colored background areas) and DFT+U approach (solid lines). The Fermi level set to zero is marked as the vertical dashed line. This figure is reproduced from ref. 188 with permission from Elsevier, copyright 2020. | ||
| Dopant | U (eV) | M (μB) | ΔEFM-AFM | Tc (K) |
|---|---|---|---|---|
| V | 3.90 | 3.97 | −0.404508 | 782.3 |
| Cr | 3.21 | 8.00 | −0.250691 | 484.9 |
| Co | 7.83 | 3.20 | −0.053287 | 103.1 |
Abdel-Aal et al. have reported the theoretical and an experimental study of the LaFeO3–rGO nanocomposite.189 In the abinitio calculations for the structure optimization, the different magnetic coupling between the Fe atoms were considered (Fig. 28). The variation of total energy with respect to different magnetic coupling suggested the stable antiferromagnetic ground state of the material. The coupling of rGO turned its G-type antiferromagnetic coupling behavior to ferromagnetic behavior. During calculations, the addition of U enhanced the magnetic moment of the Fe atom from 3.6 μB to 4.04 μB, which agreed well with the experimental value 3.90 (ref. 190) and 4.6.191,192
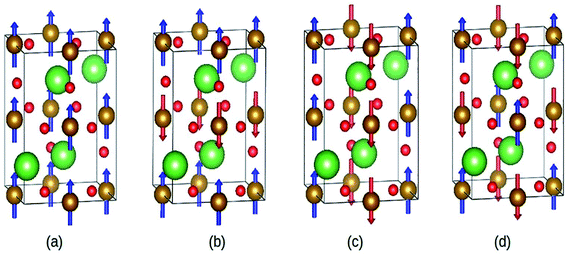 | ||
| Fig. 28 Different magnetic configuration considered (a) ferromagnetic (FM), antiferromagnetic (b) A-type, (c) C-type and (d) G-type. Fe (gold), La (green), and O (red). This figure is reproduced from ref. 189 with permission from Elsevier, copyright 2020. | ||
Idisi et al. have performed DFT calculations to explain the relationship between the DOS and the magnetic properties of the nanocomposites (r-GO:Au NPs & r-GO:Fe2O3 NPs), and compared the calculated results with the experimentally obtained data.193 PDOS of r-GO, r-GO:Au, and r-GO:Fe–O are shown in Fig. 29 which depicts the contributions of the different core states to the total DOS. The enhanced magnetization of r-GO:Au-NP than the pristine rGO was explained by the dependency of magnetization on the cluster size of composite, where the interactions between C–Au bonds did not contribute. The reduction of particle size caused the reorientation of the diamagnetic Au spins. The exchange interaction between C, O, and Au magnetic moments played an important role in the enhancement of magnetization. DFT studies elucidated the contributions of Au-3d and O-2p on the magnetization of r-GO:Au, however, the experimental data indicated the role of the Au 4f doublet state. In the case of r-GO:Fe2O3 NPs, Fe 2p, Fe 3d, and O 2p orbital states were major contributors. In the case of r-GO:Fe–O, a significant contribution came from the 3d core state in comparison with Fe 2p. This indicated the important role of the exchange interaction between delocalized 3d and C-2p electrons on the enhanced magnetization. The exchange interactions between C-2p, Fe-3d, and Fe-2p explained the enhanced magnetization observed from the experiment.
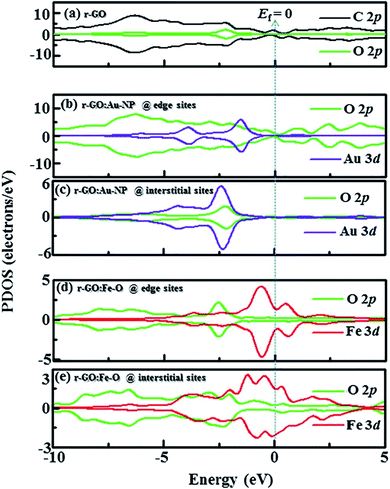 | ||
| Fig. 29 Partial density of states (PDOS) showing contribution from C, Au, Fe, and O orbitals in (a) r-GO, (b) r-GO:Au at edge sites, (c) r-GO:Au at interstitial sites, (d) r-GO:Fe–O at edge sites and (e) r-GO:Fe–O at interstitial sites [minimal contributing orbitals to the PDOS are C 2s, O 2s, Au 4s and Fe 2p (not shown)]. This figure is reproduced from ref. 193 with permission from Elsevier, copyright 2020. | ||
6. Challenges of DFT
Though DFT has become a very popular tool in most of the branches of chemistry and material science, conventional DFT faces some challenges.194,195 Cohen et al. have discussed the challenges of DFT in a review paper.196 Simplicity is the key feature of DFT, but the introduction of functionals/approximations makes DFT complicated. Though DFT was widely used by the solid-state physics community much earlier than computational chemist groups, accurate description of geometries and estimation of the binding energy of molecules are the challenges associated with DFT. To provide a detailed explanation of chemical reactions, the description of weak interaction between the molecules as well as transition state is very important. However, in this context, the problem associated with LDA/GGA type functionals is that they symmetrically underestimate the transition state barriers. Moreover, in many cases, van der Waals free or London dispersion force poses a problem for approximate functionals. Therefore, accurate and efficient descriptions of van der Waals interaction, covalent bonding, and transition state enduring challenges of DFT for the system when all of these interactions are active simultaneously. Self-interaction error arises in DFT, during solving one-electron system because DFT considers only total density ρ and does not treat individual electrons. Here single electron unphysically interacts with itself. Despite serious attempts that have been made to achieve better performance on sets of many molecules, still, a significant amount of error is associated with the modern functionals for simple systems. The failure of functionals for infinitely stretched H2+ and infinitely stretched H2 is one of the important limitations of modern electronic structural theory. Therefore, continuous developments are required to achieve the correct description of strong correlation, energy gap, etc. In the current status, some of the challenges have been already overcome and others are ongoing research problems.7. Conclusion
In this review, we have discussed the importance of DFT calculation to understand as well as predict some of the important properties of nanostructured materials. Description of electronic structures of the materials can be obtained from DFT calculations which leads to provide information about the electronic properties of the nanomaterial. The electronic properties of the materials are quite useful to explain and predict the properties of materials. The aim of this review is to give a broad overview to the researchers particularly those who started to seek the in-sight understanding of the properties of nanomaterial in the light of theoretical/computational calculations. DFT has an incredible success story for this purpose. The combination of computational cost-effectiveness and accuracy with reasonable range make DFT a popular technique in most of the fields of chemistry, material science, solid-state physics, etc.In this article, we have discussed how DFT has been widely used to understand the optical, optoelectronic, catalytic, and magnetic properties of various types of nanomaterials. Specific examples were taken to elaborately discuss each of these properties. We have emphasized that how the properties of nanomaterial obtained from DFT calculations converge or deviate from experimentally obtained results.
Conventional DFT is also associated with some limitations. As an example, pure DFT underestimates the Eg of semiconductor materials. Several approximate functions have been developed to bridge the gap between DFT calculated and experimentally obtained results. Incorporation of these approximations most of the time results in fairly accurate results. However, too many approximations lead the computational process complicated and costly, moreover, deficiency in describing strongly correlated systems, too slow process for liquids are also some of the limitations associated with modern DFT.194 Because of the unmet demand, generating new functionals for DFT calculations is growing progress. Achieving all the properties at an equitable computational cost is the extreme goal. In this scenario, DFT offers the advantage of reasonably high accuracy at a relatively low computational cost. However, more advancement of DFT needs to be accomplished by targeting (i) more universally accurate functionals, and/or (ii) density functionals that are universally less accurate but having higher accuracy for specific applications. Therefore, an immense amount of opportunities exists for further improvement of DFT.
Conflicts of interest
The authors declare no conflict of interest.Reference
- F. T. Rabouw and C. de Mello Donega, Handbook of Photoactive Semiconductor Nanocrystal Quantum Dots, Springer, 2017, pp. 1–30 Search PubMed
.
- T. Bora, A. Dousse, K. Sharma, K. Sarma, A. Baev, G. L. Hornyak and G. Dasgupta, Int. J. Smart Nano Mater., 2018, 10, 116–143 CrossRef
.
- H. Demir and L. C. Grabow, ACS Appl. Nano Mater., 2020, 3, 6127–6130 CrossRef CAS
.
- M. Segall, P. J. Lindan, M. J. Probert, C. J. Pickard, P. J. Hasnip, S. Clark and M. Payne, J. Phys.: Condens. Matter, 2002, 14, 2717–2744 CrossRef CAS
.
- K. Harun, N. A. Salleh, B. Deghfel, M. K. Yaakob and A. A. Mohamad, Results Phys., 2020, 16, 102829–102840 CrossRef
.
- M. Stone, Phys. Rev. D: Part. Fields, 1986, 33, 1191–1194 CrossRef CAS PubMed
.
- Z.-C. Wang and B.-Z. Li, Phys. Rev. A, 1999, 60, 4313–4317 CrossRef CAS
.
- F. Oba, M. Choi, A. Togo and I. Tanaka, Sci. Technol. Adv. Mater., 2011, 12, 034302–034315 CrossRef PubMed
.
- C. B. Ong, L. Y. Ng and A. W. Mohammad, Renewable Sustainable Energy Rev., 2018, 81, 536–551 CrossRef CAS
.
- C. Klingshirn, ChemPhysChem, 2007, 8, 782–803 CrossRef CAS PubMed
.
- J. Perdew, S. Burke and M. Ernzerhof, Phys. Rev. Lett., 1996, 77, 3865–3868 CrossRef CAS PubMed
.
- J. P. Perdew, K. Burke and Y. Wang, Phys. Rev. B: Condens. Matter Mater. Phys., 1996, 54, 16533–16539 CrossRef CAS PubMed
.
- S. Dudarev, G. Botton, S. Savrasov, C. Humphreys and A. Sutton, Phys. Rev. B: Condens. Matter Mater. Phys., 1998, 57, 1505–1509 CrossRef CAS
.
- X. Ma, Y. Wu, Y. Lv and Y. Zhu, J. Phys. Chem. C, 2013, 117, 26029–26039 CrossRef CAS
.
- X. Y. Deng, G. H. Liu, X. P. Jing and G. S. Tian, Int. J. Quantum Chem., 2014, 114, 468–472 CrossRef CAS
.
- J. Hafner, C. Wolverton and G. Ceder, MRS Bull., 2006, 31, 659–668 CrossRef
.
- G. R. Schleder, A. C. Padilha, C. M. Acosta, M. Costa and A. Fazzio, J. Phys Mater., 2019, 2, 032001–032047 CrossRef CAS
.
- X. Gonze, F. Jollet, F. A. Araujo, D. Adams, B. Amadon, T. Applencourt, C. Audouze, J.-M. Beuken, J. Bieder and A. Bokhanchuk, Comput. Phys. Commun., 2016, 205, 106–131 CrossRef CAS
.
- W. Andreoni and A. Curioni, Parallel Comput., 2000, 26, 819–842 CrossRef
.
- D. Marx and J. Hutter, Ab initio molecular dynamics: basic theory and advanced methods. Cambridge University Press: 2009 Search PubMed
.
- G. Kresse and J. Hafner, Phys. Rev. B: Condens. Matter Mater. Phys., 1993, 47, 558–561 CrossRef CAS PubMed
.
- G. Kresse and J. Furthmüller, Phys. Rev. B: Condens. Matter Mater. Phys., 1996, 54, 11169–11186 CrossRef CAS PubMed
.
- G. Kresse, J. Furthmüller and J. Hafner, Phys. Rev. B: Condens. Matter Mater. Phys., 1994, 50, 13181–13185 CrossRef CAS PubMed
.
- G. Kresse and J. Furthmüller, Comput. Mater. Sci., 1996, 54, 11169–11186 CAS
.
- J. M. Soler, E. Artacho, J. D. Gale, A. García, J. Junquera, P. Ordejón and D. Sánchez-Portal, J. Phys.: Condens. Matter, 2002, 14, 2745–2779 CrossRef CAS
.
- J. Turney, A. Simmonett, R. Parrish, E. Hohenstein, F. Evangelista, J. Fermann, B. Mintz, L. Burns, J. Wilke and M. Abrams, Wiley Interdiscip. Rev.: Comput. Mol. Sci., 2012, 2, 10–1002 Search PubMed
.
- M. J. Frisch, G. W. Trucks, H. B. Schlegel, G. E. Scuseria, M. A. Robb, J. R. Cheeseman, J. A. Montgomery Jr, T. Vreven, K. N. Kudin, J. C. Burant, J. M. Millam, S. S. Iyengar, J. Tomasi, V. Barone, B. Mennucci, M. Cossi, G. Scalmani, N. Rega, G. A. Petersson, H. Nakatsuji, M. Hada, M. Ehara, K. Toyota, R. Fukuda, J. Hasegawa, M. Ishida, T. Nakajima, Y. Honda, O. Kitao, H. Nakai, M. Klene, X. Li, J. E. Knox, H. P. Hratchian, J. B. Cross, V. Bakken, C. Adamo, J. Jaramillo, R. Gomperts, R. E. Stratmann, O. Yazyev, A. J. Austin, R. Cammi, C. Pomelli, J. W. Ochterski, P. Y. Ayala, K. Morokuma, G. A. Voth, P. Salvador, J. J. Dannenberg, V. G. Zakrzewski, S. Dapprich, A. D. Daniels, M. C. Strain, O. Farkas, D. K. Malick, A. D. Rabuck, K. Raghavachari, J. B. Foresman, J. V. Ortiz, Q. Cui, A. G. Baboul, S. Clifford, J. Cioslowski, B. B. Stefanov, G. Liu, A. Liashenko, P. Piskorz, I. Komaromi, R. L. Martin, D. J. Fox, T. Keith, M. A. Al-Laham, C. Y. Peng, A. Nanayakkara, M. Challacombe, P. M. W. Gill, B. Johnson, W. Chen, M. W. Wong, C. Gonzalez, and J. A. Pople, Gaussian, Inc., Wallingford CT, 2004
.
- K. Schwarz and P. Blaha, Solid state calculations using WIEN2k, Comput. Mater. Sci., 2003, 28, 259–273 CrossRef CAS
.
- P. Giannozzi, S. Baroni, N. Bonini, M. Calandra, R. Car, C. Cavazzoni, D. Ceresoli, G. L. Chiarotti, M. Cococcioni and I. Dabo, J. Phys.: Condens. Matter, 2009, 21, 395502–395521 CrossRef PubMed
.
- P. Giannozzi, O. Andreussi, T. Brumme, O. Bunau, M. B. Nardelli, M. Calandra, R. Car, C. Cavazzoni, D. Ceresoli and M. Cococcioni, J. Phys.: Condens. Matter, 2017, 29, 465901–465931 CrossRef CAS PubMed
.
- S. Goedecker, M. Teter and J. Hutter, Phys. Rev. B: Condens. Matter Mater. Phys., 1996, 54, 1703–1710 CrossRef CAS PubMed
.
- J. VandeVondele, M. Krack, F. Mohamed, M. Parrinello, T. Chassaing and J. Hutter, Comput. Phys. Commun., 2005, 167, 103–128 CrossRef CAS
.
- M. Krack, Theor. Chem. Acc., 2005, 114, 145–152 Search PubMed
.
- J. VandeVondele and J. Hutter, J. Chem. Phys., 2007, 127, 114105–114113 CrossRef PubMed
.
- J. Hutter, M. Iannuzzi, F. Schiffmann and J. VandeVondele, Wiley Interdiscip. Rev.: Comput. Mol. Sci., 2014, 4, 15–25 CAS
.
- C.-K. Skylaris, P. D. Haynes, A. A. Mostofi and M. C. Payne, J. Chem. Phys., 2005, 122, 084119–084128 CrossRef PubMed
.
- S. Mohr, L. E. Ratcliff, L. Genovese, D. Caliste, P. Boulanger, S. Goedecker and T. Deutsch, Phys. Chem. Chem. Phys., 2015, 17, 31360–31370 RSC
.
- M. W. Schmidt, K. K. Baldridge, J. A. Boatz, S. T. Elbert, M. S. Gordon, J. H. Jensen, S. Koseki, N. Matsunaga, K. A. Nguyen and S. Su, J. Comput. Chem., 1993, 14, 1347–1363 CrossRef CAS
.
- M. S. Gordon and M. W. Schmidt, J. Theor. Comput. Chem., 2005, 1167–1189 CAS
.
- H.-J. Werner, P. J. Knowles, G. Knizia, F. R. Manby and M. Schütz, Wiley Interdiscip. Rev.: Comput. Mol. Sci., 2012, 2, 242–253 CAS
.
- R. Ahlrichs, M. Bär, M. Häser, H. Horn and C. Kölmel, Chem. Phys. Lett., 1989, 162, 165–169 CrossRef CAS
.
- S. Blügel and G. Bihlmayer, Comput. nanosci.: do it yourself, 2006, vol. 31, pp. 85–129 Search PubMed
.
- J. Enkovaara, C. Rostgaard, J. J. Mortensen, J. Chen, M. Dułak, L. Ferrighi, J. Gavnholt, C. Glinsvad, V. Haikola and H. Hansen, J. Phys.: Condens. Matter, 2010, 22, 253202–253226 CrossRef CAS PubMed
.
- J. J. Mortensen, L. B. Hansen and K. W. Jacobsen, Phys. Rev. B: Condens. Matter Mater. Phys., 2005, 71, 035109–035119 CrossRef
.
- Y. Shao, Z. Gan, E. Epifanovsky, A. T. Gilbert, M. Wormit, J. Kussmann, A. W. Lange, A. Behn, J. Deng and X. Feng, Mol. Phys., 2015, 113, 184–215 CrossRef CAS
.
- A. Gulans, S. Kontur, C. Meisenbichler, D. Nabok, P. Pavone, S. Rigamonti, S. Sagmeister, U. Werner and C. Draxl, J. Phys.: Condens. Matter, 2014, 26, 363202–363225 CrossRef PubMed
.
- A. Castro, H. Appel, M. Oliveira, C. A. Rozzi, X. Andrade, F. Lorenzen, M. A. Marques, E. Gross and A. Rubio, Phys. Status Solidi B, 2006, 243, 2465–2488 CrossRef CAS
.
- X. Andrade, D. Strubbe, U. De Giovannini, A. H. Larsen, M. J. Oliveira, J. Alberdi-Rodriguez, A. Varas, I. Theophilou, N. Helbig and M. J. Verstraete, Phys. Chem. Chem. Phys., 2015, 17, 31371–31396 RSC
.
- M. A. Marques, A. Castro, G. F. Bertsch and A. Rubio, Comput. Phys. Commun., 2003, 151, 60–78 CrossRef CAS
.
- A. S. P. Gomes, A. Merzky, and L. Visscher, Int. Conf. Comput. Sci., Springer, 2006, pp. 97–104 Search PubMed
.
- A. Kokalj, Comput. Mater. Sci., 2003, 28, 155–168 CrossRef CAS
.
- S. Goedecker, W. Hellmann and T. Lenosky, Phys.
Rev. Lett., 2005, 95, 055501 CrossRef PubMed
.
- M. Weinert, G. Schneider, R. Podloucky and J. Redinger, FLAPW: applications and implementations, J. Phys.: Condens. Matter, 2009, 21(8), 084201–084204 CrossRef CAS PubMed
.
- B. Delley, J. Theor. Comput. Chem., 1995, 2, 221–254 CAS
.
- Y. J. Bomble, J. Am. Chem. Soc., 2006, 128, 3103 CrossRef CAS
.
- V. Blum, R. Gehrke, F. Hanke, P. Havu, V. Havu, X. Ren, K. Reuter and M. Scheffler, Comput. Phys. Commun., 2009, 180, 2175–2196 CrossRef CAS
.
- J. Hafner, C. Wolverton and G. Ceder, MRS Bull., 2006, 31, 659–668 CrossRef
.
- G. R. Schleder, A. C. Padilha, C. M. Acosta, M. Costa and A. Fazzio, JPhys Mater., 2019, 2, 032001–032047 CrossRef CAS
.
- X. Ma, Y. Wu, Y. Lv and Y. Zhu, J. Phys. Chem. C, 2013, 117, 26029–26039 CrossRef CAS
.
- X. Y. Deng, G. H. Liu, X. P. Jing and G. S. Tian, Int. J. Quantum Chem., 2014, 114, 468–472 CrossRef CAS
.
- P. K. Jain, S. Eustis and M. A. El-Sayed, J. Phys. Chem. B, 2006, 110, 18243–18253 CrossRef CAS PubMed
.
- R. Sinha-Roy, P. García-González, H.-C. Weissker, F. Rabilloud and A. I. Fernandez-Dominguez, ACS Photonics, 2017, 4, 1484–1493 CrossRef CAS
.
- J. M. McMahon, S. K. Gray and G. C. Schatz, Phys. Rev. Lett., 2009, 103, 097403–097406 CrossRef PubMed
.
- R. Esteban, A. G. Borisov, P. Nordlander and J. Aizpurua, Nat. Commun., 2012, 3, 1–9 Search PubMed
.
- W. Zhu, R. Esteban, A. G. Borisov, J. J. Baumberg, P. Nordlander, H. J. Lezec, J. Aizpurua and K. B. Crozier, Nat. Commun., 2016, 7, 1–14 Search PubMed
.
- S. M. Morton, D. W. Silverstein and L. Jensen, Chem. Rev., 2011, 111, 3962–3994 CrossRef CAS PubMed
.
- F. Alkan and C. M. Aikens, J. Phys. Chem. C, 2018, 122, 23639–23650 CrossRef CAS PubMed
.
- G.-T. Bae and C. M. Aikens, J. Phys. Chem. C, 2015, 119, 23127–23137 CrossRef CAS
.
- M. Stener, A. Nardelli, R. De Francesco and G. Fronzoni, J. Phys. Chem. C, 2007, 111, 11862–11871 CrossRef CAS
.
- G. Barcaro, M. Broyer, N. Durante, A. Fortunelli and M. Stener, J. Phys. Chem. C, 2011, 115, 24085–24091 CrossRef CAS
.
- C. Zeng, T. Li, A. Das, N. L. Rosi and R. Jin, J. Am. Chem. Soc., 2013, 135, 10011–10013 CrossRef CAS PubMed
.
- N. Durante, A. Fortunelli, M. Broyer and M. Stener, J. Phys. Chem. C, 2011, 115, 6277–6282 CrossRef CAS
.
- H.-C. Weissker and C. Mottet, Phys. Rev. B: Condens. Matter Mater. Phys., 2011, 84, 165443–165450 CrossRef
.
- X. López-Lozano, H. Barron, C. Mottet and H.-C. Weissker, Phys. Chem. Chem. Phys., 2014, 16, 1820–1823 RSC
.
- M. Stener, A. Nardelli, R. De Francesco and G. J. Fronzoni, J. Phys. Chem. C, 2007, 111, 11862–11871 CrossRef CAS
.
- K. Nobusada, J. Phys. Chem. B, 2004, 108, 11904–11908 CrossRef CAS
.
- H. Häkkinen, M. Walter and H. Grönbeck, J. Phys. Chem. B, 2006, 110, 9927–9931 CrossRef PubMed
.
- T. Iwasa and K. Nobusada, J. Phys. Chem. C, 2007, 111, 45–49 CrossRef CAS
.
- C. M. Aikens, J. Phys. Chem. A, 2009, 113, 10811–10817 CrossRef CAS PubMed
.
- O. Lopez-Acevedo, H. Tsunoyama, T. Tsukuda, H. Hakkinen and C. M. Aikens, J. Am. Chem. Soc., 2010, 132, 8210–8218 CrossRef CAS PubMed
.
- C. M. Aikens, J. Phys. Chem. Lett., 2010, 1, 2594–2599 CrossRef CAS
.
- K. Iida, M. Noda, K. Ishimura and K. Nobusada, J. Phys. Chem. A, 2014, 118, 11317–11322 CrossRef CAS PubMed
.
- R. W. Burgess and V. J. Keast, J. Phys. Chem. C, 2014, 118, 3194–3201 CrossRef CAS
.
- Y. Negishi, T. Nakazaki, S. Malola, S. Takano, Y. Niihori, W. Kurashige, S. Yamazoe, T. Tsukuda and H. Häkkinen, J. Am. Chem. Soc., 2015, 137, 1206–1212 CrossRef CAS PubMed
.
- G. Li and R. Jin, Acc. Chem. Res., 2013, 46, 1749–1758 CrossRef CAS PubMed
.
- F. Bickelhaupt, E. Baerends, C. F. Guerra, S. Van Gisbergen, J. Snijders and T. Ziegler, J. Comput. Chem., 2001, 22, 931–967 CrossRef
.
- M. Gerosa, J. Phys.: Condens. Matter, 2018, 30, 230301–230302 CrossRef PubMed
.
- S. Clark, J. Robertson, S. Lany and A. Zunger, Phys. Rev. B: Condens. Matter Mater. Phys., 2010, 81, 115311–115315 CrossRef
.
- P. J. Hasnip, K. Refson, M. I. Probert, J. R. Yates, S. J. Clark and C. J. Pickard, Philos. Trans. R. Soc., A, 2014, 372, 20130270–20130295 CrossRef PubMed
.
- K. Bashyal, C. K. Pyles, S. Afroosheh, A. Lamichhane and A. T. Zayak, J. Phys.: Condens. Matter, 2018, 30, 065501–065509 CrossRef PubMed
.
- M. Yaakob, N. Hussin, M. Taib, T. Kudin, O. Hassan, A. Ali and M. Yahya, Integr. Ferroelectr., 2014, 155, 15–22 CrossRef CAS
.
- A. Janotti and C. G. Van de Walle, Phys. Status Solidi B, 2011, 248, 799–804 CrossRef CAS
.
- S. S. Parhizgar and J. Beheshtian, Comput. Condens. Matter, 2018, 15, 1–6 CrossRef
.
- Q. Liping, C. Changchun, Y. Yintang, Y. Xinhai and S. Chunlei, J. Semicond., 2014, 35, 073004–073008 CrossRef
.
- B. Ul Haq, R. Ahmed, S. Goumri-Said, A. Shaari and A. Afaq, Phase Transitions, 2013, 86, 1167–1177 CrossRef CAS
.
- M. Gerosa, C. Bottani, C. Di Valentin, G. Onida and G. Pacchioni, J. Phys.: Condens. Matter, 2017, 30, 044003–044027 CrossRef PubMed
.
- M. Gerosa, C. E. Bottani, L. Caramella, G. Onida, C. Di Valentin and G. Pacchioni, Phys. Rev. B: Condens. Matter Mater. Phys., 2015, 91, 155201–155215 CrossRef
.
- M. H. Huang, S. Mao, H. Feick, H. Yan, Y. Wu, H. Kind, E. Weber, R. Russo and P. Yang, Science, 2001, 292, 1897–1899 CrossRef CAS PubMed
.
- C. Dong, C. Persson, L. Vayssieres, A. Augustsson, T. Schmitt, M. Mattesini, R. Ahuja, C. Chang and J.-H. Guo, Phys. Rev. B: Condens. Matter Mater. Phys., 2004, 70, 195325–195329 CrossRef
.
- Y. Liu, Q. Hou, H. Xu, L. Li and Y. Zhang, Phys. B, 2012, 407, 2359–2364 CrossRef CAS
.
- Y. Li, X. Zhao and W. Fan, J. Phys. Chem. C, 2011, 115, 3552–3557 CrossRef CAS
.
- G. Yao, G. Fan, F. Zhao, J. Ma, J. Chen, S. Zheng, S. Zeng, L. He and T. Zhang, Phys. B, 2012, 407, 3539–3542 CrossRef CAS
.
- D. Vogel, P. Krüger and J. Pollmann, Phys. Rev. B: Condens. Matter Mater. Phys., 1995, 52, R14316–R14319 CrossRef CAS PubMed
.
- A. Slassi, S. Naji, A. Benyoussef, M. Hamedoun and A. El Kenz, J. Alloys Compd., 2014, 605, 118–123 CrossRef CAS
.
- J.-H. Luo, Q. Liu, L.-N. Yang, Z.-Z. Sun and Z.-S. Li, Comput. Mater. Sci., 2014, 82, 70–75 CrossRef CAS
.
- K. Harun, M. K. Yaakob, M. F. M. Taib, B. Sahraoui, Z. A. Ahmad and A. A. Mohamad, Mater. Res. Express, 2017, 4, 085908–085922 CrossRef
.
- K. Harun, N. Mansor, Z. A. Ahmad and A. A. Mohamad, Procedia Chem., 2016, 19, 125–132 CrossRef CAS
.
- K. Harun, N. Mansor, M. K. Yaakob, M. F. M. Taib, Z. A. Ahmad and A. A. Mohamad, J. Sol-Gel Sci. Technol., 2016, 80, 56–67 CrossRef CAS
.
- D. Moitra, S. Dhole, B. K. Ghosh, M. Chandel, R. K. Jani, M. K. Patra, R. S. Vadera and N. N. Ghosh, J. Phys. Chem. C, 2017, 121, 21290–21304 CrossRef CAS
.
- M. Goffinet, P. Hermet, D. Bilc and P. Ghosez, Phys. Rev. B: Condens. Matter Mater. Phys., 2009, 79, 014403–014411 CrossRef
.
- T. Gujar, V. Shinde and C. Lokhande, Mater. Chem. Phys., 2007, 103, 142–146 CrossRef CAS
.
- X.-H. Zhu, X.-B. Xiao, X.-R. Chen and B.-G. Liu, RSC Adv., 2017, 7, 4054–4061 RSC
.
- F. Gao, Y. Yuan, K. Wang, X. Chen, F. Chen, J.-M. Liu and Z. Ren, Appl. Phys. Lett., 2006, 89, 102506 CrossRef
.
- J. Ihlefeld, N. Podraza, Z. Liu, R. Rai, X. Xu, T. Heeg, Y. Chen, J. Li, R. Collins and J. Musfeldt, Appl. Phys. Lett., 2008, 92, 142908–142910 CrossRef
.
- D. K. Sang, B. Wen, S. Gao, Y. Zeng, F. Meng, Z. Guo and H. Zhang, Nanomaterials, 2019, 9, 1075–1089 CrossRef CAS PubMed
.
- P. Chetri, B. Saikia and A. Choudhury, J. Appl. Phys., 2013, 113, 233514–233521 CrossRef
.
- G. Centi, Smart Mat, Wiley, 2020, pp. 1–3 Search PubMed
.
- B. K. Ghosh and N. N. Ghosh, J. Nanosci. Nanotechnol., 2018, 18, 3735–3758 CrossRef CAS PubMed
.
- N. Cheng, L. Zhang, K. Doyle-Davis and X. Sun, Electrochem. Energy Rev., 2019, 2, 539–573 CrossRef
.
- Z. Yu, H. Xu and D. Cheng, Adv. Phys.: X, 2021, 6, 1905545–1905567 Search PubMed
.
- Q. Li, Z. Ma, R. Sa, H. Adidharma, K. A. Gasem, A. G. Russell, M. Fan and K. Wu, J. Mater. Chem. A, 2017, 5, 14658–14672 RSC
.
- L. Piccolo, Z. Li, I. Demiroglu, F. Moyon, Z. Konuspayeva, G. Berhault, P. Afanasiev, W. Lefebvre, J. Yuan and R. L. Johnston, Sci. Rep., 2016, 6, 1–8 CrossRef PubMed
.
- E. M. Dietze, P. N. Plessow and F. Studt, Modeling the Size Dependency of the Stability of Metal Nanoparticles, J. Phys. Chem. C, 2019, 123(41), 25464–25469 CrossRef CAS
.
- X. Liu, B. Zhu and Y. Gao, Phys. Lett. A, 2016, 380, 1971–1975 CrossRef CAS
.
- W. Yang, J. Li, X. Cui, C. Yang, Y. Liu, X. Zeng, Z. Zhang and Q. Zhang, Chin. Chem. Lett., 2021, 32, 1–6 CrossRef
.
- X. Cui and F. Shi, Acta Phys.-Chim. Sin., 2020, 37, 2006080–2006104 Search PubMed
.
- J. K. Nørskov, T. Bligaard, J. Rossmeisl and C. H. Christensen, Nat. Chem., 2009, 1, 37–46 CrossRef PubMed
.
- B. K. Ghosh, S. Hazra and N. N. Ghosh, Catal. Commun., 2016, 80, 44–48 CrossRef CAS
.
- P. Makkar, M. Chandel, M. K. Patra and N. N. Ghosh, ACS Omega, 2019, 4, 20672–20689 CrossRef CAS PubMed
.
- N. Pradhan, A. Pal and T. Pal, Langmuir, 2001, 17, 1800–1802 CrossRef CAS
.
- M. Chandel, P. Makkar, B. K. Ghosh, D. Moitra and N. N. Ghosh, RSC Adv., 2018, 8, 37774–37788 RSC
.
- M. Chandel, D. Moitra, P. Makkar, H. Sinha, H. S. Hora and N. N. Ghosh, RSC Adv., 2018, 8, 27725–27739 RSC
.
- D. Moitra, B. K. Ghosh, M. Chandel and N. N. Ghosh, RSC Adv., 2016, 6, 97941–97952 RSC
.
- T. Aditya, A. Pal and T. Pal, Chem. Commun., 2015, 51, 9410–9431 RSC
.
- J. K. Nørskov, F. Abild-Pedersen, F. Studt and T. Bligaard, Proc. Natl. Acad. Sci. U.S.A., 2011, 108, 937–943 CrossRef PubMed
.
- L. Rout, A. Kumar, R. S. Dhaka, G. N. Reddy, S. Giri and P. Dash, Appl. Catal., A, 2017, 538, 107–122 CrossRef CAS
.
- S. Zhang, C.-R. Chang, Z.-Q. Huang, J. Li, Z. Wu, Y. Ma, Z. Zhang, Y. Wang and Y. Qu, J. Am. Chem. Soc., 2016, 138, 2629–2637 CrossRef CAS PubMed
.
- Y. Ma, X. Wu and G. Zhang, Appl. Catal., B, 2017, 205, 262–270 CrossRef CAS
.
- X. Yang, H. Fu, K. Wong, X. Jiang and A. Yu, Nanotechnology, 2013, 24, 415601 CrossRef CAS PubMed
.
- S. Chen, S. Sun, B. Lian, Y. Ma, Y. Yan and S. Hu, Surf. Sci., 2014, 620, 51–58 CrossRef CAS
.
- O. Inderwildi, S. Jenkins and D. King, Surf. Sci., 2007, 601, L103–L108 CrossRef CAS
.
- Y. Jia, C. Belin, M. Tillard, L. Lacroix-Orio, D. Zitoun and G. Feng, Inorg. Chem., 2007, 46, 4177–4186 CrossRef CAS PubMed
.
- L. Hong, H. Wang, J. Cheng, X. Huang, L. Sai and J. Zhao, Comput. Theor. Chem., 2012, 993, 36–44 CrossRef CAS
.
- M. Mavrikakis, P. Stoltze and J. K. Nørskov, Catal. Lett., 2000, 64, 101–106 CrossRef CAS
.
- L. Molina and B. Hammer, J. Chem. Phys., 2005, 123, 161104–161108 CrossRef CAS PubMed
.
- N. Lopez and J. K. Nørskov, J. Am. Chem. Soc., 2002, 124, 11262–11263 CrossRef CAS PubMed
.
- Z.-P. Liu, P. Hu and A. Alavi, J. Am. Chem. Soc., 2002, 124, 14770–14779 CrossRef CAS PubMed
.
- Z.-P. Liu, X.-Q. Gong, J. Kohanoff, C. Sanchez and P. Hu, Phys. Rev. Lett., 2003, 91, 266102 CrossRef PubMed
.
- L. Molina and B. Hammer, Phys. Rev. Lett., 2003, 90, 206102–206105 CrossRef CAS PubMed
.
- L. Molina and B. Hammer, Phys. Rev. B: Condens. Matter Mater. Phys., 2004, 69, 155424–155445 CrossRef
.
- Y. Chen, P. Crawford and P. Hu, Catal. Lett., 2007, 119, 21–28 CrossRef CAS
.
- A. Sanchez, S. Abbet, U. Heiz, W.-D. Schneider, H. Häkkinen, R. Barnett and U. Landman, J. Phys. Chem. A, 1999, 103, 9573–9578 CrossRef CAS
.
- G. Mills, M. S. Gordon and H. Metiu, J. Chem. Phys., 2003, 118, 4198–4205 CrossRef CAS
.
- Y. Xu and M. Mavrikakis, J. Phys. Chem. B, 2003, 107, 9298–9307 CrossRef CAS
.
- N. U. Zhanpeisov and H. Fukumura, J. Phys. Chem. C, 2007, 111, 16941–16945 CrossRef CAS
.
- B. K. Min and C. M. Friend, Chem. Rev., 2007, 107, 2709–2724 CrossRef CAS PubMed
.
- S. H. Kim, Curr. Appl. Phys., 2018, 18, 810–818 CrossRef
.
- C. Song, Q. Ge and L. Wang, J. Phys. Chem. B, 2005, 109, 22341–22350 CrossRef CAS PubMed
.
- H.-T. Chen, J.-G. Chang, S.-P. Ju and H.-L. Chen, J. Phys. Chem. Lett., 2010, 1, 739–742 CrossRef CAS
.
- C. I. Oprea and M. A. Gîru, Nanomaterials, 2019, 9, 357–388 CrossRef CAS PubMed
.
- D. W. Boukhvalov, D. R. Dreyer, C. W. Bielawski and Y. W. Son, ChemCatChem, 2012, 4, 1844–1849 CrossRef CAS
.
- L. Zhu, Y. Liu, X. Peng, Y. Li, Y.-L. Men, P. Liu and Y.-X. Pan, ACS Appl. Mater. Interfaces, 2020, 12, 12892–12900 CrossRef PubMed
.
- D. Wang, X. Song, P. Li, X. J. Gao and X. Gao, J. Mater. Chem. B, 2020, 8, 9028–9034 RSC
.
- C. Gong, L. Geunsik, B. Shan, E. M. Vogel, R. M. Wallace and K. Cho, J. Appl. Phys., 2010, 108, 123711–123718 CrossRef
.
- J. Vazquez-Arenas, G. Ramos-Sanchez and A. A. Franco, J. Power Sources, 2016, 328, 492–502 CrossRef CAS
.
- S. Zhang, Y. Liu, P. Gu, R. Ma, T. Wen, G. Zhao, L. Li, Y. Ai, C. Hu and X. Wang, Appl. Catal., B, 2019, 248, 1–10 CrossRef CAS
.
- S. Bedanta, A. Barman, W. Kleemann, O. Petracic and T. Seki, J. Nanomater., 2013, 2013, 1–22 Search PubMed
.
- A. Viola, J. Peron, K. Kazmierczak, M. Giraud, C. Michel, L. Sicard, N. Perret, P. Beaunier, M. Sicard and M. Besson, Unsupported shaped cobalt nanoparticles as efficient and recyclable catalysts for the solvent-free acceptorless dehydrogenation of alcohols, Catal. Sci. Technol., 2018, 8(2), 562–572 RSC
.
- J. B. Souza Jr and L. C. Varanda, Nanotechnology, 2018, 29, 065604–065619 CrossRef PubMed
.
- A. Akbarzadeh, M. Samiei and S. Davaran, Nanoscale Res. Lett., 2012, 7, 144–156 CrossRef PubMed
.
- J. A. De Toro, D. P. Marques, P. Muñiz, V. Skumryev, J. Sort, D. Givord and J. Nogués, Phys. Rev. Lett., 2015, 115, 057201–057206 CrossRef PubMed
.
- A. Kotoulas, C. Dendrinou-Samara, C. Sarafidis, T. Kehagias, J. Arvanitidis, G. Vourlias, M. Angelakeris and O. Kalogirou, J. Nanopart. Res., 2017, 19, 399–412 CrossRef
.
- S. M. Yakout, J. Supercond. Novel Magn., 2020, 33, 2557–2580 CrossRef CAS
.
- W. Wang, W. Sun, G. Zhang, F. Ren, Y. Wang, C. You and Z. Cheng, J. Adv. Res., 2020, 24, 371–377 CrossRef CAS PubMed
.
- J. R. Eone II, O. M. Bengone and C. Goyhenex, J. Phys. Chem. C, 2019, 123, 4531–4539 CrossRef CAS
.
- C. P. Huelmo, M. G. Menezes, R. B. Capaz and P. A. Denis, Phys. Chem. Chem. Phys., 2020, 22, 16096–16106 RSC
.
- L. Li, R. Huang, Y. Wen and R. L. Johnston, J. Magn. Magn. Mater., 2020, 503, 166651–166659 CrossRef CAS
.
- S. Mehmood, Z. Ali, I. Khan and I. Ahmad, J. Electron. Mater., 2020, 20, 1–11 Search PubMed
.
- F. B. Texca, E. Chigo-Anota, L. T. Carrillo and M. Castro, J. Theor. Comput. Chem., 2017, 1103, 1–10 CrossRef
.
- Y. Yang, K. Jermsittiparsert, W. Gao and D. Zhang, Appl. Surf. Sci., 2020, 517, 146179 CrossRef CAS
.
- B. A. Davis, B. Chakraborty, N. Kalarikkal and L. M. Ramaniah, J. Magn. Magn. Mater., 2020, 502, 166503–166510 CrossRef CAS
.
- M. Bououdina, S. Azzaza, R. Ghomri, M. N. Shaikh, J. Dai, Y. Song, W. Song, W. Cai and M. Ghers, RSC Adv., 2017, 7, 32931–32941 RSC
.
- B. Kisan, J. Kumar, S. Padmanapan and P. Alagarsamy, Phys. B, 2020, 593, 412319–412325 CrossRef CAS
.
- J. Thakur, H. S. Saini, M. Singh, A. Reshak and M. K. Kashyap, Phys. E, 2016, 78, 35–40 CrossRef CAS
.
- O. Dyck, S. Kim, S. V. Kalinin and S. Jesse, Appl. Phys. Lett., 2017, 111, 113104–113110 CrossRef
.
- O. Dyck, M. Yoon, L. Zhang, A. R. Lupini, J. L. Swett and S. Jesse, ACS Appl. Nano Mater., 2020, 3, 10855–10863 CrossRef CAS
.
- O. Dyck, L. Zhang, M. Yoon, J. L. Swett, D. Hensley, C. Zhang, P. D. Rack, J. D. Fowlkes, A. R. Lupini and S. Jesse, Carbon, 2021, 173, 205–214 CrossRef CAS
.
- A. P. Durajski, A. E. Auguscik and R. Szczśniak, Phys. E, 2020, 119, 113985–113989 CrossRef CAS
.
- S. K. Abdel-Aal, A. E. Aly, H. M. Chanduví, A. V. G. Rebaza, E. Atteia and A. Shankar, Chem. Phys., 2020, 538, 110874–110879 CrossRef CAS
.
- X.-D. Zhou, L. Pederson, Q. Cai, J. Yang, B. Scarfino, M. Kim, W. Yelon, W. James, H. Anderson and C. Wang, J. Appl. Phys., 2006, 99, 08M918–08M920 CrossRef
.
- W. Koehler and E. Wollan, J. Phys. Chem. Solids, 1957, 2, 100–106 CrossRef CAS
.
- R. Köferstein, L. Jäger and S. G. Ebbinghaus, Solid State Ionics, 2013, 249, 1–5 CrossRef
.
- D. O. Idisi, J. A. Oke, E. M. Benecha, S. J. Moloi and S. C. Ray, Mater. Today: Proc., 2020, 1–7 Search PubMed
.
- K. Burke, J. Chem. Phys., 2012, 136, 150901–150909 CrossRef
.
- P. Verma and D. G. Truhlar, Trends Chem., 2020, 2, 302–318 CrossRef CAS
.
- A. J. Cohen, P. Mori-Sánchez and W. Yang, Chem. Rev., 2012, 112, 289–320 CrossRef CAS PubMed
.
| This journal is © The Royal Society of Chemistry 2021 |

