 Open Access Article
Creative Commons Attribution 3.0 Unported Licence
In situ total scattering experiments of nucleation and crystallisation of tantalum-based oxides: from highly dilute solutions via cluster formation to nanoparticles†
Ezgi
Onur Şahin
 a,
Harun
Tüysüz
a,
Candace K.
Chan
a,
Harun
Tüysüz
a,
Candace K.
Chan
 ab,
Gun-hee
Moon
 a,
Yitao
Dai
a,
Wolfgang
Schmidt
a,
Yitao
Dai
a,
Wolfgang
Schmidt
 a,
Joohyun
Lim
c,
Christina
Scheu
c and
Claudia
Weidenthaler
 *a
*a
aMax-Planck-Institut für Kohlenforschung, Kaiser-Wilhelm-Platz 1, D-45470 Mülheim an der Ruhr, Germany. E-mail: weidenthaler@mpi-muelheim.mpg.de
bMaterials Science and Engineering, School for Engineering of Matter, Transport and Energy (SEMTE), Arizona State University, Tempe, AZ 85287-8706, USA
cMax-Planck-Institut für Eisenforschung, Max-Planck-Straße 1, D-40237 Düsseldorf, Germany
First published on 25th November 2020
Abstract
The exact formation mechanism of tantalum oxides (and in general, metal/mixed metal oxides) from alkoxide precursors is still not fully understood, particularly when forming cluster-like or amorphous materials. The structural evolution of Ta-based oxides was studied in detail using X-ray total scattering experiments along with subsequent pair distribution function (PDF) analyses. Starting from a tantalum alkoxide precursor (Ta2(OEt)10), the formation of hydrolysed TaxOyHz clusters in highly diluted aqueous solution was analysed. From the PDF data, the connectivity and arrangement of TaxOy octahedra in the cluster could be deduced as well as the approximate size of the clusters (<1 nm). Construction of cluster models allowed for identification of common structural motifs in the TaxOyHz clusters, ruling out the formation of chain- or ring-like clusters. More likely, bulky clusters with a high number of corner-sharing octahedra are formed. After separation of the amorphous solid from the liquid, temperature-induced crystallisation processes were monitored via in situ total scattering experiments. Between room temperature and 600 °C, only small rearrangements of the amorphous structure are observed. At about 610 °C, amorphous TaxOyHz transforms directly into crystalline orthorhombic L-Ta2O5 without formation of any crystalline intermediate structures.
Introduction
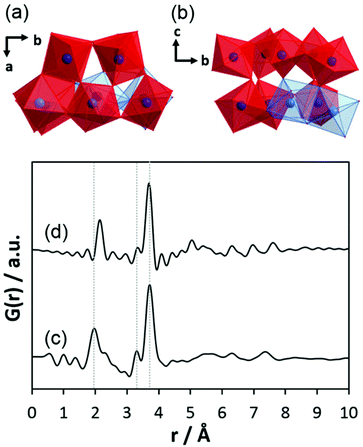
Tantalum oxide (Ta2O5) has remarkable properties and is used in applications as varying as electronics, nano-coatings, catalysis, medical research, and biotechnology.1,2 As a wide-bandgap semiconductor, it can be used in microelectronics (micro-capacitors, resistive switches)3 or as a photocatalyst for solar water splitting.4–6 Due to the ability of tantalum to adopt various oxidation states, tantalum oxide is redox-active7 and its moderately acidic8 surface allows for its use as a catalyst. Finally, tantalum oxide is thermally very stable and therefore used for coatings and refractory materials.9There are a number of crystal structures reported, some controversially, for Ta2O5 with various space groups and unit cell dimensions.10 Several polymorphs have been reported which, in principle, can be divided into low-temperature (L-Ta2O5) and high-temperature (H-Ta2O5) structures.11 Some properties of crystalline tantalum oxide polymorphs are related to oxygen vacancies within the crystal structure.12 Stephenson and Roth13 proposed an orthorhombic structure for L-Ta2O5 with 22 tantalum and 55 oxygen atoms in the unit cell and a large number of oxygen vacancies. The structure is highly disordered, with tantalum atoms arranged in layers (Fig. 1a). The oxygen atoms coordinate to tantalum forming either distorted octahedra or pentagonal bipyramids that share either corners or edges (Fig. 1b). Aleshina and Loginova14 observed a vacancy-free orthorhombic structure (β-Ta2O5) with octahedra connected via common edges forming layers, which are also connected via shared corners (Fig. 1c).
 | ||
| Fig. 1 (a) Layers in the orthorhombic crystal structure of L-Ta2O5,13 (b) connectivity of distorted polyhedra in L-Ta2O5, and (c) orthorhombic crystal structure of β-Ta2O5.14 | ||
Beside these structures, hexagonal δ-Ta2O5 was discussed as the structure observed in thin films.15,16 At 1320 °C, L-Ta2O5 undergoes a phase transformation to H-Ta2O5 for which also different structure polymorphs are described.17
In addition to the crystalline tantalum oxides, amorphous forms have been studied intensively.18 Films made of amorphous tantalum oxide have high thermal stability and a high refractive index. Therefore, they are applicable as antireflection coatings for silicon solar cells and as interference filters.19 Amorphous tantalum oxides with high surface area show higher activity for photocatalytic water splitting than their crystalline counterparts.20,21 Many reports on amorphous metal oxides and sulphides show that they are very active catalysts for not only water splitting,4,6,21–26 but also electrocatalytic nitrogen reduction for NH3 production27 and conversion of biomass.28 Unfortunately, not much structural information can be discerned from amorphous materials using conventional X-ray diffraction (XRD) methods, where only the Bragg reflections resulting from diffraction of periodic atomic arrangements in crystalline structures are analysed. Small-angle scattering may provide useful information on the size and shape of particles, but does not provide information on the local structure of the non-crystalline materials. The study of amorphous structures thus requires alternative analytical methods, among which total scattering and subsequent pair distribution function (PDF) analysis play a key role.29 In contrast to conventional structure analysis from diffraction data, PDF analysis considers the total X-ray scattering intensity, including Bragg reflections and diffuse scattering, both containing information about the local structure of solids. From these data, atomic correlations can be determined via Fourier analysis from molecular species as well as from amorphous or crystalline solids. For the determination of local structures of amorphous solid catalysts via PDF analysis, high-energy synchrotron radiation is preferentially used. A complementary tool for local structure analysis is extended X-ray absorption spectroscopy (EXAFS). However, with EXAFS one can only analyse the neighbourhood of one specific element at a time. In contrast, PDF obtained from total scattering data represents all possible atom pair distances simultaneously (except for hydrogen in case of X-ray data). Another difference between both methods is the length scale on which interatomic distances can be evaluated. While information from EXAFS is limited to the first coordination shells,30 total scattering provides information about all coordination shells within all particles, from small molecular species to large three-dimensional crystalline compounds.
Already at the beginning of the last century, local structures of liquids were investigated by X-ray scattering.31 Local structure analyses of water and different alcohols have been performed by PDF analysis.32–39 A more difficult task is the structural analysis of solids dispersed in solutions, especially if highly diluted suspensions are investigated. Terban et al. investigated nanoparticles of an unnamed pharmaceutical compound in aqueous solution and determined a detection limit of about 0.25 wt%.40 Even though the concentration of the nanoparticles in the solution was low, the analysis was feasible due to the size of the crystalline domains of about 20 nm, which is reasonably large for PDF analysis. Zobel et al. reported PDF studies on the interaction of solvent molecules with colloidal nanoparticles.41 The study demonstrates how different alcohols restructure on the surface of nanoparticles. Iversen and co-workers studied the hydrothermal synthesis of titanium oxide nanoparticles in aqueous solution monitored by in situ total scattering experiments.42 They demonstrated that the structures of the products depend on the reaction temperature and precursor concentration. Thus, in situ studies provide valuable insights in the early stages of nucleation and crystallisation of solids and help to establish formation mechanisms.
In this work, we use total scattering experiments to investigate the formation of amorphous tantalum oxide structures, which were shown in previous studies to display high photocatalytic activity.20 Starting with the molecular precursor tantalum(V) ethoxide (Ta2(OEt)10), the structural progression to amorphous TaxOy by hydrolysis in highly dilute solutions was monitored. To accomplish this, total scattering experiments with synchrotron radiation, either ex situ (capillaries filled with suspensions) or in situ (capillary flow cell) were performed. Even though photocatalysis is not in the focus of this publication, we tried to keep, as close as possible, the same synthesis conditions used for preparation of the aforementioned amorphous photocatalysts. The same reactor described by Grewe and Tüysüz20 for the photocatalyst synthesis was used here for in situ experiments. This enables operando studies on the structure evolution of the amorphous tantalum oxide (TaxOy) during hydrolysis, condensation, and polycondensation of the precursor. Then, the solid fractions within the tantalum-containing suspensions were consecutively separated and dried for crystallisation experiments. The crystallisation path of the amorphous compounds to form crystalline Ta2O5 was monitored by in situ temperature-dependent total scattering experiments in combination with PDF analysis.
Results and discussion
Total scattering analysis of species in dilute systems is demanding and requires careful evaluation of all parameters that may affect the data analysis. The structure of hydrolysed tantalum ethoxide in the solvent will be discussed herein. Therefore, the pure solvent was analysed first to evaluate the quality of the measured data. For assessing the influence of the experimental setup, total scattering data were collected from a mixture of 10 vol% methanol in water under flowing and static conditions. As shown in Fig. S1,† the respective PDF data are identical up to 5.5 Å and exhibit features typical for a water–methanol solution.43 The outcome of the data analysis shows that the quality of the PDF data is not affected by the two experimental settings. The main distance between r = 2.3–3.0 Å represents the average O–O distances in the water–methanol mixture. The presence of maxima between r ≈ 4.0–4.7 Å is attributed to the hydrogen bond network between the water molecules.44 An early work of Zachariasen on the structure of liquid methanol via analysis with radial distribution function revealed a distance of ∼4.1 Å belonging to adjacent methanol molecules.33 However, as mentioned in this early paper, it can be expected that neighbour molecules are constantly changing positions. Based on theoretical calculations and neutron scattering data of different water–methanol mixtures, broad features between 5.5 and 8 Å were discussed as intermolecular solvent–solvent (methanol–water) coordination shells.44 At higher r-values, the positions of the correlation pairs in the experimental PDFs in Fig. S1† still coincide but their absolute intensities differ slightly. However, theoretical calculations reveal that the assignment of such correlation pairs is quite difficult and any further interpretation might be highly speculative.Having established the PDF features originating from the water/methanol solvent, local structure analysis was performed on:
(a) Pure molecular tantalum ethoxide precursor, Ta2(OEt)10 (ex situ total scattering experiments performed at room temperature).
(b) Hydrolysed tantalum ethoxide (h-TaxOyHz) in highly dilute water–methanol suspensions (ex situ measurements at static conditions and in situ total scattering experiments under flow conditions).
(c) Amorphous solid obtained after separation of the hydrolysed solid and subsequent drying, d-TaxOy (ex situ total scattering experiments performed at room temperature).
(d) Temperature-dependent evolution of the local structure from the amorphous solid to crystalline tantalum oxide, L-Ta2O5 (in situ total scattering experiments upon heating).
In the following, we use the prefixes h and d in lower case letters to indicate hydrolysed and dried samples. Capital letters H and L are used to indicate high-temperature and low-temperature crystal structures.
Local structure of pure Ta2(OEt)10 precursor
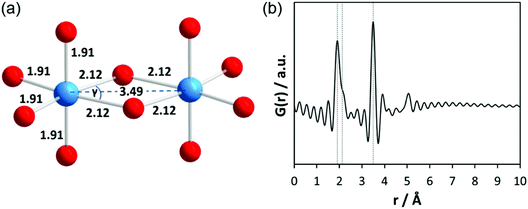
First, total scattering experiments of pure liquid Ta2(OEt)10 filled in a glass capillary were performed under static conditions. Based on ebullioscopic measurements, infrared (IR) spectra, and nuclear magnetic resonance (NMR) studies, the molecular precursor structure has been reported to consist of two edge-sharing TaO6 octahedra (bioctahedral units) with bridging μ-OEt ligands forming a dimer (Fig. 2a).45,46 Krishnan et al. performed EXAFS and Raman measurements on pure Ta2(OEt)10 and its hydrolysed form.47 The authors mention that due to the short lifetime of the photoelectrons, the maximum range of interatomic distances around the Ta atom which can be investigated by EXAFS is about 5 Å. Structural parameters for pure Ta2(OEt)10 were determined from experimental and theoretical EXAFS functions using a four-shell model. The first distance at 1.91 Å belongs to four Ta–O atom pairs within the octahedron; the second one at 2.12 Å belongs to two Ta–O atom pairs within the octahedron. These longer bonds arise from the oxygen atoms which are shared between both tantalum atoms. The distance at 3.07 Å was assigned to Ta–C and the fourth comprises a single Ta–Ta distance at 3.49 Å. This atomic arrangement results in slightly distorted octahedra with the O–Ta–O angle γ ≈ 62°. The EXAFS data confirm the dimeric structure of tantalum ethoxide with 6-fold coordination around each tantalum atom. The calculated PDF based on the dimeric structure without carbon atoms is provided in Fig. 2b. Termination ripples appear in the calculated PDF because the selected Qmax range for the calculated PDF is identical to the experimental data.The experimental PDF corresponding to Ta2(OEt)10 in Fig. 3a shows broad maxima at ∼2 Å and 3.5 Å. At larger distances, no significant peaks are observed above ∼4 Å. The first maximum corresponds to Ta–O distances within the TaO6 octahedra. According to Krishnan et al.,47 the larger distance at 3.49 Å is explained by Ta–Ta distances between the two octahedral units. A shoulder to this peak at 3.23 Å is assigned to Ta–C distances. The experimental PDF confirms the molecular model developed from NMR, IR, Raman, and EXAFS experiments.46,47
Local structure of h-TaxOyHz
In a second experiment, in situ X-ray scattering data were collected in a flow cell. The same glass reactor, which is usually used for synthesis and photocatalytic experiments, was filled with 200 mL of solution (180 mL water, 20 mL methanol) (Fig. S2†). 472 μL of Ta2(OEt)10 were injected into the solvent mixture, resulting in a 0.2 wt% TaxOy suspension. Immediately after injection, the initially transparent solution turned milky due to the formation of hydrolysed h-TaxOyHz. The suspension forming in the glass reactor was then inspected with synchrotron X-ray radiation.Even though tantalum has a very high scattering factor, the scattering curve is clearly dominated by the contribution of the solvent (Fig. S3†) due to the low concentration of the tantalum. Careful background treatment is crucial for such highly dilute systems. The program PDFgetX3,48 which was used for generating the PDFs from the scattering data, worked quite well also for data in which the background contribution dominated the total scattering intensities.40,49 The background was determined by measuring scattering curves of the glass capillary containing the solvent. The background intensities were then scaled to the measured intensities containing scattering contributions from the capillary filled with solution and metal oxide precursor. After subtraction of the scaled background, the respective PDFs were obtained.
For comparison, scattering data were measured from suspensions in capillaries (static) and in the flow cell. The respective F(Q) functions are shown in Fig. S4† and the respective PDF curves in Fig. S5.† Even though the PDF curves obtained from flowing suspensions are slightly noisier than those measured under static conditions, the main structural features are visible. On this basis, the experimental setup is suitable for in situ total scattering experiments of highly dilute suspensions. Consistency of the data obtained from flow experiments was verified by comparison of PDFs obtained from data collected at different synchrotron sources, i.e. Diamond Light Source and European Synchrotron Radiation Facility (ESRF) (Fig. S6†).
Before discussing the results of our experiments, existing information on similar systems will be briefly summarised. After controlled hydrolysis of tantalum ethoxide in mixed alcohol-toluene solutions, Abrahams et al. isolated crystals for single-crystal structure analysis.50 In the crystalline structure, the bioctahedral units of Ta2(OEt)10 transform to [Ta8(μ3-O)2(μ-O)8(μ-OEt)6(OEt)14] entities which are composed of two trinuclear units. For simplicity, that structure will be referred to as Ta8O10(OEt)20 hereafter. The crystal structure without the coordinating alcohol molecules is shown in Fig. 4a. The trinuclear units consist of three edge-sharing octahedra, Ta3(μ3-O)-(μ-OEt)3(OEt)5 (blue octahedra). Two octahedra, Ta(μ-O)4(OEt)2 (red octahedra), connect them via shared corners to the next trinuclear unit. The corresponding simulated PDF is shown in Fig. 4b. The Ta–Ta distance between edge-sharing octahedra is labelled as Tae–Tae while the distance between edge and corner-sharing octahedra is labelled Tac–Tae. Tac–Tae distances are longer than Tae–Tae distances and therefore the Ta–O distances within the different octahedra are different in length. The results reported by Abrahams et al.50 reflect the situation for the crystalline state of partially hydrolysed tantalum ethoxide in a non-aqueous solvent, a condition that is very different to the system studied in this work. The structural features therefore cannot be expected to be exactly identical to those observed in aqueous solutions. However, these clusters may form as transient intermediates and thus may act as precursors for the clusters observed here.
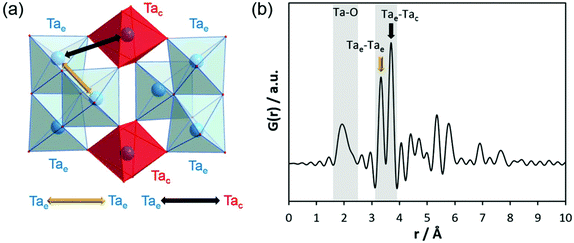 | ||
| Fig. 4 (a) Model of connected trinuclear units [Ta8(μ3-O)2(μ-O)8(μ-OEt)6(OEt)14], based on crystal structure data published for tantalum ethoxide hydrolysed in alcohol by Abrahams et al.50 and (b) simulated PDF of that structure. | ||
Krishnan et al. investigated the local structure of tantalum ethoxide hydrolysed in water by EXAFS and Raman spectroscopy.47 They observed a remarkable shortening of the Ta–Ta distance resulting from the condensation process. However, beside Ta–O distances at 1.91 and 2.01 Å, they could detect only one Ta–Ta distance at 3.37 Å. In addition, the EXAFS data level out already at ∼4 Å. Therefore, pair correlations above ∼4 Å cannot be addressed by EXAFS.
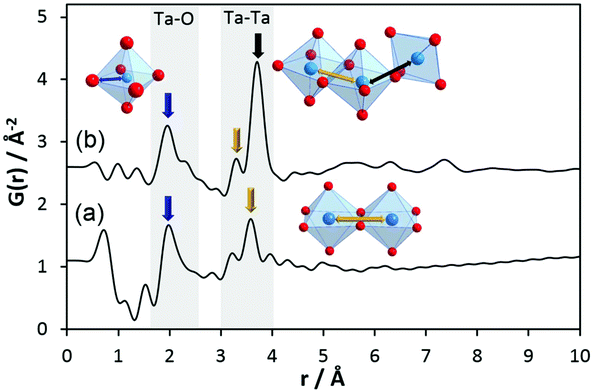
To obtain information on pair correlations of hydrolysed tantalum ethoxide with r-values above 4 Å, we inspected experimental PDFs of h-TaxOyHz. The PDF of the hydrolysed material clearly differs from that of the Ta2(OEt)10 precursor as shown in Fig. 3b. The PDF reveals that only short-range order below 10 Å exists for h-TaxOyHz in aqueous suspension. The PDF also reveals small peaks below 1.6 Å. These are attributed to termination ripples in the Fourier transform resulting from the finite Q range51 and have no physical meaning. The first signals centred at 1.96 Å and a shoulder around 2.31 Å are assigned to Ta–O distances. Signals at 3.3–3.7 Å belong to Ta–Ta distances between adjacent octahedra. The relative intensity ratio of the Ta–O peak to the Ta–Ta peak changes significantly during hydrolysis. While the peak intensities for both distances are almost equal for the Ta2(OEt)10 precursor, the Ta–Ta distances become more dominant for h-TaxOyHz, indicating that they are more frequently observed in the hydrolysed structure. During hydrolysis, the ethoxy groups leave the structure as ethanol, thus allowing more Ta–O connections. After the elimination of the ethoxy groups, medium range-ordered units form which are preserved. Weak pair correlations at 2.7–2.9 Å are assigned to O–O distances, either from oxygen pairs in edge-sharing or corner-sharing octahedra.
One major change in the PDF observed upon hydrolysis of Ta2(OEt)10 is the shift of the Tae–Tae distance from 3.5 Å in Ta2(OEt)10 to 3.3 Å in h-TaxOyHz as the result of the release of ethoxy groups from the dimer and condensation of the newly formed hydroxyl groups. A second major change is the emergence of the signal at a distance of 3.7 Å, corresponding to Tae–Tac distances in corner-sharing octahedra. The intensity of that signal is significantly higher than that of the signal at 3.3 Å. The number of Tae–Tac distances in corner-sharing octahedra is significantly higher than that of Tae–Tae distances in edge-sharing octahedra. This indicates a change of structure units from isolated edge-sharing bioctahedra in Ta2(OEt)10 to larger structural units in h-TaxOyHz which also contain a significant number of corner-sharing polyhedra.
These data show that during hydrolysis, the tantalum ethoxide octahedra start to react in aqueous solution and the dimers transform into structural units which, at first glance, seem to be similar to those observed in Ta8O10(OEt)20. Thus, the amorphous tantalum oxide h-TaxOyHz can be described as small clusters consisting of a very limited number of octahedra (no medium- to long-range order). The sizes of these clusters do not exceed 10 Å. The majority of the octahedra are connected via shared corners accompanied by a few edge-sharing octahedra. It must be emphasised that not necessarily all clusters may have exactly the identical number and arrangement of octahedra.
The comparison of the experimental PDF obtained for h-TaxOyHz (Fig. 5a) with the PDF calculated from the non-distorted, vacancy-free β-Ta2O5 structure14 (Fig. 5b) immediately shows that there is not much agreement between both structures. The calculated PDF shows some similarities to the L-Ta2O5 structure13 published by Stephenson and Roth, especially in the short-distance range (Fig. 5c), but the experimental PDF of h-TaxOyHz cannot be fully explained by the L-Ta2O5 structure. The Ta–O pair correlations within the octahedra for h-TaxOyHz appear at the same r-values as those calculated in the L-Ta2O5 structure. However, the Ta–Ta atom pairs belonging to edge-sharing as well as corner-sharing octahedra appear at slightly different distances, indicating variations in the local structures. Most significant is the presence of a pair correlation at ∼4.2 Å observed for the PDF calculated for L-Ta2O5. That pair correlation is caused by Ta–O atom pairs formed between the layers shown in Fig. 1a. These correlations are missing in the experimental PDF, indicating that the hydrolysed h-TaxOyHz does not contain clusters consisting of extended layered units arranged in an ordered manner. Pair correlations observed for the experimental PDF at about 6.2 and 7.4 Å are also present in the simulated PDF of L-Ta2O5. Such distances correspond to Ta–Ta pairs between next-nearest octahedra within one layer of L-Ta2O5. Transferring this information to the hydrolysed structure, one can conclude that the h-TaxOyHz clusters are built by several connected octahedra. However, the h-TaxOyHz PDF does not show pronounced ordering in the mid-range, and long-range order is missing completely. Therefore, the structure of L-Ta2O5 was cut into smaller clusters and PDFs were calculated. As Fig. S7† shows, none of the cluster models can explain the experimental PDF. Next, the experimental PDF was compared to the PDF based on Abrahams’ structure.50 Careful inspection reveals that the measured PDF cannot be fully explained by clusters of the trinuclear units (Fig. 5d). The intensity of the Tae–Tae atom pair correlation in the experimental PDF is significantly lower than that resulting from the Abrahams’ model. This indicates that the number of edge-sharing octahedra in the experimental structure is lower while the number of only corner-sharing octahedra is higher. Additionally, the pair correlations above 4 Å resulting from the Abrahams’ model are not observed for the experimental PDF.
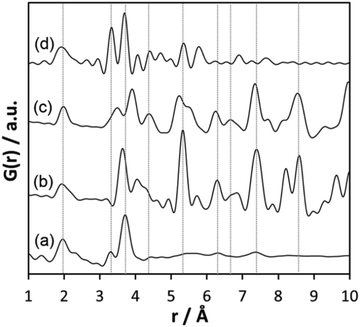 | ||
| Fig. 5 (a) Experimental PDF obtained from h-TaxOyHz, (b) simulated PDF of β-Ta2O5,14 (c) simulated PDF of L-Ta2O5 structure,13 (d) simulated PDF based on Abrahams’ structure of Ta8O10(OEt)20.50 | ||
Since none of the PDFs calculated from these structure models match the experimental data satisfactorily, we constructed cluster models and compared their simulated PDFs to the experimental data. For proper ab initio simulation of potential species via DFT calculations, the interaction of species in solution with solvent molecules needs consideration. In addition, the calculations must reflect the state of the species at ambient temperatures. Calculations including interaction with the solvent molecules and non-zero Kelvin temperatures are highly demanding and very cost-intensive from a computational point of view. Therefore, we have restricted ourselves to comparing our experimental PDFs to simulated PDFs based on simple theoretical clusters or structural motifs, starting from two edge-sharing octahedra (binuclear unit) as the basic element. To one such binuclear unit, different numbers of octahedra were then connected via joint corners, resulting in chain-like clusters. The calculated PDFs of these models show that the intensities of the Ta–O pair correlations at ∼2 Å within the octahedra becomes too high, indicating that the total number of octahedra is too large (Fig. S8†). The local structure of hydrolysed h-TaxOyHz apparently consists of octahedra with higher connectivity, i.e. with a larger number of corner-sharing octahedra. In a second approach, two binuclear units were connected by octahedra in such a way that more ring-like clusters are created. Also, for some of these structures, the peaks for the Ta–O atom pairs become either too high in intensity or pair correlations above 4 Å are generated, which are not observed for the experimental PDF (Fig. S9†). Models similar to the structure of Abrahams, i.e. two binuclear octahedral units connected via shared corners, result in decreasing intensities for the Tae–Tae and Ta–O atom pairs. However, the atom pair correlation generated above 4 Å does not show up in the experimental PDF (Fig. S10†). Instead of distinct peaks, the PDF of h-TaxOyHz shows a broad hump at distances between 4.5 and 5.5 Å which could be related to Ta–Ta distances as observed between the two trinuclear units of Ta8O10(OEt)20. There are also some relatively sharp features around 6.3 and 7.4 Å (Fig. S10†). These could be explained by Ta–Ta pairs between adjacent layers of octahedral units as observed in PDFs of cluster models based on the crystal structure of L-Ta2O5. At that point of our work, one model consisting of six octahedra, two of which are edge-sharing, gives a reasonable match to the simulated and experimental PDFs (Fig. S11†). There is an obvious mismatch at larger distances, indicating that this model is only a rough estimate.
In summary, the PDFs of the cluster models explain some of the features that are observed in the experimental PDFs. A relatively low-intensity Ta–O correlation at about 2 Å indicates a high connectivity of octahedral units. The presence of a Ta–Ta correlation at 3.3 Å indicates the existence of corner-sharing octahedra, but the number of such units is small as indicated by the low intensity of that correlation. The significantly higher intensity of the Ta–Ta correlation at 3.7 Å can only be explained by a larger number of edge-sharing octahedra. Extended chain-like structures, as proposed by Shyam et al.,52 cannot be present. The presence of chains would result in exceedingly high intensities of Ta–O correlations. That is not observed in the experimental PDF. Also, sheet-like structures are unlikely because typical correlations for such structures are missing. Thus, a highly interconnected cluster model, consisting of two corner-sharing octahedra, which are further connected to each other via a distorted ring-like arrangement of four additional edge-sharing octahedra, seems to be a relatively good description of the structural features observed in h-TaxOyHz at this point.
Finally, it should be noted that, once the h-TaxOyHz clusters are formed, they do not change with extended reaction time, as seen in time-dependent total scattering measurements. From the PDF results obtained by merging 10 data sets (in I(Q)) after 25 and 45 min (Fig. S12a†), one can conclude that the h-TaxOyHz units formed after injection and hydrolysis remain stable in solution for at least 45 min. Fig. S12b† shows the effect of merging 10 data sets at different times in comparison to individual data sets. Merging data sets results in reduction of ripples in the PDFs.
Characterisation of amorphous d-TaxOy by PDF analysis, transmission electron microscopy, gas adsorption, and dynamic light scattering
To investigate whether the structure units observed in hydrolysed h-TaxOyHz in suspension are maintained when it is dried into a powder, h-TaxOyHz was separated from the solvent and dried at 60 °C (further referred to as d-TaxOy). This procedure follows the preparation method for the amorphous tantalum oxide photocatalysts described by Grewe and Tüysüz.20 Comparison of the PDFs for h-TaxOyHz and d-TaxOy reveals that they are identical within experimental accuracy (Fig. S13†). Removal of the solvent and drying does not significantly affect the structure units in a way that can be proven by PDF analysis. The dried sample d-TaxOy was characterised and further used for crystallisation experiments discussed below.Transmission electron microscopy (TEM) was used for investigating the morphology and microstructure of d-TaxOy. Aggregation and agglomeration of the clusters during drying results in larger particles, as shown in Fig. S14† for a dried sample. The images reveal aggregated particles with sizes of several hundreds of nanometers. At higher magnification (Fig. 6), one can identify the lack of long-range order within individual particles (no lattice fringes or stacks of atoms visible). However, high-resolution TEM reveals smaller units with a certain regularity of atomic arrangements at the outer rim of the particles. These units have sizes in the range of about 1 nm, likely corresponding to the size of the tantalum oxide clusters obtained from PDF. These features are only visible at the very thin sections at the outer rim of the particles (Fig. 6, marked by ovals). Since a TEM image represents a projection through a given particle, the overlay of a multitude of such clusters results in a blurred image that does not reveal the existence of that ordered arrangement on the nanometer scale.
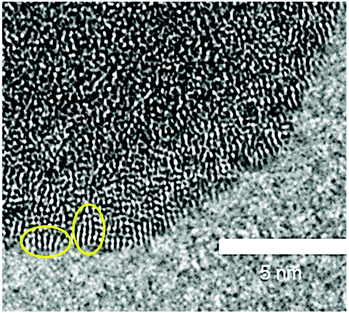 | ||
| Fig. 6 High-resolution TEM image of d-TaxOy. Small units showing a certain regularity are encircled. | ||
With nitrogen sorption analysis, a specific surface area of the sample of 43 m2 g−1 was determined, corresponding to nanoparticles with sizes of about 17 nm. This indicates that the clusters are closely attached, thus not allowing access of nitrogen molecules to the surface of the clusters. To investigate whether such particles are already formed in the suspension, dynamic light scattering (DLS) experiments were performed. The data obtained from h-TaxOyHz after hydrolysis reveal a broad and multimodal particle size distribution with particles up to several hundreds of nanometers in size. The particle size distribution for a freshly prepared suspension (Fig. S15a†) shows three broad peaks at 130, 673, and 2700 nm. Smaller entities are not visible in such measurements because the scattered intensity scales with D6 (D being the particle diameter). Scattering contributions of only a few larger particles will therefore completely dominate the total light scattering intensity. To also assess smaller particles, the h-TaxOyHz suspension was filtered using a syringe filter with pore size of 0.45 μm. In this way, large aggregates were separated from the suspension. The corresponding DLS particle size distribution (Fig. S15b†) now indicates particles with an average size of 16 nm, well in accordance with the particle size approximated from the specific surface area of the dried solid. Hence, the solids in suspension are most likely formed by aggregation of 15–20 nm particles. According to the PDF analysis, the latter consists of dense arrangements of sub-nanometer-sized h-TaxOyHz clusters.
Heat-induced crystallisation: transforming amorphous d-TaxOy into L-Ta2O5
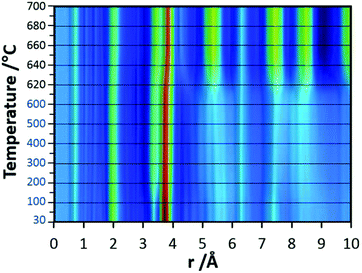
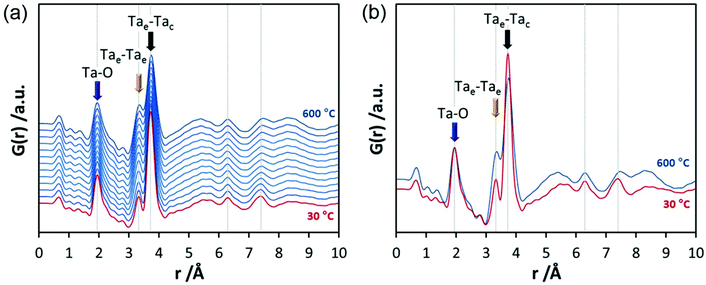
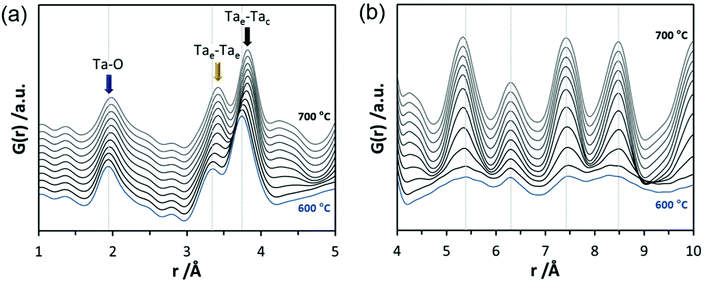
In the final experiments, the successive transformation of amorphous d-TaxOy into crystalline TaxOy was investigated. TG-DSC and IR experiments (Fig. S16 and S18†) reveal the release of water upon heating followed by an exothermic process at temperatures above 600 °C with an activation energy of 397 kJ mol−1 (see Fig. S17†).Temperature-dependent total scattering data were collected between 30 and 700 °C and subsequent PDFs were calculated (Fig. 7). As can be seen from Fig. 8a, the experimental PDFs do not change significantly between room temperature and 600 °C. The main distances corresponding to Ta–O, Tae–Tae, and Tae–Tac remain more or less constant.
The Ta–O distances remain almost the same while a direct comparison of the PDFs obtained at 30 and 600 °C reveals that the amount of edge-sharing octahedra increase slightly (Fig. 8b). The peak representing Tae–Tac distances becomes somewhat broader, which could be due to thermal motion. The corner-sharing octahedra are more flexible and thus the position of the octahedra is more susceptible to temperature changes.53 Between 610 and 620 °C, significant changes occur which do not only influence the short-range order but also the medium-range order (Fig. 9a). The temperature-dependent transformation affects both atom pair distances and signal intensities. Some pair correlations shift to shorter distances while others get longer. The Ta–O distance starts to increase from 1.95 Å at 600 °C to 1.99 Å at 700 °C, reflecting the thermal motion of atoms. The Ta–Ta distances increase substantially. The Tae–Tae distances (between two edge-sharing octahedra) increase from 3.34 to 3.44 Å and the Tae–Tac distances (between the edge and the corner-sharing octahedra) change from 3.72 to 3.82 Å. At the same time, the intensities of the signals corresponding to Tae–Tae distances decrease while those of the Tae–Tac distances increase. This shows that with increasing temperature, the connectivity between the octahedra is changing. Concurrently a new atom correlation between 4.1 and 4.7 Å gains intensity. Interestingly, similar distances have been reported by Alderman et al.54 for molten Ta2O5 thin films.
Inspecting the distances associated with medium-range order between 4 and 10 Å reveals that not much change is visible up to 610 °C. At 620 °C, the intensities of the individual pair correlations increase significantly (Fig. 9b). The pair correlations at 5.35, 6.32, 7.44, and 8.49 Å are more or less at those positions where we observed broad features already for the hydrolysed h-TaxOyHz. Among the simulated PDFs of different crystalline polymorphs of Ta2O5, only the PDF belonging to the disordered orthorhombic L-Ta2O5 structures published by Stephenson and Roth coincides well with the experimental PDF obtained at 700 °C (Fig. 10). The partial PDFs calculated from the structure of Stephenson and Roth are shown in Fig. S19.† The main peaks all belong to Ta–Ta distances within and between the layers in the L-Ta2O5 structure.13 Interestingly, no intermediate structures are observed during the transformation of the cluster structure to crystalline L-Ta2O5. Only small rearrangements of the octahedra, forming more edge-sharing octahedral units, take place in the temperature range up to 600 °C. At 620 °C, the smaller clusters connect to the distorted layers present in L-Ta2O5, and finally, the arrangement of the layers is accomplished. The increase of the long-range order with temperature, and therefore the growth of the coherently scattering domains to approximately 70 Å, is visible in Fig. S20.† The exothermic process observed in the TG-DSC experiments is the crystallization of L-Ta2O5.
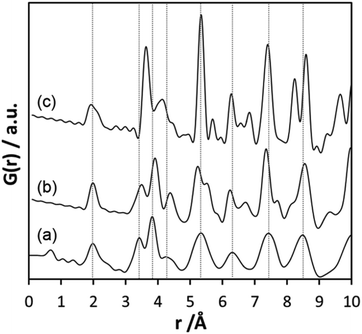 | ||
| Fig. 10 (a) Experimental PDF obtained at 700 °C during heating of d-TaxOy, calculated PDFs based on the structures of (b) L-Ta2O513 and (c) β-Ta2O5.14 | ||
The refinement of the PDF data obtained at 700 °C against the structure of L-Ta2O5 (Fig. S21 and Table S1†) reveals a very good fit. Some minor mismatch between experimental and refined PDFs is likely related to the fact that L-Ta2O5 is still a highly distorted crystalline structure.
An intriguing observation from the heating experiments is the fact that the pair correlations observed for h-TaxOyHz remained stable up to 600 °C. Upon further heating, they then changed only in intensity rather than in r-values. This observation brought us back to inspecting the structural relationship between h-TaxOyHz and the final L-Ta2O5 structure. As discussed above, none of the cut-outs of the L-Ta2O5 structure resulted in a satisfying match of calculated and experimental PDFs. However, in these models, the highly distorted arrangement of octahedra in the final L-Ta2O5 structure had been maintained. That arrangement is imprinted to the octahedra by the surrounding crystal structure which is absent in the case of h-TaxOyHz. Therefore, we re-considered the cut-outs, but after adjusting the seven-fold coordination of Ta by O in L-Ta2O5 to an octahedral coordination. The structure was then allowed to relax (sterically) using the unified force field provided by the Avogadro software package.55 The PDF calculated using the relaxed cluster model shown in Fig. 11 coincides well with the experimental PDF. Despite the mismatch in the peaks corresponding to Ta–O bond lengths, the simulated PDF using the cluster model cut out of the structure reflects the octahedral arrangements nicely. Maxima of the two peaks representing the distances between Ta atoms of edge-and corner-sharing octahedra match with the corresponding peaks in the experimental PDF. Moreover, intensity ratios of these two peaks also match in the simulated and experimental PDFs, indicating that the relative abundance of these two octahedral connections is reflected well by the proposed model. Thus, it seems not unlikely that respective units exist in h-TaxOyHz, which then transform into the high-temperature phase L-Ta2O5 at elevated temperature. However, also other cluster models result in a quite reasonable match of experimental and model-based PDFs. Refinement of an individual structure model for the clusters with PDFgui failed. The clusters most likely do not have identical structures but show certain variation of connectivity. The latter is not surprising from an energetic point of view considering the small dimensions of the clusters. The presence of water allows for a rapid breaking and reformation of bonds, a process driven by entropy. Therefore, a number of different arrangements of condensed octahedral units probably exists in h-TaxOyHz with structural features similar to those observed in the two cluster models that match best.
Conclusions
In this study, the local structure of tantalum oxide was studied in a highly dilute system, starting from the metal alkoxide precursor to the hydrolysed oxide. In addition, the transformation of the amorphous powder sample to crystalline L-Ta2O5 was investigated by in situ temperature-dependent PDF analyses. The amorphous hydrolysed tantalum oxide forms as small cluster units with sizes of less than 1 nm. The clusters consist mainly of corner-sharing octahedra accompanied by a few highly interconnected edge-sharing octahedra. Construction of cluster models allowed for assessment of potential structural motifs even though not for identification of an exclusive cluster structure. More likely a mix of clusters with very similar, but not identical, units and structural motifs are present. These clusters agglomerate to form larger particles without any further ordering. Heating these particles leads to the release of water and results in the crystallisation of L-Ta2O5 at temperatures above 610 °C. No further intermediate structures are observed before the direct transformation of the tantalum oxide clusters to L-Ta2O5 upon heating to higher temperatures. We believe that the results from this study help to elucidate the local structural arrangement of amorphous tantalum oxides. We monitored the local structure in dilute solutions right after injection of the precursor into the solution under operando conditions. These studies are fundamental for nucleation and growth experiments in dilute solutions/dispersions in general. They not only shed light on the local structures of compounds showing only short-range order and allow for more detailed insights on formation processes to be gained, but also demonstrate how a remarkable wealth of information can be obtained by PDF studies on clusters present only in very low concentrations of less than 0.1 wt% tantalum in the reaction solution.Experimental
Synthesis procedure for h-TaxOyHz and d-TaxOy samples
Synthesis of TaxOy samples involves injection of 236 μL tantalum(V) ethoxide (Ta(OEt)5, 99.98%, Sigma Aldrich) as metal alkoxide precursor into a mixture of 180 mL deionised water and 20 mL methanol (MeOH) as explained elsewhere.20 For a hypothetic Ta2O5 material, this concentration would result in the formation of 0.1 wt% suspension (typical concentration used for photocatalytic tests). The reaction suspension was stirred for 2 h under inert gas purging. Samples from the reaction suspensions were collected for static suspension measurements. To obtain a dry powder (d-TaxOy), the sediment was separated from the suspension by decanting off the liquid part and drying the sediment overnight at 60 °C in an oven.Synthesis procedure for h-TaxOyHz samples for in situ total scattering experiments performed in a flow cell
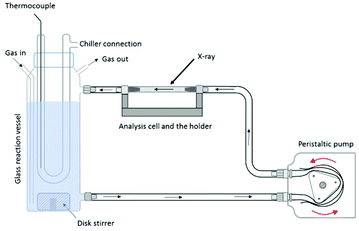
The reaction vessel used for the in situ flow cell experiments has an outlet at the bottom and an inlet to circulate the reaction suspension. A scheme of the experimental setup is shown in Fig. 12; a photograph is given in Fig. S2.† A thermocouple inside the reaction vessel is controlling the temperature. Inert gas (N2) is purged through the solution to avoid oxidation of the system during the formation of the oxyhydroxides. The suspension is pumped with a peristaltic pump from the reaction reservoir through a piping system (approximately 150 mL min−1) directly into a borosilicate capillary flow cell and then back into the reaction vessel. X-ray scattering data were collected from the suspension flowing through the flow cell.For the experiments carried out at Diamond Light Source (Diamond), the capillary flow cell dimensions are as follows: L = 100 mm, Douter = 2.1 mm, Dinner = 2 mm. For the synthesis of h-TaxOyHz samples to be pumped through the flow cell, a mixture of 25 mL MeOH and 225 mL deionised water was filled into the glass reaction vessel. Ta2(OEt)10 was injected to the solution to prepare a 0.2 wt% Ta2O5 suspension.
For the experiments performed at the European Synchrotron Radiation Facility (ESRF), the flow cell dimensions are as follows: L = 100 mm, Douter = 3.8 mm, Dinner = 3.7 mm. Ta2(OEt)10 was injected to prepare a 0.4 wt% Ta2O5 suspension to synthesise h-TaxOyHz samples.
Experimental parameters for the total scattering experiments
The program PDFgetX348 implemented in the xPDFsuite56 was used for generating PDFs from the integrated scattering data. For the simulation of PDFs from cluster models, DebyePDFCalculator within Diffpy-CMI57 was used while PDFgui58 was used for the simulation of PDFs from periodic structures. For PDF simulations, Qmax values and the instrumental parameters are kept identical to the values used for the respective experiments.Characterisation
The transmission electron microscopy (TEM) measurements were performed using a 60–300 Titan Themis instrument (FEI) operated at 300 kV with a Cs corrector for the image forming lens. Specific surface areas were determined by N2 gas adsorption experiments with a NOVA 3200e instrument (Quantachrome) after degassing approximately 150 mg powder samples under vacuum at 150 °C overnight. Data were evaluated by the Brunauer–Emmett–Teller (BET) method using the adsorption data in the relative pressure range of 0.05 to 0.2. From the specific surface area, approximate particle sizes were calculated using the relation Dp = 6000 σ−1 As−1 (assuming spherical particles, Dp = particle size in nm, σ = specific density in g cm−3, As = specific surface area m2 g−1). For the amorphous TaxOy samples the specific density, σ, was approximated as 8.2 g cm−3. This value was measured with helium pycnometry. Dynamic light scattering (DLS) data were recorded on a Zetasizer Nano-ZS (Malvern) using laser radiation with a wavelength of 633 nm. The suspension collected after synthesis was centrifuged for 10 min and ultrasonicated for 25 min. The scattered light was measured at a backscattering angle of 173°. Thermogravimetry (TG) and differential scanning calorimetry (DSC) measurements were carried out using a NETZSCH STA 449 F3 Jupiter thermal analyser for the qualitative analysis of crystallisation temperatures. The measurements were carried out under an air flow of 40 mL min−1 using approximately 10 mg powder heated in an aluminium oxide crucible with heating rates of 2, 5, and 10 °C min−1. Fourier transform infrared (FTIR) spectroscopy measurements were performed using a PerkinElmer Spectrum Two spectrometer with an attenuated total reflectance (ATR) unit. For visualisation of molecular and crystal structures, the Diamond software package was used.63Conflicts of interest
There are no conflicts to declare.Acknowledgements
E. O. S. acknowledges the International Max Planck Research School for Interface Controlled Materials for Energy Conversion (IMPRS-SurMat) for funding. H. T. acknowledges MAXNET Energy consortium of Max Planck Society for financial support. C. K. C. and J. L. would like to thank the Alexander von Humboldt Foundation for support of this work through Humboldt Research Fellowships. C. W. thanks the Max Planck Society for basic funding. We acknowledge Diamond Light Source (UK) (Dr Dean Keeble, I15-1, proposal EE16372-1), the European Synchrotron Radiation Facility (France) (Dr Carlotta Giacobbe and Dr Jonathan Wright, ID11, proposal MA-3621) and Deutsches Elektronen-Synchrotron (Germany) (Dr Martin Etter, Petra III, P02.1, proposal I-20190175) for beamtime. We would like to express our gratitude to Dr Hilke Petersen and Jan Ternieden (Max-Planck-Institut für Kohlenforschung) who helped us during our in situ heating experiments, and Dr Michael Badawi (University of Lorraine) for discussions. We thank the mechanical workshop of the Max-Planck-Institut für Kohlenforschung for the fabrication of the analysis cells. Open Access funding provided by the Max Planck SocietyNotes and references
- K. Lawniczak-Jablonska, A. Wolska, P. Kuzmiuk, P. Rejmak and K. Kosiel, RSC Adv., 2019, 9, 35727 RSC.
- S. Chakravarty, J. M. L. Hix, K. A. Wiewiora, M. C. Volk, E. Kenyon, D. D. Shuboni-Mulligan, B. Blanco-Fernandez, M. Kiupel, J. Thomas, L. F. Sempere and E. M. Shapiro, Nanoscale, 2020, 12, 7720 RSC.
- Y. Yang, P. Sheridan and W. Lu, Appl. Phys. Lett., 2012, 100, 203112 CrossRef.
- N. Zhang, L. Li and G. Li, Res. Chem. Intermed., 2017, 43, 5011 CrossRef CAS.
- T. Grewe and H. Tüysüz, J. Mater. Chem. A, 2016, 4, 3007 RSC.
- T. Grewe and H. Tüysüz, ACS Appl. Mater. Interfaces, 2015, 7, 23153 CrossRef CAS PubMed.
- Y. Chen, J. L. G. Fierro, T. Tanaka and I. E. Wachs, J. Phys. Chem. B, 2003, 107, 5243 CrossRef CAS.
- T. Ushikubo and K. Wada, J. Catal., 1994, 148, 138 CrossRef CAS.
- K. Toki, K. Kusakabe, T. Odani, S. Kobuna and Y. Shimizu, Thin Solid Films, 1996, 281–282, 401 CrossRef CAS.
- S.-H. Lee, J. Kim, S.-J. Kim, S. Kim and G.-S. Park, Phys. Rev. Lett., 2013, 110, 235502 CrossRef.
- R. Nashed, W. M. I. Hassan, Y. Ismail and N. K. Allam, Phys. Chem. Chem. Phys., 2013, 15, 1352 RSC.
- M. V. Ivanov, T. V. Perevalov, V. S. Aliev, V. A. Gritsenko and V. V. Kaichev, J. Appl. Phys., 2011, 110, 024115 CrossRef.
- N. C. Stephenson and R. S. Roth, Acta Crystallogr., Sect. B: Struct. Crystallogr. Cryst. Chem., 1971, 27, 1037 CrossRef CAS.
- L. A. Aleshina and S. V. Loginova, Crystallogr. Rep., 2002, 47, 415 CrossRef CAS.
- G. S. Oehrlein, F. M. d'Heurle and A. Reisman, J. Appl. Phys., 1984, 55, 3715 CrossRef CAS.
- A. Fukumoto and K. Miwa, Phys. Rev. B: Condens. Matter Mater. Phys., 1997, 55, 11155 CrossRef CAS.
- N. C. Stephenson and R. S. Roth, J. Solid State Chem., 1971, 3, 145 CrossRef CAS.
- V. A. Shvets, V. Sh. Aliev, D. V. Gritsenko, S. S. Shaimeev, E. V. Fedosenko, S. V. Rykhlitski, V. V. Atuchin, V. A. Gritsenko, V. M. Tapilin and H. Wong, J. Non-Cryst. Solids, 2008, 354, 3025 CrossRef CAS.
- H. Szymanowski, O. Zabeida, J. E. Klemberg-Sapieha and L. Martinu, J. Vac. Sci. Technol., A, 2005, 23, 241 CrossRef CAS.
- T. Grewe and H. Tüysüz, ChemSusChem, 2015, 8, 3084 CrossRef CAS PubMed.
- H. Tüysüz and C. K. Chan, Nano Energy, 2013, 2, 116 CrossRef.
- D. Merki, S. Fierro, H. Vrubel and X. Hu, Chem. Sci., 2011, 2, 1262 RSC.
- J. Masa, P. Weide, D. Peeters, I. Sinev, W. Xia, Z. Sun, C. Somsen, M. Muhler and W. Schuhmann, Adv. Energy Mater., 2016, 6, 1502313 CrossRef.
- E. Tsuji, A. Imanishi, K. Fukui and Y. Nakato, Electrochim. Acta, 2011, 56, 2009 CrossRef CAS.
- R. D. L. Smith, M. S. Prévot, R. D. Fagan, Z. Zhang, P. A. Sedach, M. K. J. Siu, S. Trudel and C. P. Berlinguette, Science, 2013, 340, 60 CrossRef CAS.
- A. Indra, P. W. Menezes, N. R. Sahraie, A. Bergmann, C. Das, M. Tallarida, D. Schmeißer, P. Strasser and M. Driess, J. Am. Chem. Soc., 2014, 136, 17530 CrossRef CAS.
- C. Lv, C. Yan, G. Chen, Y. Ding, J. Sun, Y. Zhou and G. Yu, Angew. Chem., Int. Ed., 2018, 57, 6073 CrossRef CAS.
- D. M. Alonso, S. G. Wettstein and J. A. Dumesic, Chem. Soc. Rev., 2012, 41, 8075 RSC.
- S. J. L. Billinge and M. G. Kanatzidis, Chem. Commun., 2004, 749 RSC.
- B. K. Teo, in EXAFS: Basic Principles and Data Analysis, Springer, Berlin, Heidelberg, 1986, vol. 2, p. 21 Search PubMed.
- F. Zernike and J. A. Prins, Z. Phys. A: Hadrons Nucl., 1927, 41, 184 CrossRef.
- B. E. Warren, Phys. Rev., 1933, 44, 969 CrossRef CAS.
- W. H. Zachariasen, J. Phys. Chem., 1935, 3, 158 CrossRef CAS.
- G. Hura, J. M. Sorenson, R. M. Glaeser and T. Head-Gordon, J. Phys. Chem., 2000, 113, 9140 CrossRef CAS.
- T. Head-Gordon and G. Hura, Chem. Rev., 2002, 102, 2651 CrossRef CAS PubMed.
- J. M. Sorenson, G. Hura, R. M. Glaeser and T. Head-Gordon, J. Phys. Chem., 2000, 113, 9149 CrossRef CAS.
- D. L. Wertz and R. K. Kruh, J. Phys. Chem., 1967, 47, 388 CrossRef CAS.
- C. J. Benmore and Y. L. Loh, J. Phys. Chem., 2000, 112, 5877 CrossRef CAS.
- M. Falkowska, D. T. Bowron, H. G. Manyar, C. Hardacre and T. G. A. Youngs, ChemPhysChem, 2016, 17, 2043 CrossRef CAS PubMed.
- M. W. Terban, M. Johnson, M. Di Michiel and S. J. L. Billinge, Nanoscale, 2015, 7, 5480 RSC.
- M. Zobel, R. B. Neder and S. A. J. Kimber, Science, 2015, 347, 292 CrossRef CAS PubMed.
- J. L. Mi, K. M. Ø. Jensen, C. Tyrsted, M. Bremholm and B. B. Iversen, CrystEngComm, 2015, 17, 6868 RSC.
- E. Galicia-Andrés, L. Pusztai, L. Temleitner and O. Pizio, J. Mol. Liq., 2015, 209, 586 CrossRef.
- S. Dixit, A. K. Soper, J. L. Finney and J. Crain, Europhys. Lett., 2002, 59, 377 CrossRef CAS.
- D. C. Bradley, W. Wardlaw and A. Whitley, J. Chem. Soc., 1955, 726 RSC.
- D. C. Bradley and C. E. Holloway, J. Chem. Soc. A, 1968, 219 RSC.
- V. Krishnan, S. Gross, S. Müller, L. Armelao, E. Tondello and H. Bertagnolli, J. Phys. Chem. B, 2007, 111, 7501 CrossRef CAS PubMed.
- P. Juhás, T. Davis, C. L. Farrow and S. J. L. Billinge, J. Appl. Crystallogr., 2013, 46, 560 CrossRef.
- K. M. Ø. Jensen, A. B. Blichfeld, S. R. Bauers, S. R. Wood, E. Dooryhée, D. C. Johnson, B. B. Iversen and S. J. L. Billinge, IUCrJ, 2015, 2, 481 CrossRef CAS.
- I. Abrahams, D. C. Bradley, H. Chudzynska, M. Motevalli and P. ÓShaughnessy, J. Chem. Soc., Dalton Trans., 2000, 2685 RSC.
- T. Egami and S. J. L. Billinge, in Underneath the Bragg Peaks, ed. R. W. Cahn, Elsevier Ltd., UK, 2003, vol. 3, p. 60 Search PubMed.
- B. Shyam, K. H. Stone, R. Bassiri, M. M. Fejer, M. F. Toney and A. Mehta, Sci. Rep., 2016, 6, 32170 CrossRef CAS PubMed.
- R. Søndenå, S. Stølen, P. Ravindran, T. Grande and N. L. Allan, Phys. Rev. B: Condens. Matter Mater. Phys., 2007, 75, 184105 CrossRef.
- O. L. G. Alderman, C. J. Benmore, J. Neuefeind, E. Coillet, A. Mermet, V. Martinez, A. Tamalonis and R. Weber, Phys. Rev. Mater., 2018, 2, 043602 CrossRef CAS.
- M. D. Hanwell, D. E. Curtis, D. C. Lonie, T. Vandermeersch, E. Zurek and G. R. Hutchison, J. Cheminf., 2012, 4, 17 CAS.
- X. Yang, P. Juhás, C. L. Farrow and S. J. L. Billinge, 2015, arXiv:1402.3163v3 [cond-mat.mtrl-sci].
- P. Juhás, C. L. Farrow, X. Yang, K. R. Knox and S. J. L. Billinge, Acta Crystallogr., Sect. A: Found. Adv., 2015, A71, 562 CrossRef PubMed.
- C. L. Farrow, P. Juhás, W. Liu, D. Bryndin, E. S. Božin, J. Bloch, T. Proffen and S. J. L. Billinge, J. Phys.: Condens. Matter, 2007, 19, 335219 CrossRef CAS PubMed.
- J. Filik, A. W. Ashton, P. C. Y. Chang, P. A. Chater, S. J. Day, M. Drakopoulos, M. W. Gerring, M. L. Hart, O. V. Magdysyuk, S. Michalik, A. Smith, C. C. Tang, N. J. Terrill, M. T. Wharmby and H. Wilhelm, J. Appl. Crystallogr., 2017, 50, 959 CrossRef CAS PubMed.
- A. P. Hammersley, J. Appl. Crystallogr., 2016, 49, 646 CrossRef CAS.
- A. P. Hammersley, S. O. Svensson, M. Hanfland, A. N. Fitch and D. Hausermann, High Pressure Res., 1996, 14, 235 CrossRef.
- G. Ashiotis, A. Deschildre, Z. Nawaz, J. P. Wright, D. Karkoulis, F. E. Picca and J. Kieffer, J. Appl. Crystallogr., 2015, 48, 510 CrossRef CAS PubMed.
- K. Brandenburg and H. Putz, DIAMOND (Version 3.2k), Crystal Impact GbR, Bonn, Germany, 2005 Search PubMed.
Footnote |
| † Electronic supplementary information (ESI) available: Additional scattering, PDF, IR, TG/DSC, DLS data, TEM image flow cell setup, model structures, PDF refinements and temperature calibration curves. See DOI: 10.1039/d0nr07871a |
| This journal is © The Royal Society of Chemistry 2021 |

