 Open Access Article
Creative Commons Attribution 3.0 Unported Licence
A review on biomass-derived hard carbon materials for sodium-ion batteries
Mathew
Thompson
,
Qingbing
Xia
,
Zhe
Hu
and
Xiu Song
Zhao
 *
*
School of Chemical Engineering, The University of Queensland, St Lucia, QLD 4072, Australia. E-mail: george.zhao@uq.edu.au
First published on 31st August 2021
Abstract
This paper presents a review of research progress for biomass-derived hard carbon materials for sodium-ion storage. It provides an in-depth analysis of hard carbon anode materials obtained from biomass with the aim of identifying an optimal structure performance relationship. Different sodium-ion storage mechanisms in hard carbon and models proposed in the literature are discussed and compared. Hard carbon property – performance correlations are analysed based on recent published data. This paper also provides insight into the common methods for preparing hard carbon from biomass, as well as effect of preparation conditions on the physical properties of hard carbon materials. Observed structural changes are directly correlated with preparation parameters and biomass precursor used. In most cases, biomass derived hard carbon materials thermally treated between 1200 °C and 1400 °C have been identified as providing ideal structural properties for improving sodium-ion storage performance in battery cells. However, certain drawbacks including poor cycling stability and low initial coulombic efficiency still hinder the wider applications of hard carbon for sodium-ion batteries. To that end, methods for addressing the negative performance characteristics are provided, including the requirement for novel characterization techniques and advanced material engineering.
1. Introduction
1.1. The need for electrochemical energy storage systems
Fossil fuels such as coal, oil and gas are significant contributors of greenhouse gases, such as CO2 and CH4. The Intergovernmental Panel on Climate Change (IPCC) suggests that reduction in use of fossil fuels is required to ensure the average global temperature rise does not exceed 2 °C within this century.1 Providing affordable and clean energy is one of the seventeen Sustainable Development Goals (SDGs) outlined by the United Nations in response to recommendations provided by the IPCC.2 In the context of Australia, the federal government is ambitious to cut fossil fuel emissions by at least 50% by 2050.3 Moving from non-renewable to renewable energy sources has been outlined as an important factor to achieve this goal.Solar photovoltaics (PV) and wind energy are renewable energy technologies currently being deployed worldwide.4 However, these renewable energy sources are intermittent in production, and as such are unable to provide energy on demand reliably on a large scale. Due to this intermittency problem, the widespread global uptake of the above-mentioned renewable energy sources has been limited. To increase the contribution of PV and wind energy and the total energy consumed by renewable sources, research and development of innovative large-scale energy storage devices is required to store and distribute intermittent renewable energy as and when it is in demand. However, for several reasons, such as resource availability and performance failures, large scale energy storage has been identified as the current bottleneck towards wide deployment of renewable energy.5,6
Lithium-ion batteries (LIBs) are the main electrochemical energy storage technology used within portable electronics, electric vehicles, and more recently for the storage of energy produced by wind and solar renewables.7 The high energy density of LIBs enables this technology to supply consistent energy over an extended period of time.8 For example, the introduction of the Tesla-Neoen 100 megawatt (MW) lithium-ion grid-scale battery system installed in South Australia to support the previously established wind farm and provide much needed stabilisation to the state's energy grid.9 However, the rapidly growing demand for electrochemical energy storage systems to aid the implementation of renewable energy infrastructure is increasing the pressure on lithium resources. Also, the politically sensitive location of lithium reserves results in additional concerns. It is under this background that sodium-ion batteries (NIBs) have resurfaced to attract intensive research and development attention in both academics and industry in recent years.
1.2. Why sodium-ion batteries?
There are a number of parameters to be considered in developing energy storage technologies, such as the cost per kW h ($ kW−1 h−1), the specific energy (gravimetric W h kg−1, or volumetric energy density W h L−1), the specific power (W kg−1), and the sustainability of the materials used. As it stands, LIBs currently dominate the energy storage market globally with competitive price ($USD 153 kW−1 h−1)10 and high energy density (260 W h kg−1).11 However, the energy density of LIBs is close to reaching its maximum intrinsic energy density of around 300 W h kg−1.11 On the other hand, the low abundance and uneven global distribution of lithium resources cause concerns on the sustainability of the LIB technology. Also, with the fast development of electric vehicles (EVs) and growing needs for grid-scale energy storage, the demand for lithium and cobalt resources is rapidly increasing, potentially causing price rise.In comparison with lithium, sodium is significantly more abundant and widely distributed throughout the globe.12 Thus, the cost of sodium is far less than lithium (Table 1). Additionally, sodium ions are non-reactive with aluminium. As a result, aluminium can be used as the current collector for NIBs. The use of aluminium instead of copper as the current collector further reduces the overall cost of the cell. According to Passerini et al.,14 replacing lithium with sodium as the charge carrier and copper with aluminium as the current collector enables about 20% reduction in cost (Fig. 1). Thus, NIBs are more cost-effective than LIBs.14
| Property | Na | Li |
|---|---|---|
| Cation radius | 97 pm | 68 pm |
| Atomic weight | 23 g mol−1 | 6.9 g mol−1 |
| E 0 vs. SHE | −2.7 V | −3.04 V |
| A–O coordination | Octahedral or prismatic | Octahedral or tetrahedral |
| Melting point | 97.7 °C | 180.5 °C |
| Abundance | 23.6 × 10³ mg kg−1 | 20 mg kg−1 |
| Distribution | Everywhere | 70% in South America |
| Price, carbonates | About 2 RMB per kg | About 40 RMB per kg |
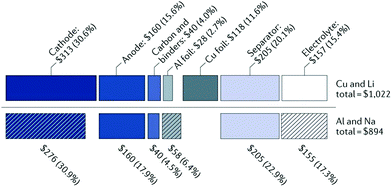 | ||
| Fig. 1 A cost comparison between lithium-ion and sodium-ion batteries.13 Copyright 2001, Springer Nature. | ||
Moreover, there are fundamental differences in physical and chemical properties between the two alkali metal ions (Table 1). Sodium is a weaker Lewis acid than lithium, leading to a lower de-solvation energy of the former than the latter in most organic solvents.16 This property is particularly significant in terms of ionic conductivity and interfacial mass transport.17,18
1.3. Challenges and opportunities of sodium-ion batteries
The configuration of a NIB is like LIBs. The individual components that make up the sodium-ion rechargeable battery include an anode, a cathode, a separator and the electrolyte.19–21 However, due to the differences in chemistry between lithium and sodium ions, the interaction of the alkali metal ions with host materials previously developed for LIBs differ significantly. Graphite with a theoretical lithium-ion storage capacity of 372 mA h g−1![[thin space (1/6-em)]](https://www.rsc.org/images/entities/char_2009.gif) 22 is the most popularly used anode in LIB cells. The storage capacity of sodium ions in graphite however is limited in traditional ester-based electrolytes, with a storage capacity of about 31 mA h g−1
22 is the most popularly used anode in LIB cells. The storage capacity of sodium ions in graphite however is limited in traditional ester-based electrolytes, with a storage capacity of about 31 mA h g−1![[thin space (1/6-em)]](https://www.rsc.org/images/entities/char_2009.gif) 23 This is attributed to the thermodynamically unstable nature of sodium-graphite intercalation compounds.24,25 It should be pointed out, however, that the co-intercalation mechanism in ether-based electrolytes can enable a larger amount of sodium ion storage in graphite (about 100 mA h g−1)26 The difference in chemistry between lithium and sodium impacts the electrochemical properties of the alkali metal ions in positive electrodes as well. For instance, LiFePO4 exhibits a voltage of 3.5 V and a capacity of 160 mA h g−1, higher than that of NaFePO4 (3.0 V and 110 mA h g−1). According to Wang et al.,26 these differences are attributed to the larger charge transfer resistance due to the increased ionic radius of the sodium ion compared to the lithium ion. Therefore, research into new electrode materials and electrolytes are required to fully realise the potential of NIBs.
23 This is attributed to the thermodynamically unstable nature of sodium-graphite intercalation compounds.24,25 It should be pointed out, however, that the co-intercalation mechanism in ether-based electrolytes can enable a larger amount of sodium ion storage in graphite (about 100 mA h g−1)26 The difference in chemistry between lithium and sodium impacts the electrochemical properties of the alkali metal ions in positive electrodes as well. For instance, LiFePO4 exhibits a voltage of 3.5 V and a capacity of 160 mA h g−1, higher than that of NaFePO4 (3.0 V and 110 mA h g−1). According to Wang et al.,26 these differences are attributed to the larger charge transfer resistance due to the increased ionic radius of the sodium ion compared to the lithium ion. Therefore, research into new electrode materials and electrolytes are required to fully realise the potential of NIBs.
The general requirements of anode materials in NIBs include the ability to store adequate quantities of sodium ions, having a similar voltage potential to that of pure sodium metal,27 stability towards electrolytes, high electronic and ionic conductivity and low cost with little environmental impact.4 Anode materials used in NIBs can be classified into three categories based on their charge storage mechanisms: (1) insertion materials such as carbonaceous materials and titanium oxides, (2) conversion materials such as transition metal oxides and sulphides, and (3) alloying materials such as group 14 and 15 elements.28,29 Although conversion and alloying materials are promising anode materials for sodium-ion storage, the larger ionic radii of Na-ions can result in large expansion of unit cell and degradation and exfoliation of the material upon cycling, leading to voltage hysteresis and low reversible capacities.28,30 The insertion-based materials, such as hard carbon (HC), soft carbon (SC) and graphite accept ionic species without significant volume change during sodiation and de-sodiation.4 This traits makes carbonaceous insertion based materials suitable candidates for NIBs. Moreover, HC can be obtained from biomass, meaning it can be low in cost and environmental impact.
The sodium-ion storage capacity in HC is significantly higher than in graphite.25 However, the cycle life is still far less than the requirements for realising grid-scale energy storage.31 According to Xiao et al.,32 the cycle instability can be attributed to the undesirable side reactions caused by the reduction reaction of the electrolyte on the anode side. By significantly reducing the surface area of a sucrose-derived HC to as low as 1.74 m2 g−1, the authors were able to obtain an initial coulombic efficiency of 86.1% with capacity retention of 93.4% after 100 cycles. However, the rate performance is restricted due to the diffusion-controlled kinetics of the electrochemical reaction. As a result, understanding the microstructure/performance relationship of sodium-ion storage in HC is important to underpin the development of the NIB technology.
1.4. Scope and aim of this review
This review aims to provide a summary of recent research progress towards biomass-derived HC materials for sodium-ion storage. It is particularly focused on analysing the relationship between biomass precursors, processing methods and conditions, HC structure and electrochemical performance. Firstly, the debate on the mechanisms and models of sodium-ion storage in HC materials in the literature space is briefly outlined. Secondly, the biomass precursors and general methods for processing biomass to prepare HC materials are discussed. Thirdly, the important conditions influencing the physical and chemical properties of the resulting HC materials are presented. Then, the relationship between HC properties and electrochemical performance is analysed focusing on the role of surface defects and functionalities, porosity and graphitic domains.2. Sodium ion storage mechanisms in hard carbon
2.1. Microstructure of hard carbon
HC is a non-graphitisable carbon allotrope even at temperatures as high as 3000 °C. Another carbon allotrope that is also being explored as a sodium-ion host material is soft carbon (SC).33 Unlike HC, SC can be readily converted to graphite by heating to high temperatures (e.g., 3000 °C). The physical properties of HC and SC are quite different. Fig. 2 schematically compares the microstructures of graphite, SC and HC.34 Both graphite and SC are more structurally ordered with a d-spacing close to 0.335 nm. In comparison, the d-spacing of HC is larger than that of 0.335 nm. Both HC and SC possess pores, but the latter has a much lower porosity than the former. As a result, the higher porous volume and expanded d-spacing enable HC materials to exhibit a significantly higher sodium-ion storage capacity than SC and graphite. Thus, amongst all carbon allotropes, HC stands out as a promising anode for sodium-ion storage.35 | ||
| Fig. 2 Scheme illustrating the microstructures of graphite, soft carbon and hard carbon.34 Copyright 2001, Wiley. | ||
HC materials are produced by heating thermosetting carbon-containing precursors in the absence of oxygen (pyrolysis) (Fig. 3). Instead, thermoplastic precursors are used to prepare SC and graphite.36 Biomass, a type of thermosetting precursor, is a sustainable and naturally abundant source for preparing HC materials for energy storage applications.36,37 Both the physical and chemical properties of biomass-derived HCs have impact on sodium-ion storage performance.11,23,35 Chemically, the biomass-derived HCs primarily consist of carbon, oxygen and nitrogen. While oxygen and nitrogen are present in small amounts, they can have significant influence on the electronic, chemical and electrochemical properties of the HC. Physically, the presence of heteroatoms along with sp3 hybridised crosslinking carbon bonds lead to the formation of short-range graphitic ordering (turbostratic nanodomains) and pores, including both open and closed pores.38,39 Due to this arrangement, HC also typically has a large specific surface area.40 The unique microstructural features of HCs provide a number of possibilities for sodium ion storage.41
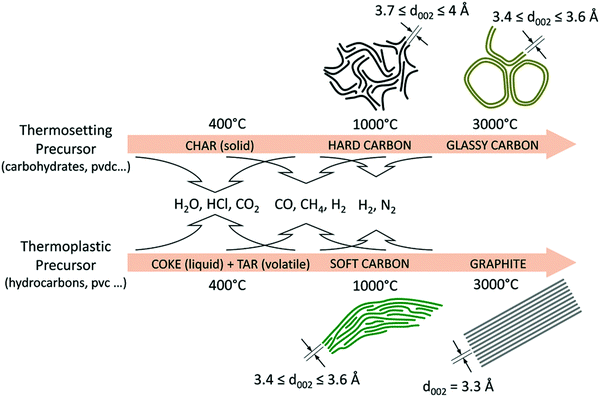 | ||
| Fig. 3 Schematic illustration of the evolution of the microstructures of graphite, soft and HCs from different biomass precursors as a function of thermal treatment temperatures.36 Copyright 2018, Wiley. | ||
2.2. Sodium-ion storage mechanisms in hard carbon
Since the pioneering work of Stevens and Dahn in 2000,42 sodium-ion storage mechanisms in HC materials have been in debate. This is not unexpected because of the diversity of HC samples prepared using different precursors and under different processing conditions, as well as the difficulty in characterising the physical and chemical properties, which have effect on sodium-ion storage behaviour during electrochemical cycling. Nevertheless, a recent review summarises four possible sodium-ion storage models for HC as illustrated in Fig. 4, including (a) the intercalation-pore filling model, (b) the adsorption-intercalation model, (c) the adsorption-pore filling model and (d) the adsorption-intercalation-pore filling model.35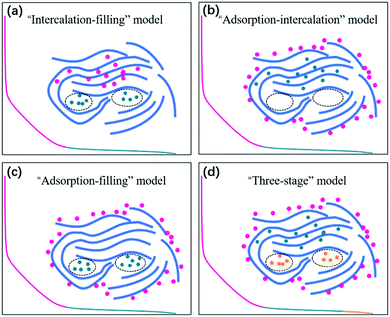 | ||
| Fig. 4 Schematic illustration of the (a) intercalation-pore filling model, (b) adsorption-intercalation model, (c) adsorption-pore filling model, and (d) adsorption-intercalation-pore filling model.35 Copyright 2020, IOPscience. | ||
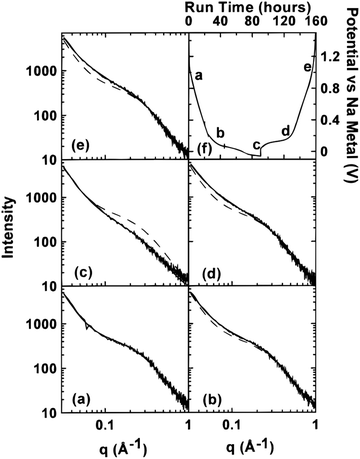 | ||
| Fig. 5 SAXS patterns of (a) unsodiated HC, (b) sodiated HC approaching 0.1 V on discharge cycle, (c) sodiated HC below 0.1 V on discharge cycle, (d) sodiated HC approaching 0.1 V on charge cycle, and (e) fully desodiated HC. The dash lines in (b–e) are the curves fitted to the data in (a). (f) Potential of cells versus sodium metal.43 Copyright 2000, IOPscience. | ||
More recently, operando Raman spectroscopy studies were used to observe G- and D-band energies during sodiation and desodiation. The G-band at ∼1590 cm−1 corresponds with graphene sheets producing Raman scattering from E2g symmetry.44,45 A shift to lower G-band peak position during sodiation indicates electron transfer from intercalated sodium-ions into the conduction bands of the graphene planes. Weaving et al.,46 observed a steady decrease in energy of the G-band coinciding with the voltage region between 0.7 and 0.1 V. This result suggests intercalation of sodium ions occurred in the higher voltage sloping region of the voltage capacity curves (Fig. 6). In comparison, the G-band peak position did not shift as the cell voltage dropped below 0.1 V. Based on these findings, the authors proposed that sodium-ion storage proceeds via intercalation in the high voltage region and pore-filling in the low voltage region, in good agreement with that of Stevens and Dahn.43,44
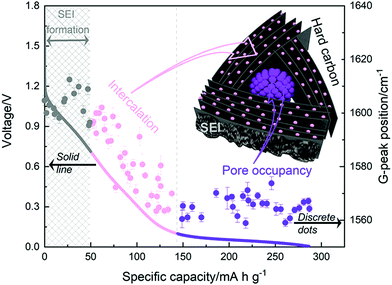 | ||
| Fig. 6 The GCD profile (solid line) and relative G-band peak position (discrete dots) during first discharge cycle: grey (line and dots) refers to the formation of solid electrolyte interface (SEI), pink (line and dots) refers to intercalation of sodium-ions between graphene layers, and purple (line and dots) refers to filling of sodium ions in pores.46 Copyright 2020, American Chemical Society. | ||
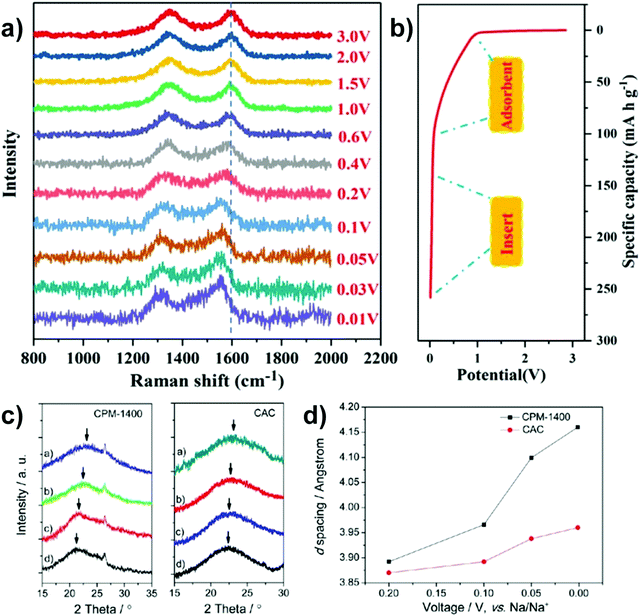 | ||
| Fig. 7 In situ Raman spectra (a) with corresponding discharge states (b).47 Copyright 2021, Elsevier. XRD profiles (c) with corresponding d-spacing of (002) crystal plane(d).48 Copyright 2013, American Chemical Society. | ||
 | ||
| Fig. 8 GCD curves of HC samples without (a) and with sulphur filling in pores (b). (c) DFT pore size distribution curves of samples before (HC1000) and after sulphur filling (HC1000-S).52 Copyright 2018, Wiley. | ||
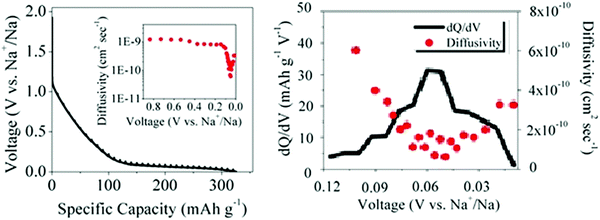 | ||
| Fig. 9 (a) GITT discharge profiles and sodium-ion diffusivity (inset), and (b) variation of dQ/dV and sodium-ion diffusivity as a function of voltage for a HC.56 Copyright 2015, American Chemical Society. | ||
To probe the proposed “three-stage” sodium-ion storage model, Jin et al.54 synthesised a series of resorcinol formaldehyde (RF) resin-derived HC samples with variation in physical properties. To elucidate the relationship between sodium-ion storage mechanism and HC properties, the authors compared the microstructural traits of HC prepared at different thermal treatment temperatures ranging between 800 °C and 1600 °C with observed electrochemical analysis. At low thermal treatment temperatures (below 1000 °C), the microstructure was dominated by small graphitic domains with a high degree of cross-linking bonds and surface defect sites. At intermediate temperatures (above 1000 °C, below 1300 °C), the breakdown of cross-linking bonds and heteroatom content led to increased stacking of graphene layers, and formation of confined spaces (closed pores) inaccessible from the surface, located between the unevenly stacked graphene planes. At high temperatures (Above 1300 °C), growth of graphitic domains and reduction in surface defects continued. However, the authors observed from FE-TEM images, the graphitic domains had less curvature radius and as a result a reduction in confined space, when the pyrolysis temperature was raised above 1300 °C. This is associated with the increased degree of structural ordering, confirmed by the observed sharper (002) XRD peak which also shifted to higher two Theta angles. Electrochemically, the variation in physical structure resulted in changes to galvanostatic profiles, sodium ion storage specific capacity and diffusivity (Fig. 10a–e).54Fig. 10f clearly shows that as pyrolysis temperature increases the sodium ion storage contributed from the adsorption mechanism decreases, contributed from the intercalation mechanism increases and a maximum capacity of ∼160 mA h g−1 is achieved from the pore-filling mechanism at 1300 °C. The total discharge capacities of the samples are between 210 and 325 mA h g−1. This was confirmed by a distinct change in sodium-ion diffusivity was observed within this region.56 As the voltage drops below 0.1 V, the sodium-ion diffusion coefficient drops significantly, before increasing again as cut-off voltage is reached (Fig. 10a–e insets). According to the authors, the decrease in diffusivity is associated with sodium-ion intercalation within the interlayer spacing of graphitic domains, whilst the increase in diffusivity is due to the pore-filling mechanism. Furthermore, depending on the thermal treatment temperature, the observed point where the diffusion coefficient of sodium-ions changes occurs at different voltages. This suggests, depending on the physical properties of HC, more or less sodium-ion storage contribution from intercalation or pore filling is observed. It seems, for the samples used in this study, an optimal thermal treatment temperature is about 1300 °C where maximum capacity is obtained particularly in the plateau region. Lastly, by comparing the observed electrochemical results with the physical properties of the HC samples, this study provides strong evidence for the three-stage sodium-ion storage mechanism in HC.
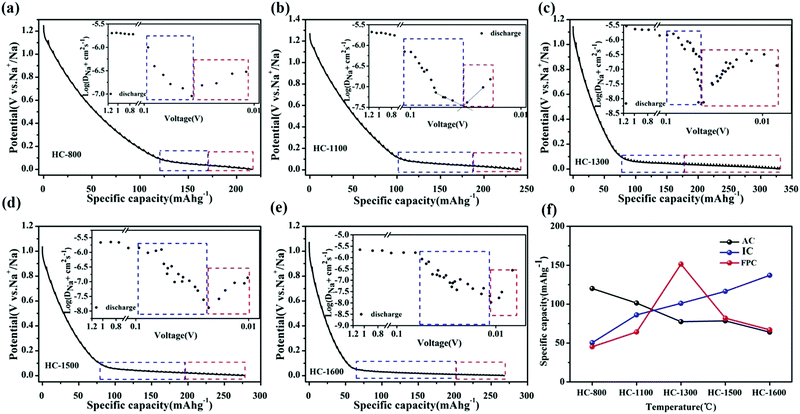 | ||
| Fig. 10 GITT profiles of RF-derived HC samples carbonised at (a) 800 °C, (b) 1100 °C, (c) 1300 °C, (d) 1500 °C and (e) 1600 °C with sodium ion storage contributions from intercalation (blue) and pore-filling (red) mechanisms. The insets show the sodium ion diffusion coefficients in the samples. (f) Relationship between adsorption (AC), intercalation (IC) and pore-filling (FPC) charge storage mechanisms and thermal treatment temperature.54 Copyright 2018, American Chemical Society. | ||
The 23Na magic-angle spinning (MAS) nuclear magnetic resonance (NMR) technique was used to study sodium ion storage mechanism in HC by Gotoh et al.53 Broadening of signals between −9 and −16 ppm was observed as voltage dropped below 0.1 V (Fig. 11). A subsequent study confirmed that this signal is attributed to the restricted mobility of sodium ions in nanocavities. The increased broadening being attributed to increased sodium-ion capacity, and variation in state of sodium as a result of heterogeneous distribution of closed pores within HC.57 Furthermore, the broadness of the peak also reflects the slow diffusion of sodium ions within the HC microstructure. Meanwhile, the sharper peaks at approximately 10 ppm was assigned to insertion of Na ions between parallel and near parallel graphene layers.53
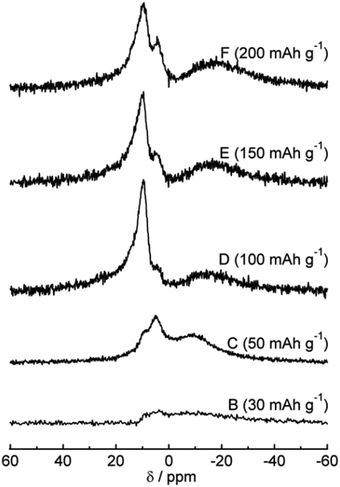 | ||
| Fig. 11 23Na MAS NMR spectra at various states of charge.53 Copyright 2013, Elsevier. | ||
It is obvious from the above discussion that discrepancy surrounding the correct model of sodium-ion storage relative to the high and low voltage profiles of GCD curves remains. Based on the literature data, it seems the adsorption-intercalation-pore filling model is a good representation of sodium-ion storage in HC materials. However, the exact charge storage mechanism responsible for a voltage region remains inconclusive. It does need to be pointed out that the pore-filling mechanism particularly refers to the filling of sodium-ions into closed pores in HC.58 The charge storage in open pores is categorised in the adsorption mechanism.
3. Biomass precursors and processing methods for hard carbon
Biomass precursors are readily available so cost-effective, and can be categorised as (1) lignocellulosic composite directly obtained from biomass,59,60 and (2) individual biopolymer constituents such as cellulose61 and lignin.62 Lignocellulosic biomass is widely distributed, abundant and easily accessible.63 These traits make HC derived from lignocellulose biomass cost-effective and appealing to practical applications. Also, to increase the sustainability of battery materials, there has been considerable attention towards HC materials sourced from previously end of life materials, such as agricultural wastes.59,64 For example, peanut shell derived HC has been investigated for sodium-ion host materials as approximately six million tonnes of peanut shell waste is produced each year worldwide with limited reusability.60 In addition, the peel of shaddock fruit, a popular fruit consumed in South East Asia, is generally discarded as biodegradable waste following fruit consumption and has also shown positive sodium-ion storage performance following carbonisation.65 Due to the abundance and variation in chemical composition of each biomass source, HC materials from different precursors show different electrochemical properties (Table 2). In addition to being cheap and sustainable, the chemical composition along with the macro and micro-architecture associated with variation in biomass can facilitate unique properties.65–67 For instance, tamarind is known to hyper accumulate Ca-ions from the soil during growth resulting in Ca-rich organic biomass.68 A study showed that doping of Ca-ions resulted in HC with expanded interlayer spacing. The structural change as a result of the Ca doping changed the storage and diffusion of sodium-ions within the HC.68 Therefore, the selection of precursor plays an important role in producing electrode materials with tuneable structural properties in response to desired electrochemical properties.| Precursor | Preparation conditions | Electrolyte | Capacity/ICE | Capacity retention | Ref. |
|---|---|---|---|---|---|
| a EC: ethylene carbonate, DEC: diethyl carbonate, PC: propylene carbonate, FEC: fluoroethylene carbonate. | |||||
| Garlic | Carbonisation at 1300 °C | 1 M NaClO4 in EC/DEC (1![[thin space (1/6-em)]](https://www.rsc.org/images/entities/char_2009.gif) : :![[thin space (1/6-em)]](https://www.rsc.org/images/entities/char_2009.gif) 1) with 5 wt% FEC. 1) with 5 wt% FEC. |
260 mA h g−1 at 0.05 A/g/50.7% | 80% after 10![[thin space (1/6-em)]](https://www.rsc.org/images/entities/char_2009.gif) 000 cycles 000 cycles |
69 |
| Peanut shell | Hydrothermal pre-treatment, carbonisation at 800 °C | 1 M NaClO4 in EC![[thin space (1/6-em)]](https://www.rsc.org/images/entities/char_2009.gif) : :![[thin space (1/6-em)]](https://www.rsc.org/images/entities/char_2009.gif) PC (1 PC (1![[thin space (1/6-em)]](https://www.rsc.org/images/entities/char_2009.gif) : :![[thin space (1/6-em)]](https://www.rsc.org/images/entities/char_2009.gif) 1) 1) |
261 mA h g−1 at 0.1 C/58% | >95% after 100 cycles | 70 |
| Sucrose | Hydrothermal pre-treatment, carbonisation temperature 1600 °C | 1 M NaClO4 in EC![[thin space (1/6-em)]](https://www.rsc.org/images/entities/char_2009.gif) : :![[thin space (1/6-em)]](https://www.rsc.org/images/entities/char_2009.gif) DEC (1 DEC (1![[thin space (1/6-em)]](https://www.rsc.org/images/entities/char_2009.gif) : :![[thin space (1/6-em)]](https://www.rsc.org/images/entities/char_2009.gif) 1) 1) |
Approx. 300 mA h g−1/83% | >90% after 100 cycles | 71 |
| Cuttlebone | Carbonisation at 600 °C | 1 M NaClO4 in EC![[thin space (1/6-em)]](https://www.rsc.org/images/entities/char_2009.gif) : :![[thin space (1/6-em)]](https://www.rsc.org/images/entities/char_2009.gif) DEC (1 DEC (1![[thin space (1/6-em)]](https://www.rsc.org/images/entities/char_2009.gif) : :![[thin space (1/6-em)]](https://www.rsc.org/images/entities/char_2009.gif) 1) 1) |
640 mA h g−1 at 0.1 A/g/51.5% | >90% after 10![[thin space (1/6-em)]](https://www.rsc.org/images/entities/char_2009.gif) 000 cycles 000 cycles |
72 |
| Tea Leaves | Hydrothermal pre-treatment, carbonisation at 600 °C | 1 M NaClO4 in EC![[thin space (1/6-em)]](https://www.rsc.org/images/entities/char_2009.gif) : :![[thin space (1/6-em)]](https://www.rsc.org/images/entities/char_2009.gif) DEC (1 DEC (1![[thin space (1/6-em)]](https://www.rsc.org/images/entities/char_2009.gif) : :![[thin space (1/6-em)]](https://www.rsc.org/images/entities/char_2009.gif) 1) 1) |
179 mA h g−1 at 100 mA/g/below 60% | >98% after 100 cycles | 73 |
| Lotus Stem | Carbonisation temperature 1400 °C | 1 M NaClO4 in EC![[thin space (1/6-em)]](https://www.rsc.org/images/entities/char_2009.gif) : :![[thin space (1/6-em)]](https://www.rsc.org/images/entities/char_2009.gif) DEC (1 DEC (1![[thin space (1/6-em)]](https://www.rsc.org/images/entities/char_2009.gif) : :![[thin space (1/6-em)]](https://www.rsc.org/images/entities/char_2009.gif) 1) 1) |
351 mA h g−1 at 40 mA/g/70% | 94% after 450 cycles | 58 |
| Spinifex Grass | Carbonisation at 1000 °C | 1 M NaClO4 in EC![[thin space (1/6-em)]](https://www.rsc.org/images/entities/char_2009.gif) : :![[thin space (1/6-em)]](https://www.rsc.org/images/entities/char_2009.gif) PC (1 PC (1![[thin space (1/6-em)]](https://www.rsc.org/images/entities/char_2009.gif) : :![[thin space (1/6-em)]](https://www.rsc.org/images/entities/char_2009.gif) 1) with 0.3 wt% FEC 1) with 0.3 wt% FEC |
366 mA h g−1 at 20 mA/g/50% | 99% after 10 cycles | 74 |
| Recycled cork | Carbonisation at 1600 °C | 1 M NaPF6 in EC![[thin space (1/6-em)]](https://www.rsc.org/images/entities/char_2009.gif) : :![[thin space (1/6-em)]](https://www.rsc.org/images/entities/char_2009.gif) DMC (1 DMC (1![[thin space (1/6-em)]](https://www.rsc.org/images/entities/char_2009.gif) : :![[thin space (1/6-em)]](https://www.rsc.org/images/entities/char_2009.gif) 1) 1) |
385 mA h g−1/81% | 71% after 2000 cycles | 38 |
3.1. Lignocellulosic biomass
Lignocellulose is composed of cellulose, hemicellulose, pectin and lignin. The lignocellulosic composition of biomass can vary considerably from source to source. Timbers are composed of up to 50 wt% cellulose and approximately 25% of hemicellulose and lignin, respectively.75 However, the hemicellulose composition of leaves and grasses range from 50% to 80%. In addition, nutshells are intermediate between woods and grasses and leaves, with the quantity of lignin and/or pectin ranging between 30 and 40% and 25–30% cellulose and hemicellulose, respectively.75 What is also interesting is that peanut shells show significant variation in lignocellulose composition between the inner and outer layers.60 Furthermore, in comparison to timbers, leaves and grasses and nutshells, fruits have relatively high amounts of pectin.76,77 Cellulose, hemicellulose, lignin and pectin are made of different subunits/polymer composition and result in different carbon structures following pyrolysis.78 But, variation in lignocellulosic composition can lead to inconsistent physical, chemical and electrochemical properties of biomass-derived HC anode materials in sodium-ion energy storage devices.64,793.2. Biopolymers & monomers
To reduce the impact of compositional variability on the electrochemical performance of biomass-derived HC anode materials, extraction and pyrolysis of individual or tuned combinations of biopolymers has been explored.77 Cellulose and hemicellulose are the main structural components of biomass, and its fibrils are bound together by lignin and pectin (Fig. 12).66,80 Cellulose is consisted of long chains of D-glucose subunits with α-(1,4)-glycosidic linking bonds. In lignocellulose, the long cellulose polymers are reinforced by hemicellulose and lignin. Hemicellulose consists of short monosaccharide units bound together by α-(1,4)-glycosidic, and α-(1,3)-glycosidic linking groups. Lignin is large and complex, containing three types of phenyl propionic alcohols linked with alkyl–aryl, alkyl–alkyl, and aryl–aryl ether bonds.81 The variation in chemical composition of different biopolymers can lead to different carbon microstructures by following high temperature pyrolysis.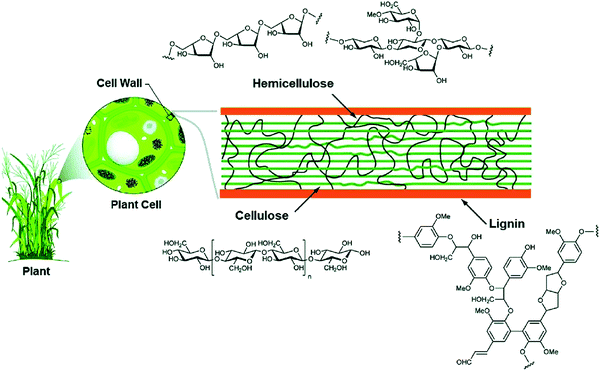 | ||
| Fig. 12 Lignocellulose composition of plant biomass and the chemical structure of each subunit (cellulose, hemicellulose and lignin).81 Copyright 2020, Springer Nature. | ||
Mono- and disaccharides such as glucose82,83 and sucrose84 are also frequently studied biomass precursors.71,85 Glucose is a six-carbon chain monomer with each carbon bonded to a hydroxyl group. D-Glucose is a cyclic form of glucose consisting of a hemiacetal linkage bond. The high oxygen content of the above-discussed precursor materials is considered one of the main contributors towards the non-graphitisable nature of HC.40
3.3. Processing methods
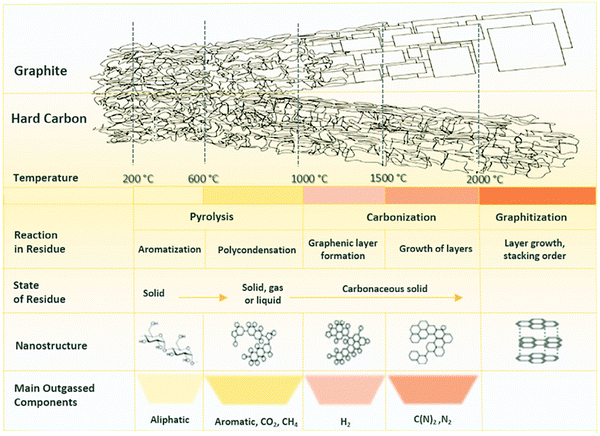 | ||
| Fig. 13 A schematic illustration representing the changes in chemical and structural characteristics of HC in response to pyrolysis.86 Copyright 2019, Elsevier. | ||
Multi-heteroatom doping of more than one elements has been shown to display synergistic effects on the sodium-ion storage behaviour of HC materials.99 Because heteroatoms are present in many biomasses, it is more convenient to prepare heteroatom-containing carbon materials by selecting a precursor which contains the desired heteroatom(s). For example, Mao et al.101 used gelatine to prepare porous carbon materials with a high nitrogen content.
In summary, carbonisation methods and material engineering techniques such as surface modification and heteroatom doping can all be used to alter the macro and microstructural properties of HC in attempts to progress the electrochemical performance of biomass-derived HC as sodium-ion storage host material.
4. Effect of preparation conditions on hard carbon properties
4.1. Effect of thermal treatment on surface properties
The surface of HC is made up basal and edge graphitic planes scattered with intrinsic vacancy defects and extrinsic surface functional groups. These surface defects alter the chemistry of HC when interacting with sodium-ions, resulting in variation in sodium-ion storage capacity and transport kinetics.102 Much like the microstructure, the surface chemistry of biomass-derived HC is also dependent on the precursor and processing parameters. A study of Passerini et al.59 compared the physical, chemical and electrochemical properties of HC materials derived from apple waste, corncob and peanut shell and carbonised at 1100 °C for 1 h. According to the X-ray photoelectron spectroscopy (XPS) results, the atomic surface chemical composition varied from sample to sample due to differences in the chemical composition of the biomass precursors. The atomic surface oxygen contents of the carbon samples derived from apple waste, corncob and peanut shell were 6.1, 10.3 and 10.6 at%, respectively. It is also worth mentioning, although the atomic percentage of oxygen is similar for the corncob and peanut shell derived samples, the type of oxygen functional groups differs. The percentages of O–H, O![[double bond, length as m-dash]](https://www.rsc.org/images/entities/char_e001.gif) C and O–C functional groups for the corncob-derived sample were 11.9, 19.4 and 68.2 at%, respectively, whilst for the peanut shell-derived sample the percentages of these functional groups were 15.6, 39.9 and 54.5%, respectively.59 Therefore, the peanut shell derived HC had two times more carbonyl groups in comparison with the corncob-derived HC. According to Liu et al.,103 C
C and O–C functional groups for the corncob-derived sample were 11.9, 19.4 and 68.2 at%, respectively, whilst for the peanut shell-derived sample the percentages of these functional groups were 15.6, 39.9 and 54.5%, respectively.59 Therefore, the peanut shell derived HC had two times more carbonyl groups in comparison with the corncob-derived HC. According to Liu et al.,103 C![[double bond, length as m-dash]](https://www.rsc.org/images/entities/char_e001.gif) O groups are able to increase the surface wettability of HC towards non-aqueous electrolytes, leading to improved HC electrolyte interactions.
O groups are able to increase the surface wettability of HC towards non-aqueous electrolytes, leading to improved HC electrolyte interactions.
Extrinsic defects such as the above-mentioned oxygen-containing functional groups and the presence of heteroatoms are more sensitive to pyrolysis temperatures. As the pyrolysis temperature was increased from 800 to 1200 °C the surface oxygen content of sweet gum seed derived HC decreased in the oxygen content according to XPS analysis.104 In addition, the distribution of oxygen groups changed from C–O to C![[double bond, length as m-dash]](https://www.rsc.org/images/entities/char_e001.gif) O with increasing temperature. For example, the at% of C
O with increasing temperature. For example, the at% of C![[double bond, length as m-dash]](https://www.rsc.org/images/entities/char_e001.gif) O increased from 22.95% to 66.72% for buckwheat derived HC as carbonisation temperature was increased from 700 to 1300 °C.103
O increased from 22.95% to 66.72% for buckwheat derived HC as carbonisation temperature was increased from 700 to 1300 °C.103
Other major dopants, which can be introduced by the precursor, or via post treatment, follow the same trend, as the carbonisation temperature increases, the overall dopant content decreases. For example, the nitrogen percentages according to XPS analysis of honey derived HC carbonised at 700, 800 and 900 °C were 3.57, 2.31 and 1.04 wt%, respectively.105 In addition, the nitrogen functionality also changes in response to increase carbonisation temperature. For instance, when the temperature was increased from 600 to 900 °C in thermal treatment of nitrogen doped reduced graphene oxide samples, the pyrrolic nitrogen at% decreased from 3.94 to 1.15 at%, the pyridinic nitrogen content increased from 1.85 to 2.07 at% whereas the graphitic nitrogen content remained consistent to be around 0.77–0.76 at%. According to Yuan et al., thermal treatment creates self-rearrangement of C–N bonds, with the pyrrolic N being less thermally stable resulting in conversion to other forms of N–C configurations.105 Therefore, as carbonisation temperature increases, the surface nitrogen content decreases in total atomic percentage, and a self-rearrangement of atoms occurs leading to higher content of pyridinic nitrogen and less pyrrolic nitrogen.
Intrinsic defects are also prevalent in HC materials. The Raman spectroscopy technique is often used to characterise intrinsic defective sites in carbon. The D1-band observed through deconvolution of the D-band in Raman spectra represents the presence of intrinsic edge defects on graphene sheets.33,82 According to Gomez-Martin et al.,106 the ID1/IG ratio is indicative of defect concentration of HC. At lower carbonisation temperatures, there is insufficient thermal energy to reduce the defect concentration. For olive pit derived HC samples pyrolysed at temperatures of 800, 1000 and 1200 °C, the ID1/IG values were 3.63, 3.76 and 3.58, respectively. At carbonisation temperatures of 1400, 1600 and 2000 °C, the ID1/IG value of the same olive pit derived HC decreased significantly to 2.47, 2.49 and 1.97, respectively.106 This suggests above 1200 °C the intrinsic defects were significantly removed with increasing carbonisation temperature. It is also important to point out that the concentration of intrinsic defects is proportional to the degree of graphitic organisation of the carbon structure. HC with larger amounts of pseudo-graphitic and graphitic like ordering will have less intrinsic defects than highly disordered HC.107 This is also further evidenced by the shaper (002) XRD diffraction peak for samples pyrolysed above 1200 °C evidencing the higher degree of carbon ordering.
The specific surface area of HC materials varies significantly depending on precursors used and processing conditions.69,84 Liu et al.69 investigated changes in specific surface area using a garlic precursor in the carbonisation temperature range between 1100 and 1500 °C and observed a decrease in BET surface area from 196 to 37 m2 g−1. In comparison, the specific surface area of a banana peel derived HC carbonised at 1100 °C was about 19.3 m2 g−1,108 approximately 175 m2 g−1 less than the garlic derived HC carbonised at the same temperature.69 It is also worth mentioning that the decrease in specific surface area becomes more and more insignificant as carbonisation temperature increases, particularly above 1300 °C.109 Therefore, both carbonisation temperature and precursor selection are important parameters to consider when HC specific surface area is concerned. It is worth pointing out that high-temperature carbonisation is undesired due to decrease in graphitic layer d-spacing, as well as an increase in production cost.110
4.2. Effect of thermal treatment on porosity
Understanding the relationship between electrochemical performance and porous properties (pore size, shape and distribution, and accessibility to charges) is important for future research and development of HC anode materials.50 During pyrolysis, the graphitic domains stack one on the other and extend in length and thickness as the carbonisation temperature increases. During this structural rearrangement of the graphitic domains, the electrolyte-accessible (open) and inaccessible (closed) pores are formed (Fig. 15).40 It is worth mentioning that the formation of closed pores occurs from overlapping of graphitic crystallites, leading to voids being inaccessible to most probe gas molecules such as nitrogen and helium, as well as electrolyte.111 | ||
| Fig. 15 Schematic comparison of the microstructural features of HC materials prepared at (a) low and (b) high pyrolysis temperatures. | ||
Gomez-Martin and co-workers studied temperature effect on microstructure of olive pit derived HC. 106 They observed that at low carbonisation temperatures the graphitic domains are randomly orientated with small La and Lc values, leading to the formation of a high volume of open pores and low volume of closed pores (Fig. 15a). By analysing the physical adsorption data of N2 and CO2 using the two-dimensional non-local density functional theory (2D-NLDFT) method, the authors found that a HC sample carbonised at 800 °C possessed the majority of open pores in the size range between 2 and 3 nm and 0.35 to 0.6 nm, respectively. By comparing the skeletal density of the sample (1.96 g cm−3) with the theoretical density of graphite (2.26 g cm−3), it was concluded that this HC had limited closed pore volume. At high carbonisation temperatures, the graphitic domains became better organised with extended La and Lc dimensions. This multi-dimensional growth of the graphitic domains led to a reduction in open pore volume and a simultaneous increase in closed pore volume (Fig. 15b).106 The open pore of olive pit derived HC increased in size from 4 to 7 nm when the carbonisation temperature was increased from 800 to 1200 °C. However, negligible ultramicroporosity was realised through CO2 gas adsorption analysis. Interestingly, the true density of the HC sample carbonised at 1200 °C decreased significantly to 1.41 g cm−3 in comparison with that of the HC sample carbonised at 800 °C (1.96 g cm−3). The lower skeletal density suggests the volume of closed pore increased as carbonisation temperature increased.106
Small angle X-ray scattering (SAXS) patterns extracted from synchrotron X-ray analysis showed variation in the broadness of the Q-values as carbonisation temperature increased.112 The variation suggests changes in pore size, which is supported by the results from physical adsorption and density measurements.84 In comparison to pore size, the total accessible pore volume measured via gas physical adsorption decreased with increasing carbonisation temperature.41,113,114 Because closed pores are inaccessible to gases (e.g., helium, nitrogen, argon, and carbon dioxide), a complete understanding of the porosity of HC needs gas physical adsorption analysis coupled with true density and SAXS measurements. According to Franklin, the near-parallel stacking of the basal planes of graphitic domains combined with the strong crosslinking bonds leads to the formation of fine porous structures of HC.115 Therefore, the evolution of porosity of HC in response to increasing pyrolysis temperature occurs through an increase in open pore size, but a decrease in total open-pore volume. For closed pore volume, however, it in general increases from low to intermediate carbonisation temperatures, and then decreases at high carbonisation temperatures (Fig. 16).58 Above 1600 °C, the growth and alignment of the graphitic domains begin to reduce the closed pore volume.39
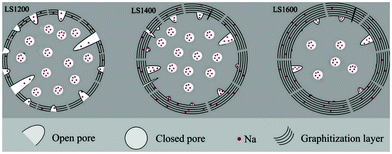 | ||
| Fig. 16 Illustration of the evolution of porosity as a result of increasing thermal treatment at 1200 °C (LS1200), 1400 °C (LS1400) and 1600 °C (LS1600).58 Copyright 2018, Elsevier. | ||
4.3. Effect of thermal treatment on graphitic domains
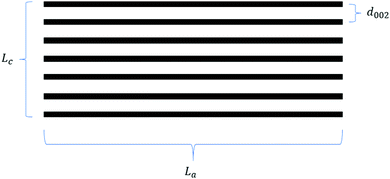
From the early work of Stevens and Dahn,42 which draws on comparisons between lithium and sodium-ion storage in HC to more recent studies which tune the HC structure to elucidate the intercalation mechanism,50,84,114 sodium-ion storage in HC via the intercalation mechanism into graphitic domains is regarded as a key factor for improving the HC electrochemical performance. This intercalation of sodium ions in graphite domains is related to the three defining characteristics as illustrated in Fig. 17, namely the crystallite thickness along the c-axis (Lc), the crystallite width along the a-axis (La), and the d-spacing between graphene layers (d002). The evolution of graphitic domains and these defining characteristics during pyrolysis follows a general trend (Fig. 3).These three parameters define the microstructural features of the graphitic domains within HC materials.114 According to Komaba et al.,84 as carbonisation temperature is increased from 600 to 1200 °C, the crystallite thickness (Lc) of a sucrose-derived HC remained between 7 and 8 Å as calculated from XRD data. However, as the carbonisation temperature increased above 1200 °C, an increase in crystallite thickness of approximately 1.1 Å for every 100 °C occurred, up to 2000 °C.84 In addition, the crystallite width (La) also followed a similar trend, albeit slightly more linear growth as a function of increasing carbonisation temperature.114 For example, the in-plane domain size (La measurement), or the length of the graphitic domain for the sucrose-derived HC samples obtained at pyrolysis temperatures of 900, 1100, 1300, 1600 and 1800 °C were 14.4, 16.5, 18.6, 23.2 and 28.0 Å, respectively.84 These results suggest the growth of the graphitic domains along the a-axis is at least more energetically favourable in comparison to the growth along the c-axis below carbonisation temperatures of 1500 °C. However, growth along both c- and a-axes occur rapidly as temperatures exceed 1500 °C.
Studies have shown that there is an inverse relationship between the d-spacing and pyrolysis temperature,55,84,116,117 especially at high temperatures. It is clearly seen from the XRD patterns of HC samples pyrolysed at different temperatures in Fig. 18a that as the pyrolysis temperature increased, shift in the (002) peak position to higher degrees two theta occurred, suggesting a gradual decrease in d-spacing, particularly at temperatures above 1300 °C (Fig. 18b).78Fig. 18b also shows that in the pyrolysis temperature range between 1300 and 2000 °C, the graphite crystallite thickness increases as temperature increases.
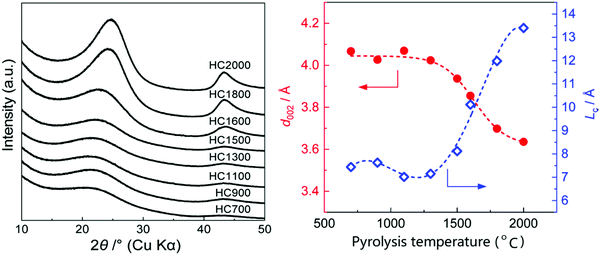 | ||
| Fig. 18 (a) XRD patterns of sucrose-derived HC samples pyrolysed at temperatures between 700 and 2000 °C, and (b) relationship between d-spacing and graphitic crystallite length along the c-axis as a function of pyrolysis temperature.84 Copyright 2020, American Chemical Society. | ||
Therefore, according to current characterisation techniques, as carbonisation temperature increases, the evolution of the graphitic domains increases initially in length (La) of the graphitic domains, followed by simultaneous growth of the crystallite height (Lc) and reduction in d-spacing between graphene layers. Consequently, the number of graphene layers in a single graphite crystallite increase. This can be further validated through the transmission electron microscopy (TEM) images in Fig. 19, which demonstrates the growth in crystallite sizes along both axes as thermal treatment temperature was increased from 700 to 2000 °C.84
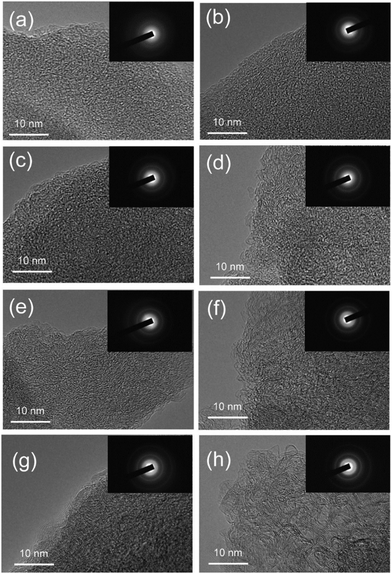 | ||
| Fig. 19 TEM images showing the crystallite size of sucrose-derived HC samples pyrolysed at (a) 700, (b) 900, (c) 1100, (d) 1300, (e) 1500, (f) 1600, (g) 1800, and (h) 2000 °C.84 Copyright 2020, American Chemical Society. | ||
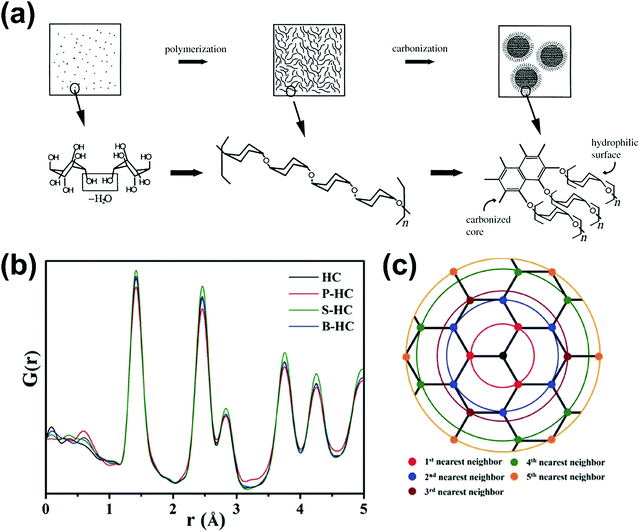
Franklin115 described the graphite crystallite growth phenomenon nicely. The crosslinking of C–C bonds and high oxygen-containing groups require sufficient activation energy to infer graphitisation of the amorphous highly disordered carbon domains. The initial orientation of the carbon bonding interactions found in the precursor will therefore play an important role in the evolution of the graphitic domains relative to high-temperature treatment. Ramirez-Martin et al.106 used the pair distribution function (PDF) method to analyse the interplanar distance between parallel graphene sheets within the graphitic domains of olive pit derived HC (Fig. 20a). PDF is a powerful technique to characterise the microstructure of materials with limited crystalline ordering. According to this study, little variation of in-plane atomic ordering (d100) of the carbon framework was observed as the thermal treatment temperature was increased (Fig. 20b). Moreover, the d100 values remained very close to the in-place atomic arrangement of graphene (2.132 Å). The d-layer spacing (d002) in comparison increased from 3.67 to 3.8 Å, as the carbonisation temperature increases up to 1400 °C. However, the d-spacing then decreases to 3.72 Å as the pyrolysis temperature is increased up to 2000 °C (Fig. 20c).106 Additionally, there is a clear relationship observed between annealing temperature and crystallite size complementary to the TEM findings in Fig. 20d. In addition, out of plane atomic displacement parameter was generated and a linear relationship with annealing temperature was observed (Fig. 20e). According to the author's interpretation, this is due to the increased contraction of d-spacing and simultaneous formation of nanopores as annealing temperature is increased.106
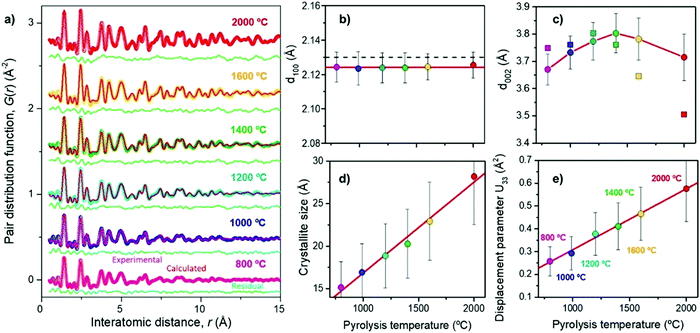 | ||
| Fig. 20 (a) Experimental (coloured) and calculated using the pairs distribution function method (red), (b) d100 spacing, (c) d002 spacing, (d) crystallite size, and (e) out-of-place displacement parameter of d-spacing of olive pit derived HC samples prepared at temperatures ranging from 800 to 2000 °C.106 Copyright 2019, American Chemical Society. | ||
5. Property-performance relationship
HC properties discussed in Section 4 are very much interlinked in response to precursors and processing conditions. This brings about difficulties in optimising HC materials for sodium-ion storage because a trade-off is often required. For example, low specific surface area HCs typically obtained from high-temperature pyrolysis excel in coulombic efficiency and reversible capacity performance. However, the decreased surface area and pore size with increasing pyrolysis temperatures are unfavourable for sodium-ion transport, especially at high charge/discharge currents. For this reason, it is crucial to understand the relationship between HC properties and electrochemical performance especially regarding what macro and microstructural features contribute to an observed performance behaviour. There is currently a great deal of research interest and activity aiming to engineer biomass-derived HC materials for improving NIB performance. This section will provide an evaluation of the macro and microstructural properties of HC and their underlying electrochemical performance relationships. Furthermore, it is important to note, the relationship reported in the literature between certain structural properties and pyrolysis temperature is not definite.5.1. Defects and surface functionalization-performance relationship
Due to the disordered microstructure of HC, the concentration of surface defects is high. The D-band peak observed in Raman spectroscopy at a Raman shift of approximately 1400 cm−1 is indicative of the concentration of various types of defect.118 For HC, the D-band Raman intensity is significantly larger in comparison to graphite for example which has a higher degree of sp2 ordering and negligible surface defects.119 The presence of defects contribute to the interaction between electrode surface and electrolyte, playing an important role in electrochemical performance.120 The electrode/electrolyte interface influences the coulombic efficiency, charge storage capacity, rate performance and electrochemical stability of HC anodes.121 Intrinsic defects and extrinsic surface functionalities are two important factors determining the surface properties of HC materials.As mentioned, the surface of carbon materials are intrinsically made of basal and edge planes.122 Basal planes make up the most significant portion of the total surface area, but have negligible electrochemical activity towards sodium ions.123,124 Edge planes on the other hand, refer to the active surface which plays a decisive role in the electrochemical activity of HC materials.50,124 Intrinsic edge defects in HC are formed in response to distortions or loss of carbon atoms within the extended carbon matrix.82,125 Distortions and removal of carbon atoms within the matrix lead to Stones-Wales defects, monovacancies, divacancies and edge defects in the HC framework.82 DFT calculations suggest because of the disruption to the local electron density, the introduction of vacancy defects in HC increases the sodium-ion adsorption energy.126 According to Guo et al.,82 the adsorption energies of sodium-ions on the surface of pristine, mono-, and divacancy defective sites in graphene were 0.22, −0.58 and −1.01 eV, respectively. The more negative adsorption energies are suggestive of more favourable for sodium-ion adsorption for both mono- and divacancy defects (Fig. 21). This is due to the ability of the defect sites to accumulate electron charge density. Similarly, Singh et al.,127 observed stronger adsorption energies of sodium-ions on the surface of double-vacancy graphene in comparison to pristine graphene. However, It was also accompanied by an increase in sodium-ion migration activation barrier by approximately 0.4 eV.126 Furthermore, Xiao et al.32 report the strong binding interaction between sodium-ions and intrinsic defect location caused a sodium-ion trapping effect, with the trapped ion then creating a repulsive electric field. What this led to was reduced theoretical sodium-ion capacity. Therefore, the intrinsic defects may increase the sodium-ion storage capacity, but the stronger binding interaction can decrease migration of sodium-ions and lead to loss in reversible capacity and reduced sodium ion diffusion. It is worth pointing out that these observations are based upon single sodium-ion interactions only. When subsequent sodium-ions are introduced into the system, the binding energies between the defect site and sodium-ion can decrease.127
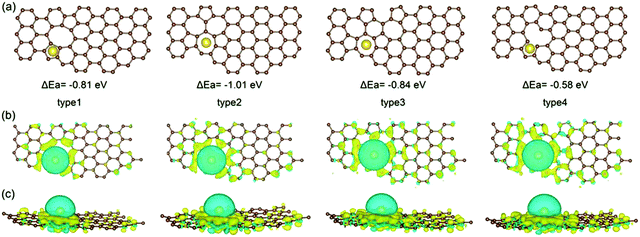 | ||
| Fig. 21 Computational simulations of sodium-ion adsorbed on di-vacancy defects of Types 1–3 and single-vacancy defects of Type 4 in HC viewed from top (a and b) and side (c).82 Copyright 2020, Wiley. | ||
The loss in reversible capacity is partially due to the trapping of sodium-ions at defective sites.32,50,128,129 Xiao et al.32 prepared low-defect sucrose derived HC samples at pyrolysis temperature of 1300 °C with different heating rates and observed a superior ICE for the sample carbonised at the slowest heating rate, namely 0.5 °C min−1. The authors attributed the increase in ICE to the reduction in intrinsic surface defects as a result of using a slower heating rate during pyrolysis.32 In addition, through theoretical analysis the authors found that the strong interaction between sodium ions and defects created a dual trapping and repulsive effect, suggesting a more sparse accumulation of cations in the graphene lattice occurs in the presence of basal defects compared with pristine graphite (Fig. 22).32
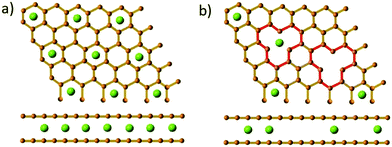 | ||
| Fig. 22 Illustration of Na-ion storage formulation between (a) pristine graphite and (b) vacancy-defective graphite.32 Copyright 2018, Wiley. | ||
Much like intrinsic surface defects, extrinsic defects such as surface heteroatom functional groups also influence the surface chemistry of HC to a large extent.130 Doping of heteroatoms such as nitrogen, boron, sulphur, fluorine and phosphorus can be used to create surface functionalities. These dopants can be added singularly or multiply to the HC material to obtain certain cumulative contributions. Depending on the heteroatom/s used, doping of HC occurs via heteroatom substitution of carbon atoms by elements such as nitrogen131,132 and boron133 or surface transfer doping by sulphur,134,135 fluorine136 and phosphorus137 between the carbon layers. Substitution doping agents lead to a change in disruption of the localised electron density whilst the surface transfer dopants can lead to enlarged interlayer spacings and geometric distortion.138 Therefore, due to the sluggish kinetics of sodium-ion transport typically observed in the bulk of HC, heteroatom doping has been explored to improve the rate capability and capacity of HC through increasing the surface-active sites and adjusting the internal microstructure of HC.102
Disruption to local electron density caused by the substitution of carbon atoms with nitrogen or boron heteroatoms, is thought to provide additional electrochemical reactivity and surface wettability towards electrolytes.125 These improved properties are a result of several structural and electrochemical changes to the HC surface. For example, the larger electronegativity of nitrogen in comparison to carbon creates polarisation in the carbon matrix and improves electron-accepting properties.102 Ideal for the attraction of sodium-ions.
Nitrogen commonly adopts one of the following three bonding configurations within the carbon matrix: (1) pyrrolic nitrogen where nitrogen adopts a position in a five membered ring with nitrogen situated in the position open to the monovacancy, (2) pyridinic nitrogen where the nitrogen adopts a position in a six membered ring with nitrogen situated in the position open to the vacancy defect, and (3) quaternary or graphitic nitrogen where nitrogen adopts a position in a six membered ring without any surrounding vacancies (Fig. 23).125,138
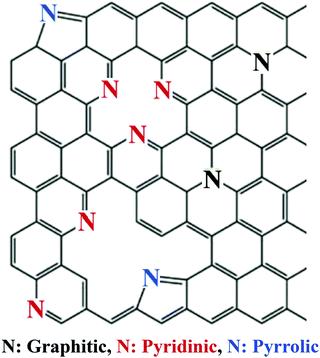 | ||
| Fig. 23 The various nitrogen configurations within a carbon framework.139 Copyright 2018, Elsevier. | ||
Due to the proximity of the pyrrolic and pyridinic nitrogen to the defective sites, local electron resonance is destabilised. Conversely, the 2s2 and 2p3 valence electrons for nitrogen are stabilised in graphitic nitrogen due to the uninterrupted local π-orbital resonance.140 According to DFT calculations, pyrrolic, pyridinic and graphitic nitrogen doped HCs have lower energy barriers in comparison to pristine graphene towards sodium-ion diffusion. This suggests nitrogen doping can increase the ionic conductivity of HC, thus promoting the diffusion of sodium-ions within the HC matrix. Interestingly, the diffusion of sodium-ions in pyrrolic and pyridinic nitrogen doped HC is towards the nitrogen and defective locations, whereas for the graphitic nitrogen-doped system the sodium-ions migrate away from the doped site.138 Therefore, theoretically pyrrolic, pyridinic and graphitic nitrogen doping is considered to influence the ionic conductivity with pyrrolic and pyridinic also influencing the chemical reactivity of HC surfaces.
It has been experimentally observed that nitrogen doping leads to mixed electrochemical results with the major challenge being the ability to tune the configuration of the nitrogen, in favour of high content of pyridinic and/or pyrrolic nitrogen species.141 However, studies which have been able to achieve high pyridinic and/or pyrrolic nitrogen-doped HC have shown positive results for sodium-ion storage and diffusion properties.142 For example, Longan shell derived HC samples with in situ doped nitrogen thermally treated at 600, 700, 800 and 850 °C showed slight variation in nitrogen content according to elemental and XPS analysis. However, closer analysis of the N 1s XPS spectra indicated the sample carbonised at 800 °C had the highest content of pyridinic nitrogen. In addition, the HC sample with higher pyridinic nitrogen had superior capacity, rate performance and cycling stability at 5 A g−1.142 Thus, it is not just the presence of heteroatoms, but also the configuration of the heteroatoms within the carbon matrix that influences electrochemical performance. It is also important to understand, the greater surface area could also be contributing to these results.
Unlike nitrogen, boron is an electron-deficient doping agent in comparison to carbon. As such it can alter the electrochemical properties of HC materials in different ways. According to Qiu et al.,133 the electron-deficient state of boron readily accepts electrons from the carbon framework, leading to a shift in Fermi level and an increase in electrical conductivity. In addition, boron dopants typically introduce vacancy defects into adjacent locations thus providing additional conductivity.120 However, to the best of our knowledge limited research has been conducted on boron doped-biomass derived HC for sodium-ion storage.
Sulphur, fluorine and phosphorus are all interstitial doping elements due to atomic size difference. The presence of these doping elements distorts the carbon matrix and increases the d-spacing of graphitic domains. A computational study showed single-atom doping of fluorine136 and phosphorus143 into pseudo-graphitic layers increased the interlayer distance by 0.3 and 0.4 Å, respectively. Experimentally, using phosphorus doping to increase the interlayer spacing from 3.79 to 3.86 Å led to reversible capacity enhancement from 283 to 359 mA h g−1 at 20 mA g−1.144 Nevertheless, much like intrinsic defects, the stronger binding presence of particular heteroatom defects have been associated with sodium-ion trapping and contribute to low reversible sodium-ion capacity.30,137
5.2. Open porosity-performance relationship
The open pores in HC can influence sodium-ion charge storage capacity and diffusion kinetics.38,145,146 Because open pores are accessible to most inert gases via physical adsorption, as well as electrolyte, the external specific surface area of HC reflects its open porosity. For example, Ding et al.48 used the air activation method to control the open porosity and external specific surface area of peat moss derived HC. It was found that the open pore volume of HC samples carbonised at 900 °C with and without air activation was 0.059 to 0.21 cm3 g−1, respectively. Moreover, the specific surface area also increased from 45.1 to 271.2 m2 g−1. Therefore, larger open pore volume results in greater specific surface area of HC. In addition, the size or diameter of open pores within HC also effects the specific surface area. HC with larger volume of micropores, (<2 nm in diameter) has a larger surface area than HC with the same total open pore volume but mesoporous in size (>2 nm).145 Therefore, much of the external surface area is attributed to the open porosity of HC, and should be used interchangeably. Also, because the defects discussed in Section 5.1 are located on the surface, the more porous a HC material is, the larger it's specific surface area and subsequently number of defects will be. These are all important considerations when analysing the electrochemical properties of HC. As for the observed electrochemical performance of the air-activated and non-activated samples, Ding et al.48 reported at a current density of 50 mA g−1, the sodium-ion storage capacities at the tenth cycle was 150 and 100 mA h g−1, respectively. The increased capacity for the activated sample was also associated with the sloping region of the GCD profile due to related surface adsorption storage mechanism. This suggests that the open pores/specific surface area combine to contribute towards capacitive-like sodium-ion storage. Also, because the IG/ID ratio was similar for both samples, the greater capacity is attributed to the greater open porosity and external surface area.One issue with large open pore volume and high specific surface area of HC materials is their low initial coulombic efficiency (ICE),30,147,148 which in part is due to the formation of SEI and trapping of sodium-ions at defective sites. The formation of the SEI layer occurs at the electrode surface and is due to the decomposition of electrolyte during cycling at voltages outside the electrochemical stability window of the electrolyte.30 Through elemental analysis using the XPS technique, Na2CO3 and NaF were observed in the SEI layer.149 This confirms that sodium-ions are consumed during the formation of the SEI layer.149–151 In a full cell device, sodium-ions are supplied by the cathode, therefore, any loss of active sodium-ions would decrease the capacity of the device.129 By reducing the surface area of a sorghum stalk waste-derived HC from 234.5 to 35.55 m2 g−1 The ICE was increased from 57.5% to 62.2%. According to Luo et al.,150 lowering the specific surface area of HC is a common strategy for improving the ICE of HC anodes,152 but it is generally associated with a reduction in rate performance.153
In addition, Olsson et al.154 experimentally and theoretically investigated the effect of surface defects and their location on the formation of the SEI layer. They found that oxygen functionalities on the basal defects led to the formation of inorganic SEI compounds and immobilisation of sodium-ions. In comparison, oxygen functionalities on the edge defects were identified as energetically favourable sites towards reversible storage of sodium ions. Therefore, any undesirable consumption of sodium-ions during the formation of the SEI layer will reduce the reversible capacity of the electrode.
Another approach to improve reversible capacity is to modify HC by adding an artificial SEI layer on electrode surface, which is usually carbon based. Carbon coating can be achieved using various methods.155 Zhang et al.128 prepared carbon-coated HC spheres via mixing of polypropylene with glucose before pyrolysis. The thickness of the coated carbon layer can be controlled by adjusting experimental parameters, such as deposition time, gaseous flow rate and concentration of coating agent. Adding an additive to the electrolyte is another efficient approach to enhance reversible capacity. Fluoroethylene carbonate (FEC) is a commonly used additive, which changes the composition of the SEI layer. Fondard et al.151 added 3 wt% FEC to a 1 M sodium hexafluorophosphate (NaPF6)/ethyl carbonate:dimethyl carbonate (EC![[thin space (1/6-em)]](https://www.rsc.org/images/entities/char_2009.gif) :
:![[thin space (1/6-em)]](https://www.rsc.org/images/entities/char_2009.gif) DMC in 1
DMC in 1![[thin space (1/6-em)]](https://www.rsc.org/images/entities/char_2009.gif) :
:![[thin space (1/6-em)]](https://www.rsc.org/images/entities/char_2009.gif) 1) electrolyte and observed significantly more NaF formation and a decrease in Na2CO3 compared to electrolyte without FEC.151 Therefore, many factors in addition to the electrode material itself are important to consider when improving the electrochemical performance of HC materials.
1) electrolyte and observed significantly more NaF formation and a decrease in Na2CO3 compared to electrolyte without FEC.151 Therefore, many factors in addition to the electrode material itself are important to consider when improving the electrochemical performance of HC materials.
5.3. Closed porosity-performance relationship
The performance contribution of closed pores in HC materials towards sodium-ion storage has gained a great deal of interest.39,100,112,128 This is driven by the observed direct relationship between closed pore volume and sodium-ion storage performance. Li et al.,38 quantified the closed pore volume of cork-waste derived HC samples pyrolysed at different temperatures in the range between 800 and 1600 °C. The sample pyrolysed at 1600 °C exhibited the highest closed pore volume (0.29 cm3 g−1) and largest specific capacity contribution below 0.1 V and above the cut-off voltage (231 mA h g−1). For comparison, the sample pyrolysed at 1400 °C with the second highest closed pore volume of 0.19 cm3 g−1 achieved a specific capacity contribution of 189 mA h g−1 in the same potential window. Lee et al.,39 reported that the bulk densities of coffee waste derived HC samples carbonised at 1600, 2000, 2400 and 2800 °C were 1.56, 1.38, 1.42 and 1.45 g cm−3, respectively. According to the authors, the variation in bulk density of the HC samples allowed for quantifiable evidence for the increase in closed pore volume. The authors observed that the second cycle discharge capacity in the plateau region of the sample carbonised at 2000 °C with the lowest bulk density was approximately 235 mA h g−1, which is over two times higher than that of the sample carbonised at 1600 °C (100 mA h g−1). Moreover, the sample carbonised at 2000 °C displayed the higher ICE of 90.4%. Therefore, the authors concluded that a lower bulk density, suggestive of greater closed pore volume, of HC is favourable for sodium-ion storage in the low-voltage plateau region.39 Zhang et al.128 used an open pore closing strategy by depositing polypropylene on the surface of glucose derived HC. With this strategy, the authors were able to alter the true density, and the closed porosity of HC. The sample with the lowest true density (1.8 g cm−3) exhibited the highest plateau capacity of 220 mA h g−1. For comparison, other samples with true densities of 2.01, 2.02 and 2.33 displayed plateau capacities of 185, 160 and 165 mA h g−1, respectively.128 The authors concluded that the plateau capacity is crucial to achieving high energy density of HC-based NIB cells. Therefore, closed pore and performance relationship deserves extensive research efforts.58In regard to sodium-ion storage mechanism in closed pores, it is believed that sodium ions diffuse through the spaces of parallelly and near-parallelly stacked graphitic domains.39 During this process, the sodium ion becomes de-solvated at the HC electrode/electrolyte interface.150,156 As a result, electrolyte decomposition is minimised, this significantly improving sodium-ion reversibility and coulombic efficiency. Kano et al.157 prepared HC materials with different closed pore volumes and observed a linear relationship between closed pore volume and reversible capacity (Fig. 24a). The GCD discharge profile shown in Fig. 24b represents an optimised HC sample with high volume of closed pores, and a highly reversible extended plateau capacity. Therefore, the storage of sodium-ions in closed pores appears to result in highly reversible capacity and cycling capabilities. It can be concluded that increasing closed pore volume increases reversible sodium ion storage capacity, thus enhancing NIB cell performance.
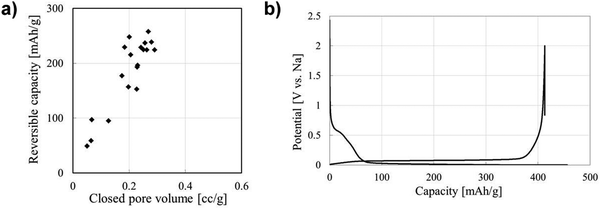 | ||
| Fig. 24 (a) Correlation between closed pore volume and reversible capacity of sucrose derived HC. (b) GCD profile for sucrose derived HC.157 Copyright 2015, IOPscience. | ||
5.4. Graphitic domains-performance relationship
As discussed in Section 4.3, the graphitic domains of HC prepared at low pyrolysis temperatures (generally below 1200 °C) are typically smaller in size (Lc and La) with a larger d-spacing. Increasing the pyrolysis temperature (>1200 °C) results in a graphitic domain growth and a reduction in the d-spacing.84 Moreover, the various graphitic domain assemblies within HC materials alter the associated sodium-ion storage performance. For this reason, it is critical to understand the role of the graphitic domains, including d-spacing and crystallite size on the sodium-ion storage performance.Firstly, theoretical studies have shown that d-spacing becomes energetically favourable towards sodium-ion intercalation when greater than 0.37 nm.49,158 Below 0.37 nm, the energy barrier for sodium-ion intercalation becomes significantly large to overcome, as evidenced from the limited sodium-ion storage capacity of graphite which has a d-spacing of 0.335 nm. Experimentally, Sun et al.107 observed a decrease in d-spacing from 0.385 to 0.337 nm, as well as a drop in plateau capacity from 192.5 mA h g−1 to 115.2 mA h g−1, when the pyrolysis temperature was increased from 1300 to 1500 °C for Ginko leaf derived HC. Furthermore, the theoretical energy cost of sodium-ion inserted between two graphene layers drops to 0 eV when the d-spacing becomes 0.4 nm or larger.159 According to Sun et al.107 this implies the larger d-spacing of 0.4 nm or more results in surface-like pseudo-adsorption of sodium-ion, and not intercalation. Which as mentioned previously is not ideal due to the increased unwanted side reactions between electrolyte and electrode surface. In addition, the rate of sodium-ion diffusion between the parallel graphene layers in graphitic domains is dependent on the d-spacing.158 Computational calculations showed that the energy migration barrier for sodium ions decrease linearly as a function of d-spacing between 0.35 and 0.50 nm.158 This was also experimentally confirmed.107,158 Therefore, the interlayer spacing between graphene planes should be larger than 0.37 nm, but less than 0.4 nm to ensure adequate intercalation and diffusion of sodium-ions within the graphitic domains of HC.
Secondly, satisfactory formation of the graphitic crystallites must be achieved to provide sufficient levels of sodium-ion intercalation storage sites. Depending on the precursor and preparation conditions, HC can have various degrees of crystallographic ordering of the Lc and La dimensions. Generally, the graphitic crystallites of HC vary from highly disordered at low pyrolysis temperatures, to pseudo-graphitic at intermediate pyrolysis temperatures, and graphite-like at high temperatures (Fig. 25).107 HC with a large quantity of highly disordered carbon domains lacks of Lc and La ordering. This results in randomly orientated disordered graphene planes with enlarged d-spacings greater than 0.4 nm.107 As mentioned, a d-spacing larger than 0.4 nm is not suitable for sodium-ion intercalation and results in reduced diffusion-like sodium-ion storage. As pyrolysis temperature was increased, the HC microstructure rearranged, forming pseudo-graphitic domains with reduced d-spacing typically between 0.36–0.40 nm.107 This d-spacing range is large enough for favourable sodium-ion insertion, whilst being narrow enough to reduce unwanted sodium-ion surface adsorption contributions. This is evidenced by the transition from pseudo-capacitive to diffusion-like storage behaviour observed from the cyclic voltammograms (CV) (Fig. 26) and GCD curves (Fig. 27) for HC when treated at intermediate pyrolysis temperatures between 1000 and 1700 °C. In addition, the change to more pseudo-graphitic domains corresponds to an increase in reversibility of sodium-ion storage. For example, the reversible capacity of a HC samples pyrolysed at 600 and 1300 °C were approximately 200 mA h g−1 and 400 mA h g−1, respectively.107
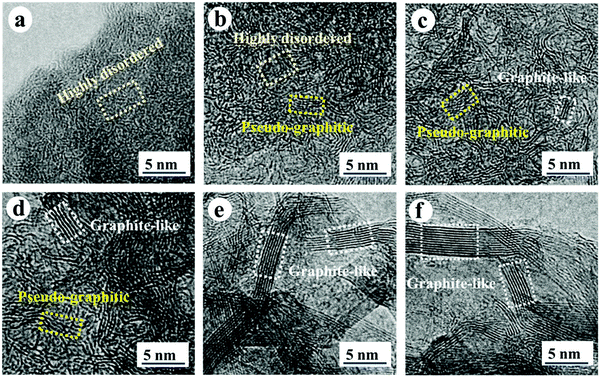 | ||
| Fig. 25 High resolution transmission electron microscopy (HRTEM) images of HC samples pyrolysed at (a) 600, (b) 1000, (c) 1300, (d) 1700, (e) 2000 and (f) 2500 °C.107 Copyright 2019, Wiley. | ||
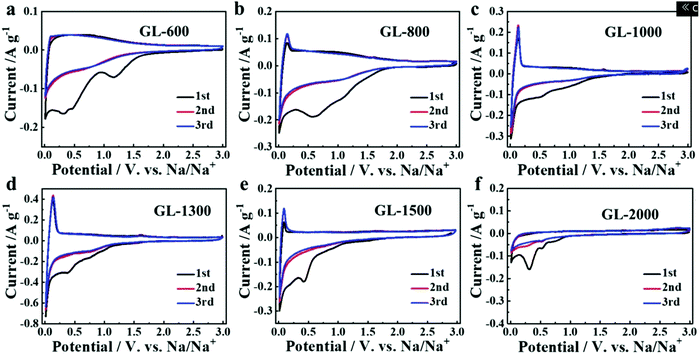 | ||
| Fig. 26 CVs of HC samples pyrolysed at (a) 600, (b) 800, (c) 1000, (d) 1300, (e) 1500 and (f) 2000 °C.107 Copyright 2019, Wiley. | ||
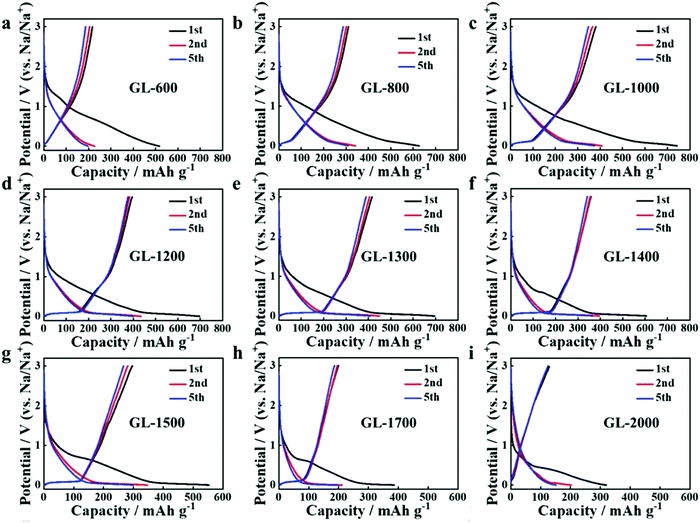 | ||
| Fig. 27 GCD profiles of HC samples pyrolysed at (a) 600, (b) 800, (c) 1000, (d) 1200, (e) 1300 and (f) 1400 °C, (g) 1500, (h) 1700 and (i) 2000 °C.107 Copyright 2019, Wiley. | ||
At very high pyrolysis temperatures, typically above 2000 °C, HC materials have a high degree of structural ordering due to the formation of graphite-like domains. In this circumstance, the d-spacing becomes very narrow, thus unfavourable for sodium-ion intercalation. The ability of the HC materials to retain capacity at high current densities suggests sodium-ion storage is dominated by the surface adsorption mechanism.107 Therefore, HC with a high concentration of pseudo-graphitic domains with d-spacing between approximately 0.37 and 0.40 nm is considered optimal for reversible sodium-ion storage, with the upper limit being more favourable towards sodium-ion kinetics.
6. Conclusion and perspectives
Firstly, it is important to address resource sustainability in developing rechargeable batteries. Biomass-derived hard carbon, in particular the biomass precursor is obtained from naturally abundant non-competing sources, is a sustainable electrode material for energy storage.Secondly, a complete understanding of the sodium-ion storage mechanism is required to direct the tailoring and tuning of biomass-derived hard carbon anode materials for sodium-ion storage. There is still under intense debate regarding sodium-ion storage mechanisms in hard carbon. Because low-voltage plateau capacity with high reversibility and stability against cycling is most desirable for improving cell performance, it is important to validate the exact sodium ion storage mechanism in this plateau region. Fundamental studies using in situ physical and electrochemical characterisation techniques combined with computational means to elucidate sodium-ion storage mechanisms in hard carbon are needed to boost the sodium-ion-based energy storage technology.
Thirdly, and very much linked to the first point, the complicate physical and chemical properties of hard carbon materials derived from different biomass precursors and prepared using various methods under different conditions have resulted in difficulty in assessing the role of key parameters of the hard carbon in sodium ion storage, such as d-spacing and close pore volume. The importance of accurately quantifying the d-spacing of the graphitic microcrystallites is evident. By doing this, a greater understanding of the sodium-ion storage capacity and diffusion will assist in progressing this field. Pair distribution function is an innovative characterisation technique which could assist in providing reliable interpretation of the microstructural traits of biomass-derived hard carbon. Measurement of true density using the helium pycnometer method provides additional means to characterise closed pores.
Fourthly, the low initial coulombic efficiency typically observed from biomass-derived hard carbon anode materials is a critical issue that needs to be addressed. Side reactions occurring between electrolyte and hard carbon electrode surface, as well as trapping of sodium ions at defective sites are the main contributing factors associated with the low initial coulombic efficiency. To combat the performance-inhibiting factors attributed to low initial coulombic efficiency, innovative synthesis and advanced engineering techniques need to be further explored and developed. In addition, surface engineering such as coating of biomass-derived hard carbon has also shown promising results concerning increasing the reversible capacity. In addition to the development of advanced biomass-derived hard carbon anode materials, the electrolyte including the salts, solvents and additives deserves extensive research efforts in future development.
Achieving a greater understanding of points 1–3 above should then provide a roadmap for further preparation methods aimed to enhance the electrochemical performance of hard carbon materials. Experimenting with pre- and post-carbonisation techniques, in addition to carbonisation temperature, time and heating rates of various biomass precursors with the desired microstructural characteristics in mind, should provide hard carbon materials with enhanced electrochemical results.
As a final statement, it is worth mentioning that addressing the above recommendations will improve the electrochemical performance of hard carbon. However, for practical applications, each component of a battery cell, such as the cathode, the electrolyte, the separator and the current collector, must be optimised.
Conflicts of interest
The authors declare no conflict of interest.Acknowledgements
Professor X. S. Zhao is the recipient of an Australian Research Council Australian Laureate Fellowship (project number FL170100101) funded by the Australian Government. This research was partially funded by the Australian Government through the Australian Research Council (project number DP200102573).Notes and references
- G. Blanco, R. Gerlagh, S. Suh, A. Ahenkorah, J. Barrett, H. De Coninck, M. Diaz, R. Mathur, N. Nakicenovic, J. Pan, H. Pathak, J. Rice, R. Richels, S. Smith, D. Stern, F. Toth, P. Shou, M. Gomes and A. Verbruggen, Climate Change 2014 Mitigation of Climate Change - Chapter 4, 2014.
- United Nations, About the Sustainable Development Goals, https://www.un.org/sustainabledevelopment/sustainable-development-goals/, accessed 6 September 2020.
- J. Hewson, W. Steffen, L. Hughes and M. Meinshausen, AUSTRALIA’S PARIS AGREEMENT PATHWAYS: UPDATING THE CLIMATE CHANGE AUTHORITY’S 2014 EMISSIONS REDUCTION TARGETS, 2021 Search PubMed.
- T. Perveen, M. Siddiq, N. Shahzad, R. Ihsan, A. Ahmad and M. I. Shahzad, Renewable Sustainable Energy Rev., 2020, 119, 109549 CrossRef CAS.
- A. Ponrouch and M. R. Palacín, Philos. Trans. R. Soc., A, 2019, 377, 20180297 CrossRef CAS PubMed.
- A. Valero, A. Valero, G. Calvo and A. Ortego, Renewable Sustainable Energy Rev., 2018, 93, 178–200 CrossRef.
- K. Turcheniuk, D. Bondarev, V. Singhal and G. Yushin, Nature, 2018, 559, 467–470 CrossRef CAS PubMed.
- A. Noori, M. F. El-Kady, M. S. Rahmanifar, R. B. Kaner and M. F. Mousavi, Chem. Soc. Rev., 2019, 48, 1272–1341 RSC.
- T. A. Faunce, J. Prest, D. Su, S. J. Hearne and F. Iacopi, MRS Energy Sustainable, 2018, 5, 10 CrossRef.
- T. B. Lee, The story of cheaper batteries, from smartphones to Teslas, https://arstechnica.com/tech-policy/2020/09/the-story-of-cheaper-batteries-from-smartphones-to-teslas/.
- P. K. Nayak, L. Yang, W. Brehm and P. Adelhelm, Angew. Chem., Int. Ed., 2018, 57, 102–120 CrossRef CAS PubMed.
- M.-S. Balogun, Y. Luo, W. Qiu, P. Liu and Y. Tong, Carbon, 2016, 98, 162–178 CrossRef CAS.
- C. Vaalma, D. Buchholz, M. Weil and S. Passerini, Nat. Rev. Mater., 2018, 3, 1–11 CrossRef.
- A. Ponrouch, R. Dedryvère, D. Monti, A. E. Demet, J. M. Ateba Mba, L. Croguennec, C. Masquelier, P. Johansson and M. R. Palacín, Energy Environ. Sci., 2013, 6, 2361–2369 RSC.
- H. Pan, Y.-S. Hu and L. Chen, Energy Environ. Sci., 2013, 6, 2338–2360 RSC.
- M. Okoshi, Y. Yamada, A. Yamada and H. Nakai, J. Electrochem. Soc., 2013, 160, 2160–2165 CrossRef.
- Y.-S. Hu and Y. Lu, ACS Energy Lett., 2019, 4, 2689–2690 CrossRef CAS.
- E. De La Llave, V. Borgel, E. Zinigrad, F. F. Chesneau, P. Hartmann, Y. K. Sun and D. Aurbach, Isr. J. Chem., 2015, 55, 1260–1274 CrossRef CAS.
- B. Xiao, T. Rojo and X. Li, ChemSusChem, 2019, 12, 133–144 CrossRef CAS PubMed.
- A. Ponrouch, D. Monti, A. Boschin, B. Steen, P. Johansson and M. R. Palacín, J. Mater. Chem. A, 2015, 3, 22–42 RSC.
- E. Irisarri, A. Ponrouch and M. R. Palacin, J. Electrochem. Soc., 2015, 162, 2476–2482 CrossRef.
- S. Alvin, H. S. Cahyadi, J. Hwang, W. Chang, S. K. Kwak and J. Kim, Adv. Energy Mater., 2020, 10, 2000283 CrossRef CAS.
- Z. Xu, J. Park, G. Yoon, H. Kim and K. Kang, Small Methods, 2019, 3, 1800323 CrossRef.
- Z. Wang, S. M. Selbach and T. Grande, RSC Adv., 2014, 4, 4069–4079 CAS.
- R. M. N. M. Rathnayake, T. T. Duignan, D. J. Searles and X. S. Zhao, Phys. Chem. Chem. Phys., 2021, 23, 3063–3070 RSC.
- B. Jache and P. Adelhelm, Angew. Chem., Int. Ed., 2014, 53, 10169–10173 CrossRef CAS PubMed.
- M. Wahid, D. Puthusseri, Y. Gawli, N. Sharma and S. Ogale, ChemSusChem, 2018, 11, 506–526 CrossRef CAS PubMed.
- W. Wang, W. Li, S. Wang, Z. Miao, H. K. Liu and S. Chou, J. Mater. Chem. A, 2018, 6, 6183–6205 RSC.
- N. Yabuuchi, K. Kubota, M. Dahbi and S. Komaba, Chem. Rev., 2014, 114, 11636–11682 CrossRef CAS PubMed.
- H. He, D. Sun, Y. Tang, H. Wang and M. Shao, Energy Storage Mater., 2019, 23, 233–251 CrossRef.
- T. Chen, Y. Jin, H. Lv, A. Yang, M. Liu, B. Chen, Y. Xie and Q. Chen, Trans. Tianjin Univ., 2020, 26, 208–217 CrossRef.
- L. Xiao, H. Lu, Y. Fang, M. L. Sushko, Y. Cao, X. Ai, H. Yang and J. Liu, Adv. Energy Mater., 2018, 8, 1703238 CrossRef.
- X. Yao, Y. Ke, W. Ren, X. Wang, F. Xiong, W. Yang, M. Qin, Q. Li and L. Mai, Adv. Energy Mater., 2019, 9, 1803260 CrossRef.
- Y. Nishi, Chem. Rec., 2001, 1, 406–413 CrossRef CAS PubMed.
- F. Xie, Z. Xu, Z. Guo and M.-M. Titirici, Prog. Energy, 2020, 2, 042002 CrossRef.
- D. Saurel, B. Orayech, B. Xiao, D. Carriazo, X. Li and T. Rojo, Adv. Energy Mater., 2018, 8, 1703268 CrossRef.
- Z. Gao, Y. Zhang, N. Song and X. Li, Mater. Res. Lett., 2017, 5, 69–88 CrossRef CAS.
- Y. Li, Y. Lu, Q. Meng, A. C. S. Jensen, Q. Zhang, Q. Zhang, Y. Tong, Y. Qi, L. Gu, M. Titirici and Y. Hu, Adv. Energy Mater., 2019, 9, 1902852 CrossRef CAS.
- M. E. Lee, H. W. Kwak, H. J. Jin and Y. S. Yun, ACS Sustainable Chem. Eng., 2019, 7, 12734–12740 CrossRef CAS.
- J. S. McDonald-Wharry, M. Manley-Harris and K. L. Pickering, Energy Fuels, 2016, 30, 7811–7826 CrossRef CAS.
- B. Zhang, C. M. Ghimbeu, C. Laberty, C. Vix-Guterl and J.-M. Tarascon, Adv. Energy Mater., 2016, 6, 1501588 CrossRef.
- D. A. Stevens and J. R. Dahn, J. Electrochem. Soc., 2000, 147, 1271–1273 CrossRef CAS.
- D. A. Stevens and J. R. Dahn, J. Electrochem. Soc., 2000, 147, 4428–4431 CrossRef CAS.
- C. Chan, W. Kamitakahara and K. Ho, Synth. Met., 1988, 23, 327–332 CrossRef CAS.
- C. T. Chan, K. M. Ho and W. A. Kamitakahara, Phys. Rev. B: Condens. Matter Mater. Phys., 1987, 36, 3499–3502 CrossRef CAS PubMed.
- J. S. Weaving, A. Lim, J. Millichamp, T. P. Neville, D. Ledwoch, E. Kendrick, P. F. McMillan, P. R. Shearing, C. A. Howard and D. J. L. Brett, ACS Appl. Energy Mater., 2020, 3, 7474–7484 CrossRef CAS.
- T. Lyu, X. Lan, L. Liang, X. Lin, C. Hao, Z. Pan, Z. Q. Tian and P. K. Shen, Electrochim. Acta, 2021, 365, 137356 CrossRef CAS.
- J. Ding, H. Wang, Z. Li, A. Kohandehghan, K. Cui, Z. Xu, B. Zahiri, X. Tan, E. M. Lotfabad, B. C. Olsen and D. Mitlin, ACS Nano, 2013, 7, 11004–11015 CrossRef CAS PubMed.
- Y. Cao, L. Xiao, M. L. Sushko, W. Wang, B. Schwenzer, J. Xiao, Z. Nie, L. V. Saraf, Z. Yang and J. Liu, Nano Lett., 2012, 12, 3783–3787 CrossRef CAS PubMed.
- C. Matei Ghimbeu, J. Górka, V. Simone, L. Simonin, S. Martinet and C. Vix-Guterl, Nano Energy, 2018, 44, 327–335 CrossRef CAS.
- Y. Li, Y.-S. Hu, M.-M. Titirici, L. Chen and X. Huang, Adv. Energy Mater., 2016, 6, 1600659 CrossRef.
- P. Bai, Y. He, X. Zou, X. Zhao, P. Xiong and Y. Xu, Adv. Energy Mater., 2018, 8, 1703217 CrossRef.
- K. Gotoh, T. Ishikawa, S. Shimadzu, N. Yabuuchi, S. Komaba, K. Takeda, A. Goto, K. Deguchi, S. Ohki, K. Hashi, T. Shimizu and H. Ishida, J. Power Sources, 2013, 225, 137–140 CrossRef CAS.
- Y. Jin, S. Sun, M. Ou, Y. Liu, C. Fan, X. Sun, J. Peng, Y. Li, Y. Qiu, P. Wei, Z. Deng, Y. Xu, J. Han and Y. Huang, ACS Appl. Energy Mater., 2018, 1, 2295–2305 CrossRef CAS.
- H. Au, H. Alptekin, A. C. S. Jensen, E. Olsson, C. A. O’Keefe, T. Smith, M. Crespo-Ribadeneyra, T. F. Headen, C. P. Grey, Q. Cai, A. J. Drew and M.-M. Titirici, Energy Environ. Sci., 2020, 13, 3469–3479 RSC.
- C. Bommier, T. W. Surta, M. Dolgos and X. Ji, Nano Lett., 2015, 15, 5888–5892 CrossRef CAS PubMed.
- R. Alcántara, P. Lavela, G. F. Ortiz and J. L. Tirado, Electrochem. Solid-State Lett., 2005, 8, 222–225 CrossRef.
- N. Zhang, Q. Liu, W. Chen, M. Wan, X. Li, L. Wang, L. Xue and W. Zhang, J. Power Sources, 2018, 378, 331–337 CrossRef CAS.
- X. Dou, I. Hasa, M. Hekmatfar, T. Diemant, R. J. Behm, D. Buchholz and S. Passerini, ChemSusChem, 2017, 10, 2668–2676 CrossRef CAS PubMed.
- J. Ding, H. Wang, Z. Li, K. Cui, D. Karpuzov, X. Tan, A. Kohandehghan and D. Mitlin, Energy Environ. Sci., 2015, 8, 941–955 RSC.
- H. Zhu, F. Shen, W. Luo, S. Zhu, M. Zhao, B. Natarajan, J. Dai, L. Zhou, X. Ji, R. S. Yassar, T. Li and L. Hu, Nano Energy, 2017, 33, 37–44 CrossRef CAS.
- H. Zhang, W. Zhang, H. Ming, J. Pang, H. Zhang, G. Cao and Y. Yang, Chem. Eng. J., 2018, 341, 280–288 CrossRef CAS.
- T. Liu and X. Li, Mater. Technol., 2019, 34, 232–245 CrossRef CAS.
- Z. Schnepp, Angew. Chem., Int. Ed., 2013, 52, 1096–1108 CrossRef CAS PubMed.
- N. Sun, H. Liu and B. Xu, J. Mater. Chem. A, 2015, 3, 20560–20566 RSC.
- J. Górka, C. Vix-Guterl and C. Matei Ghimbeu, C, 2016, 2, 24 Search PubMed.
- J. Zhu, J. Roscow, S. Chandrasekaran, L. Deng, P. Zhang, T. He, K. Wang and L. Huang, ChemSusChem, 2020, 13, 1275–1295 CrossRef CAS PubMed.
- K. Yu, H. Zhao, X. Wang, M. Zhang, R. Dong, Y. Li, Y. Bai, H. Xu and C. Wu, ACS Appl. Mater. Interfaces, 2020, 12, 10544–10553 CrossRef CAS PubMed.
- H. Liu, X. Liu, H. Wang, Y. Zheng, H. Zhang, J. Shi, W. Liu, M. Huang, J. Kan, X. Zhao and D. Li, ACS Sustainable Chem. Eng., 2019, 7, 12188–12199 CAS.
- X. Ren, S.-D. Xu, S. Liu, L. Chen, D. Zhang and L. Qiu, J. Electroanal. Chem., 2019, 841, 63–72 CrossRef CAS.
- Y. Li, S. Xu, X. Wu, J. Yu, Y. Wang, Y.-S. Hu, H. Li, L. Chen and X. Huang, J. Mater. Chem. A, 2015, 3, 71–77 RSC.
- Y. Guo, W. Liu, R. Wu, L. Sun, Y. Zhang, Y. Cui, S. Liu, H. Wang and B. Shan, ACS Appl. Mater. Interfaces, 2018, 10, 38376–38386 CrossRef CAS PubMed.
- A. A. Arie, B. Tekin, E. Demir and R. Demir-Cakan, Waste Biomass Valorization, 2020, 11, 3121–3131 CrossRef CAS.
- R. R. Gaddam, E. Jiang, N. Amiralian, P. K. Annamalai, D. J. Martin, N. A. Kumar and X. S. Zhao, Sustainable Energy Fuels, 2017, 1, 1090–1097 RSC.
- Y. Sun and J. Cheng, Bioresour. Technol., 2002, 83, 1–11 CrossRef CAS PubMed.
- A. Nawirska and M. Kwaśniewska, Food Chem., 2005, 91, 221–225 CrossRef CAS.
- T. Happi Emaga, C. Robert, S. N. Ronkart, B. Wathelet and M. Paquot, Bioresour. Technol., 2008, 99, 4346–4354 CrossRef CAS PubMed.
- H. Chen, Biotechnology of Lignocellulose, Springer, Netherlands, Dordrecht, 2014, pp. 25–71 Search PubMed.
- Y. Feng, L. Tao, Y. He, Q. Jin, C. Kuai, Y. Zheng, M. Li, Q. Hou, Z. Zheng, F. Lin and H. Huang, J. Mater. Chem. A, 2019, 7, 26954–26965 RSC.
- L. J. Gibson, J. R. Soc., Interface, 2012, 9, 2749–2766 CrossRef CAS PubMed.
- V. Chitra Devi, S. Mothil, R. Sathish Raam and K. Senthilkumar, 2020, pp. 45–63.
- R. Guo, C. Lv, W. Xu, J. Sun, Y. Zhu, X. Yang, J. Li, J. Sun, L. Zhang and D. Yang, Adv. Energy Mater., 2020, 10, 1903652 CrossRef CAS.
- Z. Li, C. Bommier, Z. Sen Chong, Z. Jian, T. W. Surta, X. Wang, Z. Xing, J. C. Neuefeind, W. F. Stickle, M. Dolgos, P. A. Greaney and X. Ji, Adv. Energy Mater., 2017, 7, 1602894 CrossRef.
- K. Kubota, S. Shimadzu, N. Yabuuchi, S. Tominaka, S. Shiraishi, M. Abreu-Sepulveda, A. Manivannan, K. Gotoh, M. Fukunishi, M. Dahbi and S. Komaba, Chem. Mater., 2020, 32, 2961–2977 CrossRef CAS.
- Y. Queneau, S. Jarosz, B. Lewandowski and J. Fitremann, Adv. Carbohydr. Chem. Biochem., 2007, 217–292 CrossRef CAS.
- X. Dou, I. Hasa, D. Saurel, C. Vaalma, L. Wu, D. Buchholz, D. Bresser, S. Komaba and S. Passerini, Mater. Today, 2019, 23, 87–104 CrossRef CAS.
- A. Demirbaş, Energy Explor. Exploit., 2004, 22, 411–419 CrossRef.
- M.-M. Titirici and M. Antonietti, Chem. Soc. Rev., 2010, 39, 103–116 RSC.
- H. Marsh and F. Rodríguez-Reinoso, Activated Carbon, Elsevier, 2006 Search PubMed.
- D. Saurel, J. Segalini, M. Jauregui, A. Pendashteh, B. Daffos, P. Simon and M. Casas-Cabanas, Energy Storage Mater., 2019, 21, 162–173 CrossRef.
- P. Ouzilleau, A. E. Gheribi, P. Chartrand, G. Soucy and M. Monthioux, Carbon, 2019, 149, 419–435 CrossRef CAS.
- B. Hu, K. Wang, L. Wu, S.-H. Yu, M. Antonietti and M.-M. Titirici, Adv. Mater., 2010, 22, 813–828 CrossRef CAS PubMed.
- X. Liu, C. Yu, H. Hou, Z. Xu, K. Meng, J. Zhu and L. Wang, Environ. Sci. Pollut. Res., 2020, 27, 13467–13476 CrossRef CAS PubMed.
- R. V. P. Antero, A. C. F. Alves, S. B. de Oliveira, S. A. Ojala and S. S. Brum, J. Clean. Prod., 2020, 252, 119899 CrossRef CAS.
- T. Liu, L. Zhang, B. Cheng and J. Yu, Adv. Energy Mater., 2019, 9, 1803900 CrossRef.
- X. Sun and Y. Li, Angew. Chem., Int. Ed., 2004, 43, 597–601 CrossRef PubMed.
- X. Cui, M. Antonietti and S.-H. Yu, Small, 2006, 2, 756–759 CrossRef CAS PubMed.
- Y. Mao, H. Duan, B. Xu, L. Zhang, Y. Hu, C. Zhao, Z. Wang, L. Chen and Y. Yang, Energy Environ. Sci., 2012, 5, 7950–7955 RSC.
- W. Chen, M. Wan, Q. Liu, X. Xiong, F. Yu and Y. Huang, Small Methods, 2019, 3, 1800323 CrossRef CAS.
- Q. Meng, Y. Lu, F. Ding, Q. Zhang, L. Chen and Y.-S. Hu, ACS Energy Lett., 2019, 4, 2608–2612 CrossRef CAS.
- Y. Mao, H. Duan, B. Xu, L. Zhang, Y. Hu, C. Zhao, Z. Wang, L. Chen and Y. Yang, Energy Environ. Sci., 2012, 5, 7950–7955 RSC.
- Y. Li, M. Chen, B. Liu, Y. Zhang, X. Liang and X. Xia, Adv. Energy Mater., 2020, 10, 2000927 CrossRef CAS.
- C. Chen, Y. Huang, Y. Zhu, Z. Zhang, Z. Guang, Z. Meng and P. Liu, ACS Sustainable Chem. Eng., 2020, 8, 1497–1506 CrossRef CAS.
- K. Wang, Y. Xu, Y. Li, V. Dravid, J. Wu and Y. Huang, J. Mater. Chem. A, 2019, 7, 3327–3335 RSC.
- H. Miao, S. Li, Z. Wang, S. Sun, M. Kuang, Z. Liu and J. Yuan, Int. J. Hydrogen Energy, 2017, 42, 28298–28308 CrossRef CAS.
- A. Gomez-Martin, J. Martinez-Fernandez, M. Ruttert, M. Winter, T. Placke and J. Ramirez-Rico, Chem. Mater., 2019, 31, 7288–7299 CrossRef CAS.
- N. Sun, Z. Guan, Y. Liu, Y. Cao, Q. Zhu, H. Liu, Z. Wang, P. Zhang and B. Xu, Adv. Energy Mater., 2019, 9, 1901352 CrossRef.
- E. M. Lotfabad, J. Ding, K. Cui, A. Kohandehghan, W. P. Kalisvaart, M. Hazelton and D. Mitlin, ACS Nano, 2014, 8, 7115–7129 CrossRef CAS PubMed.
- V. Simone, A. Boulineau, A. de Geyer, D. Rouchon, L. Simonin and S. Martinet, J. Energy Chem., 2016, 25, 761–768 CrossRef.
- D. Sun, B. Luo, H. Wang, Y. Tang, X. Ji and L. Wang, Nano Energy, 2019, 64, 103937 CrossRef CAS.
- A. Kano, N. Hojo and M. Fujimoto, 228th ECS Meeting, 2014, 1–15 Search PubMed.
- Y. Morikawa, S. Nishimura, R. Hashimoto, M. Ohnuma and A. Yamada, Adv. Energy Mater., 2020, 10, 1903176 CrossRef CAS.
- X. Zhang, X. Dong, X. Qiu, Y. Cao, C. Wang, Y. Wang and Y. Xia, J. Power Sources, 2020, 476, 228550 CrossRef CAS.
- S. Alvin, D. Yoon, C. Chandra, H. S. Cahyadi, J.-H. Park, W. Chang, K. Y. Chung and J. Kim, Carbon, 2019, 145, 67–81 CrossRef CAS.
- R. E. Franklin, Philos. Trans. R. Soc., A, 1951, 209, 196–218 CAS.
- M. Dahbi, M. Kiso, K. Kubota, T. Horiba, T. Chafik, K. Hida, T. Matsuyama and S. Komaba, J. Mater. Chem. A, 2017, 5, 9917–9928 RSC.
- J. Choi, M. E. Lee, S. Lee, H.-J. Jin and Y. S. Yun, ACS Appl. Energy Mater., 2019, 2, 1185–1191 CrossRef CAS.
- A. Sadezky, H. Muckenhuber, H. Grothe, R. Niessner and U. Pöschl, Carbon, 2005, 43, 1731–1742 CrossRef CAS.
- A. C. Ferrari and J. Robertson, Phys. Rev. B: Condens. Matter Mater. Phys., 2000, 61, 14095–14107 CrossRef CAS.
- L. Niu, Z. Li, W. Hong, J. Sun, Z. Wang, L. Ma, J. Wang and S. Yang, Electrochim. Acta, 2013, 108, 666–673 CrossRef CAS.
- H. Xie, Z. Wu, Z. Wang, N. Qin, Y. Li, Y. Cao and Z. Lu, J. Mater. Chem. A, 2020, 8, 3606–3612 RSC.
- P. Ehrburger, N. Pusset and P. Dziedzinl, Carbon, 1992, 30, 1105–1109 CrossRef CAS.
- Z. Li, H. Peng, R. Liu, Y. Mo, B. Cao, W. Lai, X. Li, L. Pan and Y. Chen, J. Power Sources, 2020, 457, 228022 CrossRef CAS.
- M. Velický, P. S. Toth, C. R. Woods, K. S. Novoselov and R. A. W. Dryfe, J. Phys. Chem. C, 2019, 123, 11677–11685 CrossRef.
- Q. Lin, J. Zhang, W. Lv, J. Ma, Y. He, F. Kang and Q. Yang, Small, 2020, 16, 1902603 CrossRef CAS PubMed.
- E. Olsson, G. Chai, M. Dove and Q. Cai, Nanoscale, 2019, 11, 5274–5284 RSC.
- Z. Liang, X. Fan, W. Zheng and D. J. Singh, ACS Appl. Mater. Interfaces, 2017, 9, 17076–17084 CrossRef CAS PubMed.
- Y. Zhang, N. Zhang, W. Chen, Z. Rao, J. Wu, L. Xue and W. Zhang, Energy Technol., 2019, 7, 1900779 CrossRef CAS.
- W. Luo, C. Bommier, Z. Jian, X. Li, R. Carter, S. Vail, Y. Lu, J.-J. Lee and X. Ji, ACS Appl. Mater. Interfaces, 2015, 7, 2626–2631 CrossRef CAS PubMed.
- M. Duan, F. Zhu, G. Zhao, J. Hu, H. Zhang, G. Ren, Y. Meng and Z. Fan, Microporous Mesoporous Mater., 2020, 306, 110433 CrossRef CAS.
- Y. Wang, Y. Li, S. S. Mao, D. Ye, W. Liu, R. Guo, Z. Feng, J. Kong and J. Xie, Sustainable Energy Fuels, 2019, 3, 717–722 RSC.
- K. Xu, G. Du, T. Zhong, D. Chen, X. Lin, Z. Zheng and S. Wang, J. Taiwan Inst. Chem. Eng., 2020, 109, 79–89 CrossRef CAS.
- Y. Hu, L. Shen, X. Wei, Z. Long, X. Guo and X. Qiu, ChemistrySelect, 2019, 4, 6445–6450 CrossRef CAS.
- L. Qie, W. Chen, X. Xiong, C. Hu, F. Zou, P. Hu and Y. Huang, Adv. Sci., 2015, 2, 1500195 CrossRef PubMed.
- H. Wan, X. Ju, T. He, T. Chen, Y. Zhou, C. Zhang, J. Wang, Y. Xu, B. Yao, W. Zhuang and X. Du, J. Alloys Compd., 2021, 863, 158078 CrossRef CAS.
- P. Wang, B. Qiao, Y. Du, Y. Li, X. Zhou, Z. Dai and J. Bao, J. Phys. Chem. C, 2015, 119, 21336–21344 CrossRef CAS.
- Z. Li, C. Bommier, Z. Sen Chong, Z. Jian, T. W. Surta, X. Wang, Z. Xing, J. C. Neuefeind, W. F. Stickle, M. Dolgos, P. A. Greaney and X. Ji, Adv. Energy Mater., 2017, 7, 1602894 CrossRef.
- K. C. Wasalathilake, G. A. Ayoko and C. Yan, Carbon, 2018, 140, 276–285 CrossRef CAS.
- M. Inagaki, M. Toyoda, Y. Soneda and T. Morishita, Carbon, 2018, 132, 104–140 CrossRef CAS.
- Y. Li, M. Chen, B. Liu, Y. Zhang, X. Liang and X. Xia, Adv. Energy Mater., 2020, 10, 2000927 CrossRef CAS.
- H. He, D. Huang, Y. Tang, Q. Wang, X. Ji, H. Wang and Z. Guo, Nano Energy, 2019, 57, 728–736 CrossRef CAS.
- D. Luo, P. Han, L. Shi, J. Huang, J. Yu, Y. Lin, J. Du, B. Yang, C. Li, C. Zhu and J. Xu, Appl. Surf. Sci., 2018, 462, 713–719 CrossRef CAS.
- Y. Qiao, R. Han, Y. Pang, Z. Lu, J. Zhao, X. Cheng, H. Zhang, Z. Yang, S. Yang and Y. Liu, J. Mater. Chem. A, 2019, 7, 11400–11407 RSC.
- Z. Li, L. Ma, T. W. Surta, C. Bommier, Z. Jian, Z. Xing, W. F. Stickle, M. Dolgos, K. Amine, J. Lu, T. Wu and X. Ji, ACS Energy Lett., 2016, 1, 395–401 CrossRef CAS.
- L. Yang, M. Hu, H. Zhang, W. Yang and R. Lv, J. Colloid Interface Sci., 2020, 566, 257–264 CrossRef CAS PubMed.
- E. Redondo, J. Carretero-González, E. Goikolea, J. Ségalini and R. Mysyk, Electrochim. Acta, 2015, 160, 178–184 CrossRef CAS.
- J. Mao, T. Zhou, Y. Zheng, H. Gao, H. K. Liu and Z. Guo, J. Mater. Chem. A, 2018, 6, 3284–3303 RSC.
- L. Li, Y. Zheng, S. Zhang, J. Yang, Z. Shao and Z. Guo, Energy Environ. Sci., 2018, 11, 2310–2340 RSC.
- M. Carboni, J. Manzi, A. R. Armstrong, J. Billaud, S. Brutti and R. Younesi, ChemElectroChem, 2019, 6, 1745–1753 CrossRef CAS.
- S. Komaba, W. Murata, T. Ishikawa, N. Yabuuchi, T. Ozeki, T. Nakayama, A. Ogata, K. Gotoh and K. Fujiwara, Adv. Funct. Mater., 2011, 21, 3859–3867 CrossRef CAS.
- J. Fondard, E. Irisarri, C. Courrèges, M. R. Palacin, A. Ponrouch and R. Dedryvère, J. Electrochem. Soc., 2020, 167, 070526 CrossRef CAS.
- W. Luo, C. Bommier, Z. Jian, X. Li, R. Carter, S. Vail, Y. Lu, J.-J. Lee and X. Ji, ACS Appl. Mater. Interfaces, 2015, 7, 2626–2631 CrossRef CAS PubMed.
- C. Wang, J. Huang, J. Li, L. Cao, Q. Chen, C. Qian and S. Chen, ChemElectroChem, 2020, 7, 201–211 CrossRef CAS.
- E. Olsson, J. Cottom, H. Au, M.-M. Titirici and Q. Cai, Carbon, 2021, 177, 226–243 CrossRef CAS.
- M. Inagaki, Carbon, 2012, 50, 3247–3266 CrossRef CAS.
- M. M. Titirici, H. Alptekin, H. Au, A. C. Jensen, E. Olsson, M. Goktas, T. F. Headen, P. Adelhelm, Q. Cai and A. J. Drew, ACS Appl. Energy Mater., 2020, 3, 9918–9927 CrossRef.
- A. Kano, N. Hojo, S. Ito, M. Fujimoto and K. Nakura, Meet. Abstr., 2015, MA2015-02, 221 Search PubMed.
- E. Olsson, J. Cottom, H. Au, Z. Guo, A. C. S. Jensen, H. Alptekin, A. J. Drew, M. Titirici and Q. Cai, Adv. Funct. Mater., 2020, 30, 1908209 CrossRef CAS.
- Y. Cao, L. Xiao, M. L. Sushko, W. Wang, B. Schwenzer, J. Xiao, Z. Nie, L. V. Saraf, Z. Yang and J. Liu, Nano Lett., 2012, 12, 3783–3787 CrossRef CAS PubMed.
| This journal is © The Royal Society of Chemistry 2021 |

