 Open Access Article
Creative Commons Attribution 3.0 Unported Licence
A multi-residue chiral liquid chromatography coupled with tandem mass spectrometry method for analysis of antifungal agents and their metabolites in aqueous environmental matrices
Rawiwan
Wattanayon
and
Barbara
Kasprzyk-Hordern
 *
*
Department of Chemistry, University of Bath, BA2 7AY, UK. E-mail: b.kasprzyk-hordern@bath.ac.uk
First published on 3rd May 2021
Abstract
The presence and fate of antifungal agents in the environment have hardly been investigated. This is despite the increased usage of antifungal agents and higher prevalence of antifungal resistance. Stereochemistry of antifungal agents has been largely overlooked due to lack of analytical methods enabling studies at the enantiomeric level. This paper introduces a new analytical method for combined separation of achiral and chiral antifungal agents and their metabolites with the utilization of chiral chromatography coupled with triple quadrupole tandem mass spectrometry to enable comprehensive profiling of wide-ranging antifungal agents and their metabolites in environmental matrices. The method showed very good linearity and range (r2 > 0.997), method accuracy (61–143%) and precision (3–31%) as well as low (ng L−1) MQLs for most analytes. The method was applied in selected environmental samples. The following analytes were quantified: fluconazole, terbinafine, N-desmethyl-carboxyterbinafine, tebuconazole, epoxiconazole, propiconazole and N-deacetyl ketoconazole. They were predominantly present in the aqueous environment (as opposed to wastewater) with sources linked with animal and plant protection rather than usage in humans. Interestingly, chiral fungicides quantified in river water were enriched with one enantiomer. This might have consequences in terms of their ecological effects which warrants further study.
1. Introduction
Antifungal agents are widely used as pharmaceuticals, in household products and in agriculture, which has an impact on the environment. The global reporting of fungal diseases has increased significantly in recent years because of an increasing population leading to a rise in the use of antifungal drugs.1 Generally, there are 3 classes of antifungal agents used in medicines. These are azoles, polyenes, and allylamines.2 Azole antifungal agents can also be used in an anti-dandruff shampoo3 and for material preservation in paints, plastics, sealants, wall adhesives, binders, papers, or polymerised materials, such as leather, rubber, and paper.4 As a result, antifungal agents, especially azoles, have emerged as a new group of pollutants in the environment and a risk to human health due to unintentional (non-clinical) exposure.5,6 Furthermore, fungicides are commonly used on fruits and vegetables because fungal diseases are a major threat to crop production. The use of fungicides improves crop yield, quality and shelf-life. In the European Union (EU), fungicide sales constitute more than 40% of the total pesticide sales. In wine-growing regions, fungicides may account for more than 90% of all pesticide applications. Moreover, the trend of fungicide use is predicted to rise because of climate change, development of antifungal resistance, and invasive fungal species.7Antifungal agents are found in surface waters and wastewater at up to μg L−1 levels.8 Although antifungal drugs and fungicides are determined at relatively low levels in the environment, there are effects of antifungal agents on the aquatic environment, humans, and animals, especially antifungal resistance, that require immediate attention. The impact of antifungal agents on the aquatic environment has been widely reported. These include effects on the survival, growth, molting, and reproduction of invertebrates. The growth rates of plants and mortality of fish were also the result of contamination with antifungal agents.8,9 Moreover, azole agents were linked with the decrease in the formation of estradiol and testosterone in humans.10
Worldwide emergence of resistance to antifungal drugs has been reported. The use of antifungal agents for the treatment of fungal diseases in animals, humans and plants can lead to the development of antifungal resistance.1 Resistance in Candida spp. to triazole antifungal pharmaceuticals has increased in patients, including patients with AIDS, because triazole agents were used widely for prophylaxis and treatment.11 In addition, azole-resistance in Aspergillus fumigatus has been found in Western European countries as well as in the Asia–Pacific due to the use of fungicides in agriculture to treat cereal crops and wheat. Thus, the risk of endocrine effects was considered in farmers and greenhouse workers from preparing azole spray mixtures.4
An important overlooked phenomenon characteristic of many antifungal agents is their chirality. Enantiomers of the same drug have different biological properties12 leading to enantiomer-dependent effects on human metabolism, as well as occurrence in and biological effects on the environment.13–15 However, despite several papers published on the enantiomer-dependent fate and effects of several pharmaceuticals, the role of stereochemistry of most antifungal agents in the context of their fate and effect remains unknown. One of the reasons for this is the lack of available sensitive and selective analytical methods that can differentiate between enantiomers of the same pharmaceutical. Though several chiral methods have been developed to analyse chiral pharmaceuticals in the environment, high-performance liquid chromatography (HPLC) is the most commonly used technique. Chiral drugs are present in the environment at trace levels and in very complex matrices. Therefore, HPLC tandem mass spectrometry with triple quadrupole (QqQ) needs to be used for sensitive targeted identification and quantification. High resolution mass spectrometry such as QTOF can also be used for retrospective analysis and suspect screening, albeit with usually lower sensitivity. There are many factors which influence chiral recognition. These include the type of chiral selector, as well as mobile phase composition. HPLC-MS/MS has been applied in the analysis of enantiomers of antifungal agents in human serum using albumin (HSA), α1-acid glycoprotein (AGP), cellulose, and amylose columns. The occurrence of antifungal agents and their enantiomers was reported in raw wastewater, sludge, soil, and fruit samples.16–24
Although the presence of antifungal agents in the environment has become a major clinical and public health problem,1 only a few reports have been published on the investigations of antifungal agents in China,16 Germany,25 Switzerland,8 Ireland,26 Belgium,27 Spain28 and UK.29 Additionally, there is a lack of research in metabolism and transformation of chiral and achiral antifungal agents in the environment. Thus, this paper's objective is to introduce a new analytical method for combined separation of achiral and chiral antifungal agents and their metabolites with the utilization of chiral chromatography coupled with triple quadrupole tandem mass spectrometry to enable comprehensive profiling of wide-ranging antifungal agents and their metabolites in environmental matrices.
2. Materials and methods
2.1 Materials
HPLC-grade methanol (MeOH), acetonitrile (ACN), isopropanol (IPA), ammonium formate (NH4HCO2), ammonium acetate (NH4OAc), formic acid (≥96%) and dimethyl sulfoxide (DMSO) were purchased from Sigma Aldrich (UK). Ultrapure water was obtained from a Milli-Q system (UK). Achiral antifungal agents clotrimazole, fluconazole, hydroxy-tebuconazole, naftifine, prochloraz and terbinafine were purchased from Sigma Aldrich (UK). N-Desmethyl-carboxyterbinafine was purchased from Toronto Research Chemicals (Canada). Chiral antifungal agents used as racemates, (±)-econazole, (±)-ketoconazole, (±)-miconazole, (±)-propiconazole, (±)-prothioconazole-desthio, (±)-tebuconazole and hydroxy-tebuconazole, were purchased from Sigma Aldrich. (±)-Epoxiconazole, (±)-N-deacetyl ketoconazole and (±)-prothioconazole were purchased from Toronto Research Chemicals (UK). Stereoisomerically pure 2R,3S-voriconazole was purchased from Sigma Aldrich (UK). The deuterated standards terbinafine-d7, naftifine-d3, (±)-miconazole-d5, and (±)-econazole-d6 were purchased from Toronto Research Chemicals (Canada). (±)-Ketoconazole and (±)-voriconazole-d3 were purchased from Sigma Aldrich (UK). All chemicals used were of high purity (≥97%). The target antifungal agents in this work were selected based on UK prescription data, usage of fungicides in the UK and occurrence in the environment. Table 1 shows the analytes with their CAS number, structure, molecular formula, molecular weight, pKa, and log![[thin space (1/6-em)]](https://www.rsc.org/images/entities/char_2009.gif) P along with their application.
P along with their application.
2.2 Sample collection and preparation
River water, wastewater effluent and influent samples were collected in South West England in PTFE bottles as 24 h flow proportional composite samples (influent and effluent wastewater) or grab samples (river water) and placed in a cool box with ice during the transport from the site of sampling to the laboratory. Once in the laboratory, and after adjustment to pH 7 and addition of internal standards (to give the following concentrations: 1 ng mL−1 in wastewater and 0.5 ng mL−1 in river water or 100 ng mL−1 in SPE extracts), samples were subject to filtration and solid-phase extraction (SPE) as described below.2.3 Solid phase extraction
SPE was carried out using Oasis HLB cartridges (60 mg, Waters, UK). The SPE protocol is discussed in detail elsewhere.32 Briefly after filtration through a GF/F filter (0.7 μm), 100 mL of river water or 50 mL wastewater was loaded into Oasis HLB cartridges (at 3 mL min−1) and pre-conditioned with 2 mL of MeOH and 2 mL of H2O (at 1 mL min−1). The cartridges, after drying under vacuum for 30 min, were then eluted with 4 mL MeOH at 1 mL min−1. The obtained eluate was subject to evaporation under nitrogen using a TurboVap evaporator (40 °C, N2, <5 psi) and reconstituted with 500 μL mobile phase (NH4OAC/MeOH 1![[thin space (1/6-em)]](https://www.rsc.org/images/entities/char_2009.gif) :
:![[thin space (1/6-em)]](https://www.rsc.org/images/entities/char_2009.gif) 99).
99).
2.4 Chiral liquid chromatography-mass spectrometry (cLC-MS/MS)
Chromatographic separation was carried out using a chiral CHIRALCEL® OZ-RH column (5 μm particle size, L × I. D.: 15 cm × 2.1 mm, Chiral Technologies, France) with a 2.0 mm × 2.0 mm guard filter (Chiral Technologies, France). The MS system was a triple quadrupole mass spectrometer (Xevo TQD, Waters, Manchester, UK) equipped with an electrospray ionisation source (ESI) in positive mode with an optimised capillary voltage of 3 kV, source temperature of 350 °C, desolvation temperature of 350 °C and desolvation gas flow of 650 L h−1. Nitrogen, supplied by a high purity nitrogen generator (Peak Scientific, UK), was used as a nebulising and desolvation gas. Argon (99.999%) was used as a collision gas. The system was controlled using MassLynx 4.1 software (Waters, UK). The data processing software was TargetLynx (Waters, Manchester, UK).2.5 SPE-cLC-MS/MS performance
The instrumental limit of detection (IDL) and the instrumental limit of quantification (IQL) were measured from the calibration curve as the lowest measured concentration with an average peak signal to noise ratio (S/N) greater than or equal to 3 (S/N ≥ 3) across three repeat injections. The IQL was determined as the lowest measured concentration with an average S/N ≥ 10 across three repeat injections.
The enantiomeric fraction (EF) was calculated from the concentration of the first- (E1) and the second-eluted enantiomer (E2) of chiral compounds from eqn (1). The EF provided the relative concentration of enantiomers of chiral compounds as follows: EF equals 1 or 0 in the case of an enantiomerically pure compound, and 0.5 in the case of a racemate.33
 | (1) |
The resolution of enantiomeric pairs (Rs) was calculated from the retention times of the first- (t1) and the second-eluted enantiomer (t2) and the widths of the responses at the baseline (w1, w2) on the basis of the following equation:33
 | (2) |
Instrument accuracy and precision were calculated from eqn (3) and (4). Standard solutions were spiked in the mobile phase at 10, 100 and 500 ng mL−1. The accuracy and precision were determined by replicate measurements of the same concentrations (three times) within one day (intra-day) (n = 3) and over different three day periods (inter-day) (n = 9) where x is the theoretical concentration and x1–3 is the concentration measured in each sample.33
 | (3) |
 | (4) |
 | (5) |
The matrix effect (ME) was calculated by comparing the concentrations of the post-spiked sample (analyte conc.ME,x) minus analyte concentrations in the blank (analyte conc.0) to analyte concentrations in the mobile phase (analyte conc.QCx) at the following concentration levels (eqn (6)).33
 | (6) |
In environmental samples, the method detection limit (MDL) was calculated using the following equation:34
 | (7) |
In the same way, the method quantification limit (MQL) in the environmental samples was calculated as follows:34
 | (8) |
Rec is the relative recovery of the analyte in the matrix, that is the average of the recoveries obtained at three different concentrations considering the internal standard, and CF is the concentration factor.
Method accuracy (MD) was calculated (eqn (9)) to determine how close the measured concentration (analyte conc.x1–x3) was to spiked concentrations (x) and method precision (MP) was used to measure how similar the measured concentration values were to each other (eqn (10)). The concentration of the analyte in the blank river water and wastewater samples (analyte conc.0)x1–x3 was subtracted from the measured concentration. The standard deviation of analyte concentration is denoted by σ.
 | (9) |
 | (10) |
3. Results and discussion
3.1 Liquid chromatography-tandem mass spectrometry
Antifungal compounds and their metabolites were analysed using cLC-MS/MS in ESI+ mode. Optimised multiple reaction monitoring (MRM) transitions are presented in Table 2. Seventeen compounds were separated using a chiral CHIRALCEL® OZ-RH column (5 μm particle size, L × I. D.: 15 cm × 2.1 mm, Chiral Technologies, France) with a 2.0 mm × 2.0 mm guard filter (Chiral Technologies, France). The following parameters were considered when selecting method conditions: analytical characteristics such as peak area, enantiomeric resolution and signal-to-noise ratio. The selected mobile phase was 10 mM NH4OAc/MeOH 1![[thin space (1/6-em)]](https://www.rsc.org/images/entities/char_2009.gif) :
:![[thin space (1/6-em)]](https://www.rsc.org/images/entities/char_2009.gif) 99 at a flow rate of 0.075 mL min−1 and temperature of 25 °C.
99 at a flow rate of 0.075 mL min−1 and temperature of 25 °C.
| Compounds | CV/CE | MRM1 | CV/CE | MRM2 |
|---|---|---|---|---|
| Clotrimazole | 49/26 | 277.1 > 165.0 | 49/31 | 277.1 > 241.0 |
| Econazole | 35/29 | 381.7 > 125.0 | 35/18 | 381.7 > 193.0 |
| Econazole d6 | 45/50 | 387 > 130.0 | ||
| Epoxiconazole | 44/25 | 330.1 > 121.0 | 44/18 | 330.1 > 141.0 |
| Fluconazole | 30/16 | 307.1 > 238.0 | 30/18 | 307.1 > 220.0 |
| Ketoconazole | 32/35 | 531.2 > 219.0 | 32/35 | 531.2 > 489.3 |
| Ketoconazole d4 | 48/50 | 535.2 > 181.2 | ||
| N-Deacetyl ketoconazole (DAK) | 32/35 | 489.2 > 178.2 | 32/35 | 489.2 > 136.1 |
| Miconazole | 30/25 | 415.0 > 69.0 | 30/32 | 415.0 > 159.0 |
| Miconazole d5 | 40/50 | 421.0 > 161.0 | ||
| Naftifine | 30/15 | 288.0 > 117.0 | 30/18 | 288.0 > 141.0 |
| Naftifine d3 | 30/15 | 291.43 > 118.0 | ||
| Prochloraz | 18/13 | 376.1 > 308.0 | 18/17 | 376.1 > 266.0 |
| Propiconazole | 44/30 | 342.0 > 158.9 | 44/24 | 342.0/69.0 |
| Prothioconazole | 42/27 | 341.9 > 306.0 | 42/15 | 341.9/99.8 |
| Prothioconazole-desthio | 42/27 | 312.1 > 124.9 | ||
| Tebuconazole | 25/33 | 308.2 > 125.0 | 25/22 | 308.2 > 151 |
| Hydroxy-tebuconazole | 25/33 | 324.2 > 125.0 | 25/33 | 324.2 > 70.0 |
| Terbinafine | 30/18 | 292.2 > 105.0 | 30/19 | 292.2 > 141.2 |
| Terbinafine d7 | 40/20 | 299.2 > 121.0 | ||
| N-Desmethyl-carboxyterbinafine | 30/18 | 308.2 > 141.1 | 30/18 | 308.2 > 123.1 |
| Voriconazole | 25/15 | 350.1 > 127 | 25/15 | 350.1 > 224 |
| Voriconazole d3 | 36/45 | 353.3 > 127 |
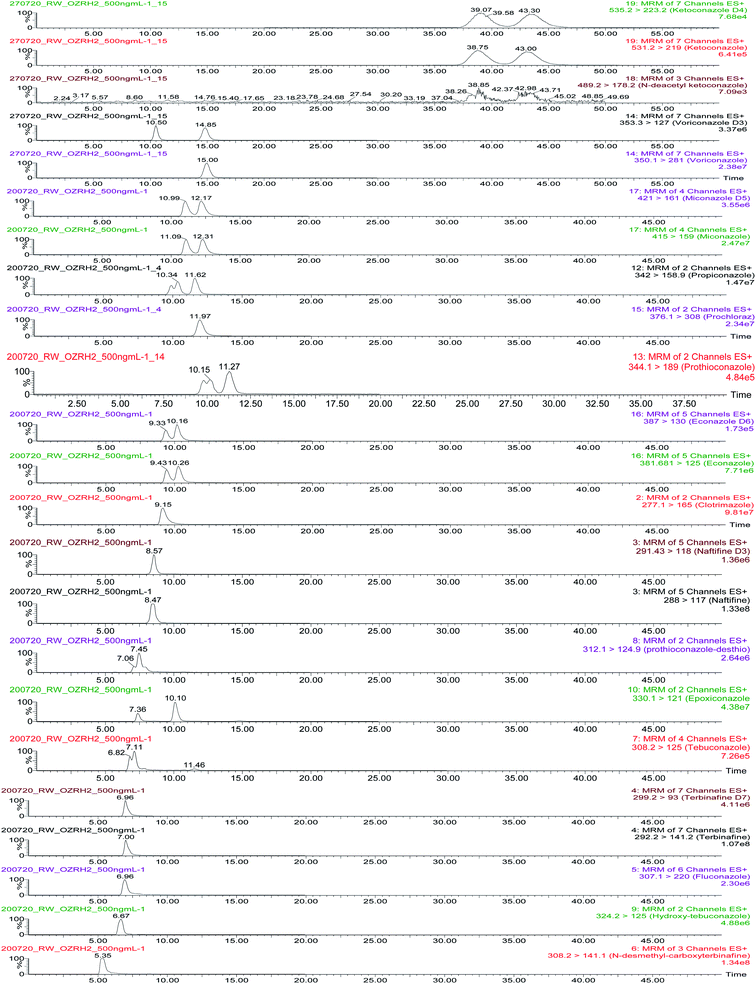
Mass chromatograms showing analyte and enantiomeric separations are presented in Fig. 1. Prothioconazole, econazole, miconazole, ketoconazole and ketoconazole metabolite, epoxiconazole and propiconzole were separated with Rs denoting 0.80, 0.56, 0.54, 0.65, 0.61, 1.87 and 0.82, respectively. The results of 2 chiral center compounds (ketoconazole, ketoconazole metabolite, epoxiconazole and propiconazole) provided 2 peaks because chemical compounds in this research study are a racemic mixture of 2 enantiomers. Other racemic compounds (tebuconazole, hydroxy-tebuconazole and prothioconazole-desthio) could not be separated and are reported as the sum of two enantiomers. The method provided very good separation and peak shapes for achiral compounds.
3.2 cLC-MS/MS performance
The following parameters were measured to test instrument performance: linearity, the instrumental limit of detection (IDL), the instrumental limit of quantification (IQL), the enantiomeric fraction (EF) of chiral compounds and instrument accuracy and precision.All analytes showed average linearities of r2 > 0.997 within the tested linearity range. Table 3 shows the r2 and range of all selected analytes including 7 enantiomeric pairs (econazole, epoxiconazole, ketoconazole, miconazole, N-deacetyl ketoconazole (DAK), propiconazole and prothioconazole). However, some compounds (clotrimazole, econazole, epoxiconazole, fluconazole, ketoconazole, n-deacetyl ketoconazole (DAK), prochloraz, propiconazole, terbinafine and voriconazole) required two calibration curves to maintain r2 ≥ 0.99.
| Compounds | Retention time | Linear range (ng mL−1) | R 2 | EF | R s | IDL (ng mL−1) | IQL (ng mL−1) | Intra-day | Inter-day | ||
|---|---|---|---|---|---|---|---|---|---|---|---|
| Accuracy [%] | Precision [%] | Accuracy [%] | Precision [%] | ||||||||
| Clotrimazole | 9.3 | 0.02–500 | 0.997 | 0.007 | 0.02 | 107 | 7 | 111 | 11 | ||
| 600–1000 | 0.997 | ||||||||||
| Econazole E1 | 9.52 | 0.08–500 | 0.997 | 0.52 | 0.56 | 0.02 | 0.08 | 103 | 2 | 104 | 5 |
| 600–1000 | 0.997 | ||||||||||
| Econazole E2 | 10.4 | 0.04–500 | 0.997 | 0.002 | 0.04 | 95 | 1 | 96 | 5 | ||
| 600–1000 | 0.997 | ||||||||||
| Epoxiconazole E1 | 7.41 | 0.03–500 | 0.997 | 0.55 | 1.87 | 0.01 | 0.03 | 98 | 11 | 92 | 9 |
| 600–1000 | 0.998 | ||||||||||
| Epoxiconazole E2 | 10.24 | 0.02–500 | 0.995 | 0.006 | 0.02 | 97 | 9 | 98 | 9 | ||
| 600–1000 | 0.997 | ||||||||||
| Fluconazole | 6.96 | 0.1–500 | 0.997 | 0.04 | 0.1 | 95 | 2 | 105 | 2 | ||
| 600–1000 | 0.997 | ||||||||||
| Ketoconazole E1 | 33.69 | 1.2–400 | 0.998 | 0.52 | 0.65 | 0.4 | 1.2 | 96 | 2 | 96 | 5 |
| 500–1000 | 0.997 | ||||||||||
| Ketoconazole E2 | 37.46 | 0.9–400 | 0.991 | 0.2 | 0.9 | 115 | 1 | 111 | 7 | ||
| 500–1000 | 0.997 | ||||||||||
| N-Deacetyl ketoconazole (DAK) E1 | 33.54 | 21.3–400 | 0.997 | ||||||||
| 500–100 | 0.998 | 0.49 | 0.61 | 6.4 | 21.3 | 101 | 6 | 102 | 5 | ||
| N-Deacetyl ketoconazole (DAK) E2 | 39.22 | 38.6–400 | 0.997 | ||||||||
| 500–100 | 0.997 | 11.6 | 38.6 | 90 | 2 | 94 | 8 | ||||
| Miconazole E1 | 11.24 | 0.03–500 | 0.997 | 0.52 | 0.54 | 0.01 | 0.03 | 111 | 4 | 101 | 9 |
| Miconazole E2 | 12.46 | 0.03–500 | 0.993 | 0.01 | 0.03 | 108 | 1 | 108 | 2 | ||
| Naftifine | 8.17 | 0.004–1000 | 0.997 | 0.001 | 0.004 | 93 | 2 | 88 | 4 | ||
| Prochloraz | 10.89 | 0.02–900 | 0.997 | 0.005 | 0.02 | 105 | 1 | 105 | 6 | ||
| Propiconazole E1 | 10.54 | 0.06–1000 | 0.998 | 0.51 | 0.82 | 0.02 | 0.06 | 94 | 4 | 98 | 12 |
| Propiconazole E2 | 11.47 | 0.04–1000 | 0.998 | 0.01 | 0.04 | 97 | 1 | 91 | 11 | ||
| Prothioconazole E1 | 10.3 | 2.9–1000 | 0.997 | 0.52 | 0.80 | 0.9 | 2.9 | 90 | 4 | 99 | 14 |
| Prothioconazole E2 | 11.67 | 2.8–1000 | 0.999 | 0.8 | 2.8 | 96 | 2 | 99 | 6 | ||
| Prothioconazole-desthio | 7.45 | 0.4–700 | 0.98 | 0.1 | 0.4 | 98 | 3 | 96 | 5 | ||
| Tebuconazole | 7.11 | 0.1–1000 | 0.993 | 0.04 | 0.1 | 93 | 1 | 96 | 6 | ||
| Hydroxy-tebuconazole | 6.67 | 0.07–1000 | 0.997 | 0.02 | 0.07 | 108 | 4 | 99 | 10 | ||
| Terbinafine | 7.05 | 0.01–1000 | 0.998 | 0.002 | 0.01 | 98 | 3 | 95 | 6 | ||
| N-Desmethyl-carboxyterbinafine | 5.84 | 0.07–300 | 0.996 | 0.01 | 0.07 | 109 | 5 | 106 | 7 | ||
| 500–1000 | 0.992 | ||||||||||
| Voriconazole | 16.17 | 0.02–1000 | 0.998 | 0.006 | 0.02 | 100 | 2 | 98 | 3 | ||
Inter-day and intra-day instrument precision were studied at three different concentrations, 10, 100 and 1000 ng mL−1. As can be seen in Table 3, intra-day and inter-day instrumental precision was <15% for all compounds. Moreover, the method is characterized by high accuracy between 88 and 115% for most compounds.
The EF provided the relative ratio of enantiomers of chiral compounds. As can be seen from Table 3, EFs of econazole, epoxiconazole, miconazole, ketoconazole and its metabolite, propiconazole and prothioconazole are within 0.49–0.55 at low, medium and high concentration levels. The resolutions of enantiomers are between 0.54 and 1.87. Very good method sensitivity was achieved with IDLs ranging from 0.001 to 11.6 ng mL−1 and IQLs ranging from 0.004 to 38.6 ng mL−1.
3.3 SPE-cLC-MS/MS performance
The SPE methodology utilized a hydrophilic lipophilic balanced (HLB) copolymer as the extraction phase. SPE recoveries and matrix effects were calculated using eqn (3) and (4), respectively. As can be seen from Fig. 2–4, the SPE recoveries and matrix effects of antifungal agents are on average 98%. The recoveries of ketoconazole, miconazole, terbinafine, N-desmethyl-carboxyterbinafine and voriconazole of river water, influent and effluent samples were between 80 and 119% with deviation from 100% linked with matrix effects. Lower apparent recoveries of epoxiconazole, fluconazole, hydroxyte-buconazole, propiconazole, pothioconazole, and prothioconazole-desthio in the influent are due to ion suppression as shown by the high negative percentage of matrix effects in Fig. 2–4.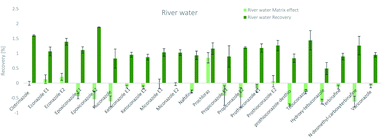 | ||
| Fig. 2 SPE recovery and matrix effect of antifungal agents in river water samples (a negative value indicates ionization suppression and a positive value indicates ionization enhancement). | ||
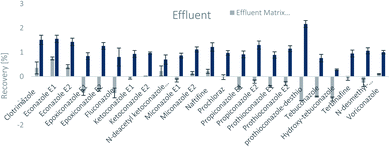 | ||
| Fig. 3 SPE recovery and matrix effect of antifungal agents in effluent samples (a negative value indicates ionization suppression and a positive value indicates ionization enhancement). | ||
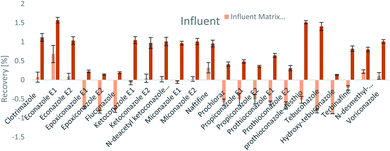 | ||
| Fig. 4 SPE recovery and matrix effect of antifungal agents in influent samples (a negative value indicates ionization suppression and a positive value indicates ionization enhancement). | ||
Table 4 shows method performance parameters. MDLs and MQLs were calculated from eqn (5) and (6), respectively. MQLs for liquid matrices ranged from 1.9 ng L−1 for naftifine in surface water, to 30362.5 ng L−1 for the metabolite of ketoconazole in the effluent. The MDLs and MQLs of most analytes are low enough to measure in the environment.8,16,26,27,29,35–41 EFs are within 0.46–0.64. The resolutions of enantiomeric pairs are between 0.51 and 2.04 in river water, effluent and influent. Most of the compounds provided good method accuracy (61–143%) and precision (3–31%).
| Compounds | River water | Effluent | Influent | |||||||||||||||
|---|---|---|---|---|---|---|---|---|---|---|---|---|---|---|---|---|---|---|
| EF | R s | MDL (ng L−1) | MQL (ng L−1) | MA (%) | MP (%) | EF | R s | MDL (ng L−1) | MQL (ng L−1) | MA (%) | MP (%) | EF | R s | MDL (ng L−1) | MQL (ng L−1) | MA (%) | MP (%) | |
| Clotrimazole | — | — | 2.4 | 7.1 | 85 | 23 | — | — | 4.5 | 15.1 | 69 | 15 | — | — | 6.1 | 20.4 | 86 | 18 |
| Econazole E1 | 0.46 | 0.59 | 10.9 | 36.2 | 105 | 13 | 0.50 | 0.51 | 14.9 | 49.8 | 96 | 10 | 0.49 | 0.73 | 14.8 | 49.3 | 104 | 15 |
| Econazole E2 | — | — | 0.6 | 14.4 | 93 | 8 | — | — | 1.3 | 27.9 | 98 | 12 | — | 1.7 | 38.6 | 113 | 7 | |
| Epoxiconazole E1 | 0.49 | 2.04 | 3.7 | 12.2 | 100 | 13 | 0.52 | 1.81 | 9.7 | 32.3 | 81 | 19 | 0.49 | 1.93 | 36.0 | 120.01 | 112 | 7 |
| Epoxiconazole E2 | — | — | 1.5 | 5.04 | 94 | 15 | — | — | 4.5 | 15.0 | 72 | 11 | — | — | 39.8 | 132.5 | 109 | 7 |
| Fluconazole | — | — | 26.06 | 86.9 | 88 | 17 | — | — | 53.4 | 177.9 | 87 | 18 | — | — | 225.6 | 751.9 | 89 | 16 |
| Ketoconazole E1 | 0.50 | 0.82 | 192.6 | 641.9 | 96 | 9 | 0.61 | 0.84 | 393.4 | 1311.3 | 61 | 10 | 0.64 | 0.89 | 351.2 | 1170.7 | 94 | 6 |
| Ketoconazole E2 | — | — | 98.3 | 536.5 | 101 | 9 | — | — | 176.8 | 964.8 | 97 | 3 | — | 176.5 | 963.3 | 125 | 5 | |
| N-Deacetyl ketoconazole (DAK) E1 | — | — | — | — | — | — | — | — | 1045.1 | 30362.5 | 135 | 18 | — | — | 6315.3 | 21051.1 | 98 | 12 |
| N-Deacetyl ketoconazole (DAK) E2 | — | — | — | — | — | — | — | — | — | — | — | — | — | — | — | — | — | |
| Miconazole E1 | 0.58 | 0.68 | 4.5 | 14.9 | 86 | 19 | 0.55 | 0.69 | 10.6 | 35.4 | 95 | 23 | 0.59 | 1.26 | 9.5 | 31.8 | 95 | 3 |
| Miconazole E2 | — | — | 4.9 | 16.4 | 123 | 24 | — | — | 9.05 | 30.2 | 104 | 22 | — | — | 10.0 | 33.4 | 143 | 31 |
| Naftifine | — | — | 0.6 | 1.9 | 87 | 11 | — | — | 0.9 | 2.8 | 89 | 16 | — | — | 1.1 | 3.6 | 97 | 27 |
| Prochloraz | — | — | 2.2 | 7.5 | 78 | 16 | — | — | 5.3 | 17.9 | 84 | 15 | — | — | 12.6 | 42.0 | 94 | 13 |
| Propiconazole E1 | 0.48 | 0.81 | 9.4 | 31.5 | 92 | 17 | 0.50 | 1.01 | 18.5 | 61.9 | 94 | 9 | 0.52 | 1.09 | 34.8 | 116.1 | 95 | 9 |
| Propiconazole E2 | — | — | 4.9 | 16.4 | 102 | 22 | — | — | 9.03 | 30.1 | 89 | 19 | — | — | 32.6 | 108.7 | 104 | 18 |
| Prothioconazole E1 | 0.50 | 0.94 | 373.4 | 1244.6 | 88 | 5 | 0.48 | 1.21 | 989.9 | 3299.8 | 96 | 14 | 0.52 | 1.02 | 1363.5 | 4545.0 | 78 | 8 |
| Prothioconazole E2 | — | — | 334.2 | 1114.2 | 99 | 19 | — | — | 735.3 | 2450.9 | 89 | 8 | — | — | 2720.8 | 9069.5 | 92 | 17 |
| Prothioconazole-desthio | — | — | 62.7 | 208.9 | 74 | 23 | — | — | 48.4 | 161.4 | 75 | 13 | — | — | 69.3 | 231.1 | 63 | 3 |
| Tebuconazole | — | — | 14.9 | 49.8 | 90 | 16 | — | — | 56.5 | 188.5 | 96 | 6 | — | — | 30.6 | 102.05 | 61 | 25 |
| Hydroxy-tebuconazole | — | — | 22.3 | 74.2 | 126 | 10 | — | — | 77.7 | 259.0 | 87 | 9 | — | — | 159.6 | 532.05 | 105 | 19 |
| Terbinafine | — | — | 1.02 | 3.4 | 106 | 17 | — | — | 1.9 | 6.4 | 96 | 6 | — | — | 2.2 | 7.4 | 107 | 9 |
| N-Desmethyl-carboxyterbinafine | — | — | 3.8 | 12.8 | 82 | 19 | — | — | 9.1 | 30.5 | 78 | 23 | — | — | 12.1 | 40.4 | 127 | 7 |
| Voriconazole | — | — | 3.4 | 11.2 | 103 | 9 | — | — | 6.4 | 21.3 | 100 | 7 | — | — | 6.3 | 21.1 | 107 | 8 |
3.4 Application to environmental matrices
The new multi-residue analytical method was applied to determine the concentration of antifungal drugs and plant fungicides in river water, influent and effluent samples collected in South West England (Table 5). The fungicide tebuconazole was found at the following concentrations: 252.4 ± 70.2, 927.5 ± 2.4 and 115.1 ± 37.6 ng L−1 in river water, effluent and influent, respectively. It is worth noting that its concentrations were higher in river water than wastewater influent indicating other than communal sources of this fungicide in the aqueous environment. Interestingly, effluent concentrations are the highest, which warrants further study regarding transformation of tebuconazole during wastewater treatment. Indeed, tebuconazole is primarily used on crops. Its metabolite, hydroxy-tebuconazole, was quantified only in the river water at 228.9 ± 54.8 ng L−1 confirming its usage and environmental transformation. Terbinafine (used in both human and animal treatment) was also determined in river water (50.2 ± 6.5 ng L−1) at higher concentrations than in wastewater influent (30.5 ± 2.4 ng L−1). Its metabolite, N-desmethyl-carboxyterbinafine, was identified only in river water at <MDL indicating other than communal sources of this contaminant. Fluconazole was present at <MQL and 101.0 ± 35.6 ng L−1 in river water and effluent, respectively. Epoxiconazole enantiomers (with primary usage on crops) were quantified only in river water with significant predominance of the E1 enantiomer: 67.3 ± 26.5 ng L−1 and 13.2 ± 4.4 ng L−1 for E1 and E2, respectively. Propiconazole enantiomers (with primary usage on crops) were also quantified only in river water at concentrations of 32.2 ± 2.0 ng L−1 and 41.3 ± 0.9 ng L−1 for E1 and E2 enantiomers, respectively. However, only one enantiomer of deacetyl-ketoconazole was determined in effluent wastewater at a concentration of 218.21 ± 38.62 ng L−1. In summary, the results of this study indicate predominance of antifungal agents in the aqueous environment with sources linked with animal and plant protection rather than usage in humans. Interestingly, chiral fungicides quantified in the river water were enriched with one enantiomer. This might have consequences in terms of their ecological effects which warrants further study.| Compounds | River water (ng L−1) | Effluent (ng L−1) | Influent (ng L−1) |
|---|---|---|---|
| Clotrimazole | ND | ND | ND |
| Econazole E1 | ND | ND | ND |
| Econazole E2 | ND | ND | ND |
| Epoxiconazole E1 | 67.3 ± 26.5 | ND | ND |
| Epoxiconazole E2 | 13.2 ± 4.4 | ND | ND |
| Fluconazole | <MQL | 101.0 ± 35.6 | ND |
| Ketoconazole E1 | ND | ND | ND |
| Ketoconazole E2 | ND | ND | ND |
| N-Deacetyl ketoconazole (DAK) E1 | ND | 218.2 ± 38.6 | ND |
| N-Deacetyl ketoconazole (DAK) E2 | ND | ND | ND |
| Miconazole E1 | ND | ND | ND |
| Miconazole E2 | ND | ND | ND |
| Naftifine | ND | ND | ND |
| Prochloraz | ND | ND | ND |
| Propiconazole E1 | 32.2 ± 2.0 | ND | ND |
| Propiconazole E2 | 41.3 ± 0.9 | ND | ND |
| Prothioconazole E1 | ND | ND | ND |
| Prothioconazole E2 | ND | ND | ND |
| Prothioconazole-desthio | ND | ND | ND |
| Tebuconazole | 252.4 ± 70.2 | 927.5 ± 2.4 | 115.1 ± 37.6 |
| Hydroxy-tebuconazole | 228.9 ± 54.8 | ND | ND |
| Terbinafine | 50.2 ± 6.5 | ND | 30.5 ± 2.4 |
| N-Desmethyl-carboxyterbinafine | <MDL | ND | ND |
| Voriconazole | ND | ND | ND |
4. Conclusions
A new multiresidue method utilizing chiral chromatography (with a chiral CHIRALCEL® OZ-RH column) and triple quadrupole tandem mass spectrometry was developed for sensitive and selective enantiomer-dependent analysis of fungicides and their metabolites in aqueous matrices such as river water and wastewater. The method showed very good linearity and range (r2 > 0.997), method accuracy (61–143%) and precision (3–31%) as well as low MQLs (1.9–30362.5 ng L−1). The method was applied in selected environmental samples. The following analytes were quantified: fluconazole, terbinafine, N-desmethyl-carboxyterbinafine, tebuconazole, hydroxy-tebuconazole, epoxiconazole, propiconazole and N-deacetyl ketoconazole. They were predominantly present in the aqueous environment (as opposed to wastewater) with sources linked with animal and plant protection rather than usage in humans. Interestingly, chiral fungicides quantified in the river water were enriched with one enantiomer. This might have consequences in terms of their ecological effects which warrants further study, also focussed on identification of individual enantiomers.Conflicts of interest
The authors declare no conflicts of interest.Acknowledgements
Rawiwan Wattanayon would like to acknowledge funding from a Royal Thai Government Scholarship. The support of the Engineering and Physical Sciences Research Council (EP/P028403/1) is greatly appreciated.References
- M. C. Fisher, N. J. Hawkins, D. Sanglard and S. J. Gurr, Science, 2018, 360, 739–742 CrossRef CAS PubMed.
- Chapter 48. Antifungal Agents, Katzung & Trevor’s Pharmacology: Examination & Board Review, 10e, AccessPharmacy, McGraw-Hill Medical, accessed 17 July 2018, https://accesspharmacy.mhmedical.com/content.aspx?bookid=514%26sectionid=41817567.
- R. M. dos Santos and M. V. Dias-Souza, Saudi J. Biol. Sci., 2017, 24, 331–337 CrossRef CAS PubMed.
- C. R. Stensvold, L. N. Jørgensen and M. C. Arendrup, Curr. Fungal Infect. Rep., 2012, 6, 178–191 CrossRef.
- P. H. Howard and D. C. G. Muir, Environ. Sci. Technol., 2011, 45, 6938–6946 CrossRef CAS PubMed.
- K. Bester, L. Scholes, C. Wahlberg and C. S. McArdell, Water Air Soil Pollut. Focus, 2008, 8, 407–423 CrossRef CAS.
- J. P. Zubrod, M. Bundschuh, G. Arts, C. A. Brühl, G. Imfeld, A. Knäbel, S. Payraudeau, J. J. Rasmussen, J. Rohr, A. Scharmüller, K. Smalling, S. Stehle, R. Schulz and R. B. Schäfer, Environ. Sci. Technol., 2019, 53, 3347–3365 CrossRef CAS PubMed.
- Z. F. Chen and G. G. Ying, Environ. Int., 2015, 84, 142–153 CrossRef CAS PubMed.
- M. H. Haeba, K. Hilscherová, E. Mazurová and L. Bláha, Environ. Sci. Pollut. Res. Int., 2008, 15, 222–227 CrossRef CAS PubMed.
- M. B. Kjærstad, C. Taxvig, C. Nellemann, A. M. Vinggaard and H. R. Andersen, Reprod. Toxicol., 2010, 30, 573–582 CrossRef PubMed.
- J. E. Woolery, E. Wombwell and M. R. Green, Clin. Med. Insights Ther., 2012, 4, CMT S5434 CrossRef.
- L. A. Nguyen, H. He and C. Pham-Huy, Int. J. Biomed. Sci., 2006, 2, 85–100 CAS.
- B. Kasprzyk-Hordern, Chem. Soc. Rev., 2010, 39, 4466 RSC.
- D. Camacho-Muñoz and B. Kasprzyk-Hordern, J. Mass Spectrom., 2017, 52, 94–108 CrossRef PubMed.
- S. Evans, J. Bagnall and B. Kasprzyk-Hordern, Environ. Pollut., 2017, 230, 368–377 CrossRef CAS PubMed.
- Q. Huang, Z. Wang, C. Wang and X. Peng, Environ. Sci. Pollut. Res., 2013, 20, 8890–8899 CrossRef CAS PubMed.
- Q. Huang, K. Zhang, Z. Wang, C. Wang and X. Peng, Anal. Bioanal. Chem., 2012, 403, 1751–1760 CrossRef CAS PubMed.
- C. Knebel, T. Heise, U. M. Zanger, A. Lampen, P. Marx-Stoelting and A. Braeuning, Food Chem. Toxicol., 2019, 123, 481–491 CrossRef CAS PubMed.
- Z. Zhang, Q. Zhang, B. Gao, G. Gou, L. Li, H. Shi and M. Wang, J. Agric. Food Chem., 2017, 65, 8241–8247 CrossRef CAS PubMed.
- M. Youness, M. Sancelme, B. Combourieu and P. Besse-Hoggan, J. Hazard. Mater., 2018, 351, 160–168 CrossRef CAS PubMed.
- Y. Li, F. Dong, X. Liu, J. Xu, J. Li, Z. Kong, X. Chen and Y. Zheng, J. Sep. Sci., 2012, 35, 206–215 CrossRef CAS PubMed.
- N. Liu, F. Dong, J. Xu, X. Liu, Z. Chen, Y. Tao, X. Pan, X. Chen and Y. Zheng, J. Agric. Food Chem., 2015, 63, 6297–6303 CrossRef CAS PubMed.
- H. Zhang, M. Qian, X. Wang, X. Wang, H. Xu, Q. Wang and M. Wang, J. Sep. Sci., 2012, 35, 773–777 CrossRef CAS PubMed.
- Z. Wang, P. Zhao, J. Yu, Z. Jiang and X. Guo, Microchem. J., 2018, 140, 222–231 CrossRef CAS.
- A. Wick, G. Fink and T. A. Ternes, J. Chromatogr. A, 2010, 1217, 2088–2103 CrossRef CAS PubMed.
- C. Lacey, S. Basha, A. Morrissey and J. M. Tobin, Environ. Monit. Assess., 2012, 184, 1049–1062 CrossRef CAS PubMed.
- J. C. Van De Steene, C. P. Stove and W. E. Lambert, Sci. Total Environ., 2010, 408, 3448–3453 CrossRef CAS PubMed.
- J. Casado, I. Rodríguez, M. Ramil and R. Cela, J. Chromatogr. A, 2014, 1339, 42–49 CrossRef CAS PubMed.
- P. H. Roberts and K. V. Thomas, Sci. Total Environ., 2006, 356, 143–153 CrossRef CAS PubMed.
- DrugBank Online, Detailed Drug and Drug Target Information, accessed 25 January 2021, https://go.drugbank.com/.
- PubChem, accessed 25 January 2021, https://pubchem.ncbi.nlm.nih.gov/.
- D. Camacho-Muñoz and B. Kasprzyk-Hordern, Anal. Bioanal. Chem., 2015, 407, 9085–9104 CrossRef PubMed.
- J. Rice, A. Lubben and B. Kasprzyk-Hordern, Anal. Bioanal. Chem., 2020, 412, 5563–5581 CrossRef CAS PubMed.
- L. Tonidandel and R. Seraglia, J. Chromatogr. Libr., 2007, 72, 193–210 CAS.
- X. Peng, Q. Huang, K. Zhang, Y. Yu, Z. Wang and C. Wang, Sci. Total Environ., 2012, 426, 311–317 CrossRef CAS PubMed.
- Q. Huang, Y. Yu, C. Tang and X. Peng, J. Chromatogr. A, 2010, 1217, 3481–3488 CrossRef CAS PubMed.
- Z. F. Chen, G. G. Ying, Y. S. Liu, Q. Q. Zhang, J. L. Zhao, S. S. Liu, J. Chen, F. J. Peng, H. J. Lai and C. G. Pan, Water Res., 2014, 58, 269–279 CrossRef CAS PubMed.
- A. Zgoła-Grześkowiak and T. Grześkowiak, J. Sep. Sci., 2013, 36, 2514–2521 CrossRef PubMed.
- R. H. Lindberg, J. Fick and M. Tysklind, Water Res., 2010, 44, 649–657 CrossRef CAS PubMed.
- K. V. Thomas and M. J. Hilton, Mar. Pollut. Bull., 2004, 49, 436–444 CrossRef CAS PubMed.
- J. Zhang, E. Snelders, B. J. Zwaan, S. E. Schoustra, J. F. Meis, K. Van Dijk, F. Hagen, M. T. Van Der Beek, G. A. Kampinga, J. Zoll, W. J. G. Melchers, P. E. Verweij and A. J. M. Debets, mBio, 2017, 8, e00791-17 Search PubMed.
| This journal is © The Royal Society of Chemistry 2021 |


