 Open Access Article
Anti microbial corrosion properties of electrospun cellulose acetate nanofibers containing biogenic silver nanoparticles for copper coatings†
Nalan Oya San Keskin *a,
Furkan Deniz
 a and
Hasan Nazırb
aPolatlı Science and Literature Faculty, Biology Department, Nanosan Laboratory, Ankara Hacı Bayram Veli University, Ankara 06900, Turkey. E-mail: nalan.san@hbv.edu.tr
bFaculty of Science, Department of Chemistry, Ankara University, Ankara 06100, Turkey
First published on 2nd November 2020
Abstract
Nanofibers with inorganic nanoparticles are novel hybrid nanocomposites that have great potential in various areas. In the present study, cellulose acetate nanofibers (CA-Nf) loaded with biogenic silver nanoparticles were prepared and characterized. In situ synthesis of silver nanoparticles was accomplished using a bacteria free solution as a reducing agent. Nanofibers incorporated with silver nanoparticles were fabricated using the electrospinning technique. Upright microscopy and SEM micrographs depicted that the CA-Nf coatings consist of dense and compact entangled nanofibers that completely cover the copper surface. Corrosion measurements were performed by potentiodynamic polarization measurements and electrochemical impedance spectroscopy (EIS) techniques on the bare copper and CA-Nf and CA-Nf_5% AgNp coated copper surfaces in artificial seawater (ASW) and Escherichia coli ATCC 13883 inoculated solutions. Weight loss and electrochemical corrosion test results revealed that the CA-Nf-coated copper had greater corrosion resistance than bare copper. The additional electrospun CA-Nf_5% AgNp coating also had greater antibacterial behavior toward model biofilm bacterium Pseudomonas aeruginosa than uncoated copper specimens. Therefore, this nanofiber with AgNps was demonstrated as an efficient anticorrosive material in both corrosive and biocorrosive marine solutions.
1. Introduction
Different kinds of microorganisms such as bacteria, microalgae or yeast attach to the surface of the metallic materials and form slime known as biofilm. In natural environments, especially which contain water, biofilms are widespread containing microbial communities and EPS (extracellular polymeric substance).1 It is widely accepted that the presence of biofilm accelerates the deterioration of these materials2,3 and this process may occur in a wide range of pipelines and is termed as Microbiologically Influenced Corrosion (MIC).4,5 In particular, the copper used in drinking water systems as a plumbing material due to its relatively low price and durability.6One of the approaches to protect the metal surface from environmental corrosion is generally achieved by anti-corrosion coatings.7,8 Common coatings include heavy metals for control of steel, aluminum alloys and galvanized steel corrosion arises health and environmental concerns.9 New alternative coatings being explored such as sol–gel and cationic plasma deposition includes inorganic and organic inhibitors.10,11 Especially, polymer coatings contain polycaprolactone (PCL), poly-lactic acid (PLA), cellulose acetate (CA) and poly-lactic-glycolic acid (PLGA) have been used for corrosion preventions.8
Electrospinning is a simple and highly versatile method to produce ultrafine fibers from polymers and non-polymers with average diameters in sub-micrometer down to nanometer range.12–14 Produced fibers which have a three-dimensional (3D) open network structure show several attractive characteristics such as high surface area to mass or volume ratio, and huge possibilities for surface functionalization by incorporating metal nanoparticles into the fibers.15 Recently, polymer nanofiber can be used as a filter, wound dressing materials, tissue scaffolds, sensors, etc.16
Cellulose acetate has been extensively investigated for its low cost and easy processability. Moreover, the production of nano-scale cellulose acetate fibers have properties like biocompatible, non-toxic and biodegradable thus making them ideal candidates for environmental applications.17 Due to their unique optical, electrical, and catalytic properties, metal nanoparticles embedded nanofibers have attracted a great deal of attention.18 When chemical and physical procedures used for synthesis of nanoparticles, hazardous by-products were produced. Moreover, these procedures contains contamination from precursor chemicals, and use of toxic solvent.19 For this reason, there is an increasing need to develop low-cost, nontoxic, and environmentally benign procedures for synthesis of nanoparticles. For this reason, the biological approach for synthesis of nanoparticles becomes important.20–22 Biological resources including plants, plants extracts, bacteria, algae, fungi and yeast can be used for the synthesis of nanoparticles.23
Here, we introduce the application electrospun cellulose acetate nanofibers decorated with biogenic silver nanoparticles for microbial corrosion protection.
2. Experimental
2.1. Materials
Cellulose Acetate (CA) (acetyl content 39.8%, Mw = 30![[thin space (1/6-em)]](https://www.rsc.org/images/entities/char_2009.gif) 000), dichloromethane (DCM, ≥ 99% GC), methanol (MetOH, ≥ 99% GC), silver nitrate (AgNO3), LB broth (Luria-Bertani), Nutrient Broth (NB), LB Agar were purchased from Sigma Aldrich (Germany). Millipore Ultrapure Water System used for the deionized water. All the materials used without any purification.
000), dichloromethane (DCM, ≥ 99% GC), methanol (MetOH, ≥ 99% GC), silver nitrate (AgNO3), LB broth (Luria-Bertani), Nutrient Broth (NB), LB Agar were purchased from Sigma Aldrich (Germany). Millipore Ultrapure Water System used for the deionized water. All the materials used without any purification.
2.2. Preparation of biogenic silver nanoparticles
Lysinibacillus sp. NOSK cell-free extract was used for the nanoparticle production. Single clone of the bacterium was inoculated in sterile Nutrient Broth (NB) at 30 °C for 48 h on a rotary shaker (E 20/60, Biosan Latvia) at 100 rpm. After the incubation period, the cell-free extract recovered by centrifugation (4000 rpm, 10 min at room temperature) and was used for further experiment. For the biosynthesis of AgNps, 10 ml of the cell-free extract was added to 90 ml of 1 mM AgNO3 solution in a 100 ml Erlenmeyer flask (pH 8), which was incubated at 37 °C on the orbital shaker set at 150 rpm in the dark. After 24 hours, the solution color turned into dark brown which indicated the formation of AgNps.2.3. Preparation of electrospun nanofibers
First, the aqueous CA solution was prepared by using 7.5% (w/v, with respect to solvent) concentration in a mixed solution DCM/MetOH (4/1, v/v) for to prepare neat non-porous CA nanofibers. For the CA nanofibers decorated with biogenic AgNps, the nanoparticles (1%, 3% and 5% wt to polymer) were disperse in a mixture of DCM/MetOH (4/1, v/v) by sonication and then CA powder was added to the suspension. Then, suspension stirred overnight, prepared solutions were loaded syringes and began electrospinning process. The electrospinning setup (Nanoweb 350, Turkey) used in this study consisted of a syringe and needle (ID = 0.6 mm), an aluminum collecting plate, and a high voltage supply. A syringe pump connected to the syringe controlled the flow rate. The CA solutions were electrospun at a positive voltage of 10–15 kV, a working distance of 10–12 cm (the distance between the needle tip and the collecting plate), and a solution flow rate of 0.5 ml h−1. All electrospinning procedures were carried out at room temperature and at 20% relative humidity. The collected nanofibers/nanowebs were dried over night at room temperature under the fume hood.2.4. Copper surface coatings with electrospun nanofibers
In our study, copper was chosen as a model metal due to its wide-spread relevance in a broad range of industrial applications and water related environments, and the ease with which CA-Nf could be directly electrospinning over Cu surfaces.ST-42 steel discs were used as a substratum for copper coatings. Before electrodeposition, discs rinsed with sterile distilled water and air dried. After that, copper coating was electrodeposited using chronoamperometry from a bath containing CuSO4·7H20; (7.5g l−1) and 1 ml concentrated H2SO4, for 200 s, using an applied potential range of 0 to −0.8 V (vs. Ag/AgCl).24 After Cu coatings, CA polymer was electrospun directly onto a 0.78 cm2 surface of the working electrode with different times (5 min, 15 min and 30 min). The thickness of the coating nanofibers measured by upright microscope (Euromex bscope, The Nederlands). All measurement was taken from at least 10 points and given with standard deviation values.
2.5. Characterization of nanoparticles and electrospun nanofibers
The antimicrobial activity of biosynthesized AgNps determined by colony forming unit (CFU) method. In CFU method, powder form of CA polymer and the different concentrations of AgNps (1%, 3% and 5% AgNps with respect to CA content) and 10 mg CA-Nf_5% AgNps were added to sterile LB broth and inoculated separately with freshly grown Pseudomonas aeruginosa (ATTC 27853). After incubation period, the inoculum was diluted and spread uniformly onto the individual plates. All the plates incubated at 37 °C and at the end of inoculation time, bacterium was counted.
The corrosion rate was calculated from the weight loss data as following:
| Vcorr = 87600 × Δm/ρAt | (1) |
(a) Cu electrodes placed in artificial seawater under sterile conditions (Cu),
(b) Cu electrodes placed in artificial seawater in the presence of Escherichia coli (ATTC 13883) (Cu_E. coli)
(c) Cu electrode coated with CA nanofiber in artificial seawater under sterile conditions (Cu_CA-Nf)
(d) Cu electrode coated with CA nanofiber in the presence of Escherichia coli (Cu_CA-Nf_E. coli)
(e) Cu electrode coated with CA nanofiber contains biogenic 5% AgNp in artificial seawater under sterile conditions (Cu_5% AgNps-CA-Nf)
(f) Cu electrode coated with CA nanofiber contains biogenic 5% AgNp in the presence of Escherichia coli (Cu_5% AgNps-CA-Nf_E. coli).
In the setups which contain bacterium (b, d and f), bacterium cultured at 30 ± 1 °C on a rotary shaker at 100 rpm for 24 h (New Brunswick Scientific Innova 4230) in a N. Broth medium used for enrichment culture, which contained peptone from meat 5.0 g, meat extract 3.0 g, sodium chloride 6.0 g in 1 l deionized water. After 24 h incubation, cultured bacterium was centrifuged at 5000 rpm and cell number in the bacterial solution was determined based on the standard calibration with the assumption that an OD600 nm value of 1.0 is equivalent to 109 cells per ml. Exponential phase bacteria were used for all experiments to ensure reproducibility.
EIS studies were conducted using CH Instruments Inc., USA (Model CHI-608E) with a traditional three-electrode cell was used, with platinum as the counter electrode, an Ag/AgCl (3 M KCl) as the reference electrode and copper disc (0.78 cm2 exposed area) as the working electrode. First, working electrode polished with abrasive paper (400, 600, 800 and 1200 grade) and then cleaned with ethyl alcohol. At the end, in order to sterilize the samples, all the samples exposed to ultraviolet (UV) light for 30 min. The ZSimpwin and EISSA data-analysis software were used to fit the EIS data. Corrosion experiments were performed in duplicates.
3. Results and discussion
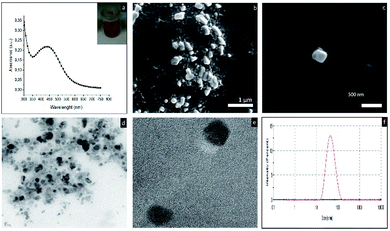
The first characterization analysis of the biosynthesized AgNps performed by using UV-vis spectroscopy. Fig. 1a shows the UV-vis absorption spectra recorded from aqueous AgNO3 – the cell free extract of the Lysinibacillus sp. NOSK medium after 24 hour incubation. The characteristic surface plasmon resonance (SPR) peak of the mixture was between 420 to 430 nm, demonstrating the presence of AgNps. In addition, inset photograph showed the characteristic dark brown color of the AgNps. Fig. 1b and c showed the morphology of the AgNps taken from SEM analysis. Moreover, TEM study revealed that the silver nanoparticles are spherical in shape (Fig. 1d and e). Fig. 1d showed the average particle size approximately 42 ± 8.54 nm. The zeta potential value is a measure of dispersion stability. Absolute zeta potentials >30 mV is considered sufficient to ensure colloidal stability of dispersions. In this study, zeta potential of the AgNps is −23.1 ± 1.97 shows the incipient instability.25The representative SEM images of electrospun CA fibers obtained from 7.5% (w/v) polymer solutions are shown in Fig. 2. The SEM imaging showed that the electrospun CA nanofibers were bead free and smooth morphology having average fiber diameter (AFD) of 865 ± 87 nm. Inset shows the photograph of nanofibrous web.
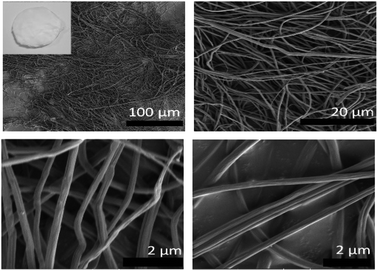 | ||
| Fig. 2 SEM micrographs of pristine CA-Nf, Inset shows the photo of the pristine CA-Nf after electrospinning process. | ||
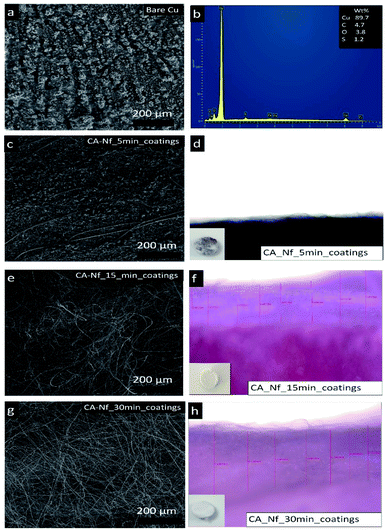
Fig. 3a and b shows the SEM image and EDAX analysis of the bare copper disc respectively. Different times such as 5 min, 15 min and 30 min were used for the Cu discs coatings. Fig. 3c shows the SEM images of Cu disc after 5 minutes nanofiber coatings. In this micrograph, a few nanofibers observed but Cu surface was still seen. This result confirmed with thickness measurement taken from upright microscope and the coating time was not enough (Fig. 3d). When coating time increase to 15 min, whole Cu disc surface coated with CA nanofiber successfully (Fig. 3e) and the coating thickness was 445.23 ± 59.88 μm (Fig. 3f). After 30 minutes of coating, thickness was increased to 709.43 ± 86.15 μm (Fig. 3h) but when the whole surface was coated, the jet of the nanofiber passed to irregular form and polymer began to freeze. At the end of this results, 15 minutes coating time is chosen for the Cu coatings with CA nanofibers.
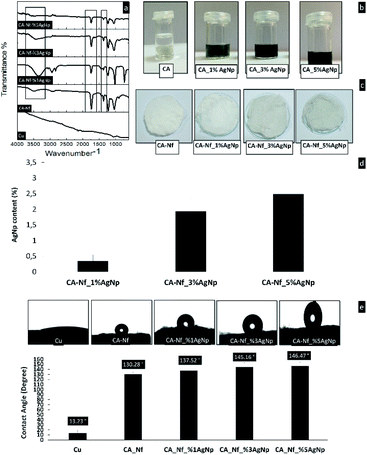
The FTIR spectrum of Cu, CA-Nf, CA-Nf with 1%, 3% and 5% AgNps shown in Fig. 4a. For CA-Nf, strong characteristic adsorption peaks at 1745 (νC![[double bond, length as m-dash]](https://www.rsc.org/images/entities/char_e001.gif) O), 1375 (νC–CH3), and 1235 cm−1 (νC–O–C) corresponding to the vibrations of the acetate group. In addition, the wide stretching band at 3500 cm−1 correspond to hydroxyl groups (νO–H) of CA polymer. After incorporation of increased concentration of biogenic AgNps, the hydroxyl vibration peak at 3500 cm−1 slightly decreases.26 Fig. 4b shows images of polymer solutions with different concentrations of AgNps. The solution without AgNps is CA solution was colorless. As expected, dark brown color was increased while increased the concentration of AgNps. Fig. 4c shows the electrospun CA-Nf with AgNps nanofibrous mats. The dark brown nanofibers were obtained after electrospinning process and the color was darker from CA-Nf_1% AgNP to CA-Nf_5% AgNP. The amount of AgNps in the CA-Nf with %, 3% and 5% AgNps were determined by ICP and shows in Fig. 4d. The results from the ICP analysis disclosed the Ag contents of all electrospun nanofibers samples as follows: 0.34 ± 0.7, 1.93 ± 0.4 and 2.48 ± 0.2 wt% for CA, CA-Nf with 1%, 3% and 5% AgNps. There was a strong correlation between Ag contents against the concentrations of electrospin polymer solutions. Because of the highest Ag content, CA-Nf_5% AgNP was chosen for the anti-microbial corrosion coatings for electrochemical analysis. Due to hydrophilic to hydrophobic transformation using electrospinning, cellulose acetate (CA) polymer used frequently for the filtration studies. Fig. 4e shows the results of a water contact angle test on the CA-Nf vs. CA-Nf with AgNps (1%, 3% and 5%). It is known that hydrophobic surface shows a high-water contact angle (θ > 90°).27 Copper surface shows the lowest contact angle which is 13.23 indicating the surface to be hydrophilic. After, CA-Nf coatings on the Cu surface, contact angle increased to 130.28 suggesting nature of nanofiber mat. Moreover, when increase the AgNps concentrations, electrospun mats with AgNps increase the contact angles and CA-Nf_5% AgNps showed the highest contact angle 146.47 thus being super-hydrophobic in nature. Han et al. shows that electrospun CA nanofibers floating on water and stand stable for 17 weeks.28
O), 1375 (νC–CH3), and 1235 cm−1 (νC–O–C) corresponding to the vibrations of the acetate group. In addition, the wide stretching band at 3500 cm−1 correspond to hydroxyl groups (νO–H) of CA polymer. After incorporation of increased concentration of biogenic AgNps, the hydroxyl vibration peak at 3500 cm−1 slightly decreases.26 Fig. 4b shows images of polymer solutions with different concentrations of AgNps. The solution without AgNps is CA solution was colorless. As expected, dark brown color was increased while increased the concentration of AgNps. Fig. 4c shows the electrospun CA-Nf with AgNps nanofibrous mats. The dark brown nanofibers were obtained after electrospinning process and the color was darker from CA-Nf_1% AgNP to CA-Nf_5% AgNP. The amount of AgNps in the CA-Nf with %, 3% and 5% AgNps were determined by ICP and shows in Fig. 4d. The results from the ICP analysis disclosed the Ag contents of all electrospun nanofibers samples as follows: 0.34 ± 0.7, 1.93 ± 0.4 and 2.48 ± 0.2 wt% for CA, CA-Nf with 1%, 3% and 5% AgNps. There was a strong correlation between Ag contents against the concentrations of electrospin polymer solutions. Because of the highest Ag content, CA-Nf_5% AgNP was chosen for the anti-microbial corrosion coatings for electrochemical analysis. Due to hydrophilic to hydrophobic transformation using electrospinning, cellulose acetate (CA) polymer used frequently for the filtration studies. Fig. 4e shows the results of a water contact angle test on the CA-Nf vs. CA-Nf with AgNps (1%, 3% and 5%). It is known that hydrophobic surface shows a high-water contact angle (θ > 90°).27 Copper surface shows the lowest contact angle which is 13.23 indicating the surface to be hydrophilic. After, CA-Nf coatings on the Cu surface, contact angle increased to 130.28 suggesting nature of nanofiber mat. Moreover, when increase the AgNps concentrations, electrospun mats with AgNps increase the contact angles and CA-Nf_5% AgNps showed the highest contact angle 146.47 thus being super-hydrophobic in nature. Han et al. shows that electrospun CA nanofibers floating on water and stand stable for 17 weeks.28
SEM images of the prepared CA nanofibers containing different concentration of AgNps indicate that fibers were uniform in size. Silver nanoparticles are randomly distributed on CA nanofiber. The elemental composition of the CA-Nf_5% AgNP, determined by EDX analysis, confirmed the presence of Ag. Fig. 5 also shows the TEM images of the structure and distributing of the AgNps (5% wt) in the CA nanofibers. As seen in Fig. 5, AgNps were seen as black spherical spots in TEM images of the fiber samples and distributed in and on the nanofiber.
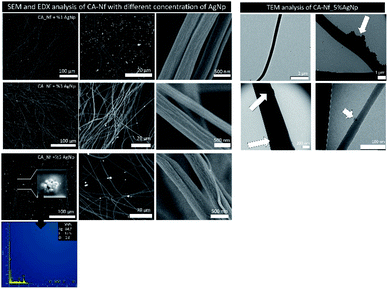 | ||
| Fig. 5 SEM and EDX analysis of CA-Nf with different concentration of AgNps and TEM analysis of CA-Nf_5% AgNps. | ||
The antimicrobial activity of the CA powder, biogenic AgNps (1%, 3% and 5% wt) and developed nanofibers with 5% wt AgNps tested against Gram-negative, biofilm forming bacterium P. aeruginosa. Cellulose acetate powder form do not have antibacterial activity so their NF were not compared. Fig. 6a indicates the representative photographs of plates with the counts of bacterium after 24 h incubation time and Fig. 6b shows the growth incubation percent of the materials. As seen in the plates and counts, pure CA don't have antimicrobial activity. On the contrary, AgNps with increased concentrations show efficient antibacterial activity against P. aeruginosa. For 1% AgNps, the growth inhibition rate is 25% ± 0.5 while increased the AgNps concentration to 3% AgNps, the growth inhibition rate increased to 80% ± 1.4. Among, CA-Nf with AgNps samples, the CA-Nf_5% AgNps has shown highest effective antimicrobial activity with 100% ± 0.1 growth inhibition rate. Moreover, chosen the coating materials within CA-Nf with different AgNps which is CA-Nf_5% shows 70% ± 0.8 growth inhibition rate. The antimicrobial activity of the CA-Nf_5% decreased compare to antimicrobial activity of 5% AgNps that correlates with ICP results. In antimicrobial analysis, certain weight of (10 mg) were cut and used. Due to irregular electrospinning jet, nanofiber mats which contains less AgNps compare to powder form of AgNps in polymer show heterogeneity. For this reason, antimicrobial activity difference between mats and powder form is quite different.
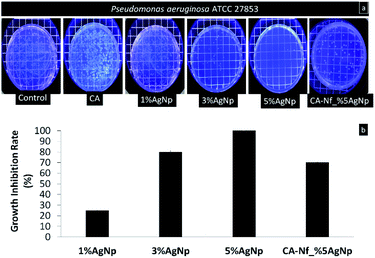 | ||
| Fig. 6 Antimicrobial activity of CA powder, different concentration of AgNps and CA-Nf_5% AgNps against P. aeruginosa (a) plate count photos (b) growth inhibition rate. | ||
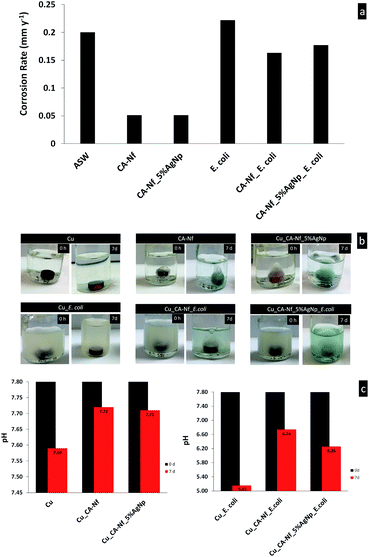
Fig. 7 shows corrosion rates values (mm y−1) for the Cu, Cu coated CA-Nf and Cu coated CA-Nf with 5% AgNps in the ASW and ASW inoculated with E. coli for 7 days. Also, Fig. 7 shows photographs of the Cu discs weight loss analysis in ASW and ASW inoculated with bacterium. It obviously shows that the corrosion rates decrease with the presence of CA-Nf coatings in both ASW and ASW inoculated with bacterium. The observed decreased corrosion rates are associated with larger surface coverage area of the CA-Nf on the copper surface. Meanwhile, when bacterium inoculation in ASW, the increase of protection efficiency can be achieved with AgNps due to strong antimicrobial activity with the increased coverage area of nanofiber. pH is an important factor in corrosion mechanisms. For this reason, the pH of all test solutions was measured prior to and after exposure. Normally, pH of the ASW is 7.8. Copper discs in ASW after 7 days, pH decreased to 7.59. However, pH values of the ASW with Cu_CA-Nf and Cu_CA-Nf with AgNps change really small such as 7.72 and 7.71 respectively. In microbial corrosion, bacterium generally decreased the pH values and caused corrosion.24 In this study, bacterium decreased the pH value 7.8 to 5.15. On the contrary, after Cu coatings with CA-Nf, electrospun nanofiber protects the surface and the pH increased to 6.74. The similar pH results (pH 6.26) was taken from CNf_5% AgNps.
The corrosion morphologies of all coupons are shown in Fig. 8. After 7 days immersion in ASW and ASW inoculated with E. coli, bare copper surface (Cu, Cu_E. coli) show a surface with pits and cracks. The copper surface with nanofiber coatings exhibit different surface properties from that of the bare Cu surface. CA-Nf coatings were still stand rough and uneven that coated all over the surface.
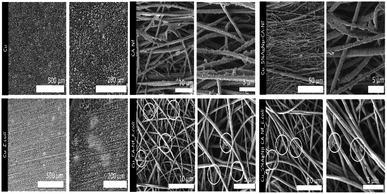 | ||
| Fig. 8 SEM images of the Cu, Cu coated CA-Nf and Cu coated CA-Nf with 5% AgNps after corrosion experiments. | ||
To further investigate the anticorrosion protection provided by CA-Nf and CA-Nf_5% AgNps, we discussed the electrochemical behavior of the coatings using potentiodynamic polarization and EIS. Fig. 9a and b shows the Tafel polarization curves of the bare Cu, Cu coated with CA-Nf and Cu coated with CA-Nf_5% AgNps in the (a) ASW and (b) ASW inoculated with bacteria. The values of corrosion kinetic parameters like corrosion current density (Icorr), corrosion rate and corrosion potential (Ecorr) were calculated from polarization curves (Table S1†). Copper surface coated with bare CA-Nf and CA-Nf loaded with AgNps has lower Icorr (19.02 ± 0.2 μA cm−2, 14.55 ± 1.4 μA cm−2, respectively) compare to uncoated Cu (42.5 ± 0.45 μA cm−2). The reduced Icorr is attributed to the presence of CA nanofibers on the Cu surface, which block the ions at the electrode. In ASW inoculated with bacterium, Icorr value was 109.9 ± 4.8 μA cm−2 due to bacterial effect. However, bare CA-Nf and CA-Nf loaded with AgNps act as a barrier and reduce solution infiltration into the substrate and decrease the Icorr value; 5.42 ± 0.4 μA cm−2 and 25.97 ± 2.46 μA cm−2 respectively. Apparently, bare CA-Nf coating and CA-Nf coating with 5% AgNps held the lowest Icorr and the lowest corrosion rates as shown in Table S1,† which indicate the best corrosion resistance. Similarly, Bakhsheshi-Rad et al.29 reports that, poly-L-lactic acid (PLLA–åkermanite (AKT)–doxycycline (DOXY) nanofiber coating enhance the corrosion resistance magnesium alloys.
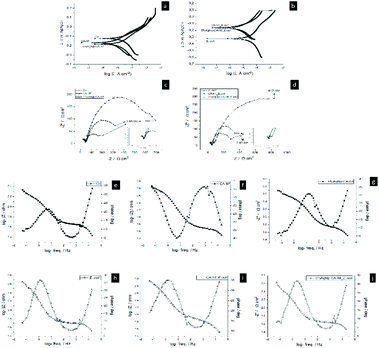 | ||
| Fig. 9 Abiotic and biotic corrosion set ups potentiodynamic polarization curves (a and b), Nyquist plots (c and d) and Bode plots (e–j). | ||
Typical electrochemical impedance spectroscopy results of bare Cu, Cu coated with CA-Nf and Cu coated with CA-Nf_5% AgNps in the Fig. 9c ASW and Fig. 9d ASW inoculated with bacteria are shown as Nyquist plots. In addition, insets show the clear view of plots. In the circuit, Rs is the resistance of solution, Rp is pore resistance and Rct is the resistance of charge transfer. QCPE and Qdl are the CPE parameters for the inhomogeneous layer and the double layer. A constant phase element (CPE) is used due to the microscopic roughness of a surface. Rct is corrosion rate of the corrosion process occurring at the interface of coating and metal. When the Rct value increased the electron, transfer is more difficult which makes the corrosion reaction more difficult to occur, meaning a lower corrosion rate.30–32 CA-Nf shows excellent corrosion resistance can be inferred by the value of Rct in the (653.5 Ω cm2) which was ∼18 fold higher than copper surface (Rct 36.07 Ω cm2) in the biotic experiments. Similar results taken from biotic experiments. Same situation like abiotic experiments, Rct value of the Cu inoculated with E. coli was lower than (232.8 Ω cm2) Cu_CA-Nf inoculated with E. coli (1062 Ω cm2) indicated that the hydrophobic CA nanofibrous coatings could present a superior application prospect in anti-corrosive protection. Furthermore, equivalent circuit, R (QR) (QR) two time constants for abiotic and bacterium inoculated solutions represents the formation of a double layer; an outer layer of the oxide film/heterogeneous biofilm/nanofiber/nanofiber/nanofiber with AgNps and inner layer of the copper coatings32 (Fig. S1†). In addition, Nyquist fitted plots according to the equivalent circuit shows in Fig. S2.†
4. Conclusions
Novel anticorrosion CA-Nf with biogenic AgNps coatings were successfully prepared on copper surfaces. Approximately 445 μm thin and dense nanofiber coatings with and without AgNps were clearly confirmed from the SEM, TEM imaging and EDX analysis. According to the present study, potentiodynamic polarization and electrochemical impedance parameters for microbial corrosion of copper in ASW in abiotic and biotic environments indicated that, electrospun CA nanofiber effectively protected the copper both abiotic and biotic marine environments.Conflicts of interest
There are no conflicts to declare.Acknowledgements
The Scientific and Technological Research Council of Turkey (TÜBİTAK, project MAG#218M508) is acknowledged for funding the research.Notes and references
- S. Chen and D. Zhang, Corros. Sci., 2018, 136, 275–284 CrossRef CAS.
- J. Hou, L. Wang, C. Wang, S. Zhang, H. Liu, S. Li and X. Wang, J. Environ. Sci., 2019, 75, 40–53 CrossRef.
- A. Marciales, Y. Peralta, T. Haile, T. Crosby and J. Wolodko, Corros. Sci., 2019, 146, 99–111 CrossRef CAS.
- M. S. Suma, R. Basheer, B. R. Sreelekshmy, V. Vipinlal, M. A. Sha, P. Jineesh, A. Krishnan, S. R. Archana, V. S. Saji and S. M. A. Shibli, Int. Biodeterior. Biodegrad., 2019, 137, 59–67 CrossRef CAS.
- Q. Qu, Y. Kang, R. Huang, S. Li, L. Li, D. Yu and B. Zhu, Colloids Surf., B, 2018, 173, 139–147 Search PubMed.
- I. T. Vargas, M. A. Alsina, J. P. Pavissich, G. A. Jeria, P. A. Pastén, M. Walczak and G. E. Pizarro, Bioelectrochemistry, 2014, 97, 15–22 CrossRef CAS.
- A. Yadav, R. Kumar, H. K. Choudhary and B. Sahoo, Carbon, 2018, 140, 477–487 CrossRef CAS.
- D. E. Tallman, G. Spinks, A. Dominis and G. G. Wallace, J. Solid State Electrochem., 2002, 6, 73–84 CrossRef CAS.
- E. A. González, N. Leiva, N. Vejar, M. Sancy, M. Gulppi, M. I. Azócar, G. Gomez, L. Tamayo, X. Zhou, G. E. Thompson and M. A. Páez, J. Mater. Res. Technol., 2019, 1–10 Search PubMed.
- K. Alasvand Zarasvand and V. R. Rai, Int. Biodeterior. Biodegrad., 2014, 87, 66–74 CrossRef CAS.
- M. A. Deyab, M. M. Osman, A. E. Elkholy and F. El-Taib Heakal, RSC Adv., 2017, 7, 45241–45251 RSC.
- M. Teng, F. Li, B. Zhang and A. a. Taha, Colloids Surf., A, 2011, 385, 229–234 CrossRef CAS.
- A. Celebioglu and T. Uyar, Mater. Lett., 2011, 65, 2291–2294 CrossRef CAS.
- N. O. San Keskin, A. Celebioglu, O. F. Sarioglu, T. Uyar and T. Tekinay, Colloids Surf., B, 2018, 161, 169–176 CrossRef CAS.
- W. Zhong, J. Text. Sci. Eng., 2012 DOI:10.4172/2165-8064.1000e113.
- C. I. Tsivintzelis, M. Bridakis and J. L. Philippou, Proceedings 4th Work. Nanosci. Nanotechnologies, 2007, vol. 47, p. 103 Search PubMed.
- N. O. San, A. Celebioglu, Y. Tümtaş, T. Uyar and T. Tekinay, RSC Adv., 2014, 4, 32249–32255 RSC.
- W. K. Son, J. H. Youk and W. H. Park, Carbohydr. Polym., 2006, 65, 430–434 CrossRef CAS.
- S. Menon, S. D. Shrudhi, H. Agarwal and V. K. Shanmugam, Colloid Interface Sci. Commun., 2019, 29, 1–8 CrossRef CAS.
- I. Ali, C. Peng, Z. M. Khan, I. Naz, M. Sultan, M. Ali, I. A. Abbasi, T. Islam and T. Ye, J. Environ. Manage., 2019, 230, 128–150 CrossRef CAS.
- A. Roy, O. Bulut, S. Some, A. K. Mandal and M. D. Yilmaz, RSC Adv., 2019, 9, 2673–2702 RSC.
- D. Hebbalalu, J. Lalley, M. N. Nadagouda and R. S. Varma, ACS Sustainable Chem. Eng., 2013, 1, 703–712 CrossRef CAS.
- S. A. Wadhwani, U. U. Shedbalkar, R. Singh and B. A. Chopade, Enzyme Microb. Technol., 2018, 111, 81–86 CrossRef CAS.
- N. O. San, H. Nazir and G. Dönmez, Corros. Sci., 2011, 53, 2216–2221 CrossRef CAS.
- N. O. S. Keskin, N. K. Kiliç, G. Dönmez and T. Tekinay, J. Nano Res., 2016, 40, 120–127 CAS.
- F. Xu, B. Weng, L. A. Materon, A. Kuang, J. A. Trujillo and K. Lozano, J. Polym. Eng., 2016, 36, 269–278 CAS.
- J. Wang and G. Yi, Nanoscale Res. Lett., 2019, 14, 1–10 CrossRef.
- O. Adagba, T. Djè, K. Christian and S. B. Philomène, Int. J. Innov. Appl. Res., 2017, 5, 33–40 Search PubMed.
- H. R. Bakhsheshi-Rad, M. Akbari, A. F. Ismail, M. Aziz, Z. Hadisi, E. Pagan, M. Daroonparvar and X. Chen, Surf. Coat. Technol., 2019, 377, 124898 CrossRef CAS.
- Y. Yao, H. Sun, Y. Zhang and Z. Yin, Prog. Org. Coat., 2020, 139, 105470 CrossRef CAS.
- N. O. San, H. Nazir and G. Dönmez, Corros. Sci., 2012, 64, 198–203 CrossRef CAS.
- N. O. San, H. Nazir and G. Dönmez, Eng. Failure Anal., 2012, 25, 63–70 CrossRef CAS.
Footnote |
| † Electronic supplementary information (ESI) available. See DOI: 10.1039/d0ra07641d |
| This journal is © The Royal Society of Chemistry 2020 |

