 Open Access Article
Creative Commons Attribution 3.0 Unported Licence
Using iron sulphate to form both n-type and p-type pseudo-thermoelectrics: non-hazardous and ‘second life’ thermogalvanic cells†
Mark A.
Buckingham
 ,
Kristine
Laws
 ,
Jason T.
Sengel
and
Leigh
Aldous
 *
*
Department of Chemistry, Britannia House, King's College London, London, SE1 1DB, UK. E-mail: leigh.aldous@kcl.ac.uk
First published on 18th August 2020
Abstract
Thermogalvanic cells can act like ‘liquid thermoelectrics’ to convert a thermal energy gradient to electrical energy. Such cells are typically combined electrically in-series in devices to boost the output voltage (as thermocells). However, the typical system involves a potentially fatal combination of inherently acidic or acidified Fe2+/3+ and [Fe(CN)6]3−/4− electrolytes; mixing and heating is expected to trigger extremely toxic HCN gas release. Here we demonstrate that benign aqueous iron(II/III) sulphate can be combined with equally benign sodium sulphate and sodium hydrogen sulphate; the first leads to an [Fe(SO4)2]−/2− thermocell (Seebeck coefficient, Se = −0.4 mV K−1), and the second to a thermocell with intermediate [FeSO4]0/+ and [Fe(HSO4)]+/2+ character (Se = +0.57 mV K−1). Their fundamental thermoelectrochemistry was explored, and their speciation elucidated. It was demonstrated that these can be utilised electrically in-parallel and in-series in thermogalvanic devices. When connected electrically in-series the thermocells presented here displayed temperature-dependent open circuit potentials only ca. one-third that typically reported for the ‘conventional’ combination of Fe2+/3+- and [Fe(CN)6]3−/4−-based thermocells (0.8 mV K−1vs. ca. 3 mV K−1, respectively). However, whereas the latter thermocells cannot be safely mixed, when the iron-sulphate cells were ‘accidently’ mixed they safely form a mixed thermocell electrolyte (Se = +0.19 mV K−1), enabling a ‘second life’ of both the electrolyte and thermocell devices. This novel ‘all-iron sulphate’ thermocell was compared against the typically employed Fe2+/3+ and [Fe(CN)6]3−/4− combination using the 12 principles of green chemistry and of green engineering, further demonstrating the inherent sustainability, safety and ‘green’ credentials of this system (but not yet efficiency). This work demonstrates how functionality and complexity can be introduced in a safe manner, while also preventing potential accidents and enabling new ‘end-of-life’ opportunities.
Introduction
Both solid-state thermoelectric systems and liquid-state thermogalvanic systems exploit entropy; when exposed to a temperature difference across these systems they generate a flow of electricity.1 Given that approximately two-thirds of the energy deliberately generated by mankind is currently lost as heat,2 such devices present tremendous potential for improving global energy efficiency.The magnitude of potential difference generated by these systems is typically quantified by the Seebeck coefficient, Se.3 For thermoelectrics, this is given by eqn (1);3
 | (1) |
Thermogalvanic devices can be considered as pseudo-thermoelectric devices, although their precise mechanism of operation differs significantly. Thermogalvanics are typically liquid-state or gelled-liquid electrolyte devices.9 These electrolytes contain two oxidation states of a common redox couple, sandwiched between two electrodes at dissimilar temperatures; ionic conductivity replaces electron and hole transport.10 The thermogalvanic Seebeck coefficient, Se(tg), is related to the entropy difference between the two states of the redox couple, ΔSrc, as shown by eqn (2);
 | (2) |
Several n–p-type thermogalvanic combinations (one +Se(tg), one −Se(tg)) have been reported, but not applied to prepare complete devices that generate a consistent power output. For example, Jia et al. observed different ratios of water to ionic liquid in binary systems could yield either positive or negative Se(tg) values;18 Liang et al. observed different ratios of [S3]2− to S8 in DMSO could also result in different Se(tg) signs.19 Aldous et al. demonstrated how the ferrocene/ferrocenium redox couple could be made to have a positive or negative Se(tg) in ionic liquids by covalently tethering on appropriately charged groups.20
For actual devices (or thermocells) with multiple thermogalvanic cells in-series to boost the voltage output, one device was recently reported where the Se(tg) of the aqueous I−/[I3]− redox couple (+0.71 mV K−1) was inverted into the p-type direction upon introduction of poly-N-isopropylacrylamide, to −1.91 mV K−1.21 Using this, 50 n–p-type pairs were combined to form a device capable of generating 1 V from body heat.21 Besides this, other reported thermocell devices employ inherently or deliberately acidified aqueous solutions of Fe2+/3+ (Se(tg) up to +1.76 mV K−1) in conjunction with aqueous solutions of [Fe(CN)6]3−/4− (Se(tg) up to −1.43 mV K−1).4,14–17 Fundamental studies have recently probed the Fe2+/3+ system22 and [Fe(CN)6]3−/4− system23 in detail, as well as the fundamentals of their combinations electrically in-series and in-parallel.4 These in-series thermocell devices have also been applied, e.g. to charge capacitors15,17 and light LEDs.16
One major drawback of the combined usage of inherently acidic Fe2+/3+ and [Fe(CN)6]3−/4− in a thermocell device is their mutual incompatibility. Both [Fe(CN)6]3− and [Fe(CN)6]4− are unstable when exposed to UV light,24–26 normal tungsten or fluorescent lighting,27 high pH,24 low pH28,29 and high temperatures.30–33 In particular, the degradation products at high temperature and low pH is known to be HCN28,30,31,34 which is extremely toxic to humans.35–37 Thermocell [Fe(CN)6]3/4− electrolytes even dissolve gold nanoparticles, via CN− loss.38
Risk assessment prior to preparing such thermocells revealed that neither K3[Fe(CN)6] nor K4[Fe(CN)6] should be combined with acid and heated;39,40 there is even a tragic suicide case where K4[Fe(CN)6] was heated with acid in a sealed vehicle environment to release a lethal dose of HCN.36 Despite this, reported thermocell works note using [Fe(CN)6]3−/4− solutions in close conjunction with a heat source and Fe2+/3+ solutions containing up to 10 wt% HCl,17 and even non-acidified aqueous solutions of Fe2+/3+ are strongly inherently acidic due to water-of-hydration hydrolysis.22Table 1 summarises five reported works which used Fe2+/3+ and [Fe(CN)6]3−/4− to prepare in-series thermocell devices; the produced electrical power values are reported, but for each a ‘worst case scenario’ is also explored, based upon the electrolytes in the reported devices accidentally mixing. It was assumed that the [Fe(CN)6]4− evolved HCN(g), and the resulting HCN(g) concentration was calculated for five sealed-environment scenarios. While [Fe(CN)6]3− is also known to decompose, it typically decomposes significantly more slowly; accounting for [Fe(CN)6]3− would double the HCN evolution values in Table 1. The colour coding in Table 1 indicates likely human outcomes based upon AEGL toxicity levels,41 with red being lethal or life-threatening, orange indicating likely irreversible health effects, yellow likely causing discomfort, and green likely no effect.
| a See Table S1† for full details. b Medium-sized car, USA: https://www.fueleconomy.gov/feg/info.shtml#sizeclasses. c Typical conference room for 80 delegates: https://www.meetings.com/Meeting-Room-Capacity-Calculator. d Typical UK flat size, calculated from the typical floor plan area, and assuming a typical room height of 2.4 m: https://www.savills.co.uk/research_articles/229130/188035-0. e Total interior volume of Airbus A320, estimated using the airplane fuselage length and width: https://www.airbus.com/aircraft/passenger-aircraft/a320-family/a320neo.html#details. |
|---|

|
What is clear from Table 1 is that as these devices evolve and become bigger, more concentrated and more powerful (cf. the maximum power column), the inherent risk inevitably increases; even if the worst case scenarios are not realised, partial HCN(g) evolution still pose major risks in confined environments. To this end, we demonstrate here how a single chemical source can be combined with relatively benign additives to generate thermogalvanic cells with both positive and negative Se(tg) values, allowing their electrical combination in-series and in-parallel, as is common in n–p-type thermoelectric devices. This was based upon an aqueous mixture of iron(II) and iron(III) sulphate with sodium sulphate or sodium hydrogen sulphate as additives. These simple additives were used to increase or decrease the degree of complexation of the metal centre with the sulphate dianion. Ultimately, in-series and in-parallel thermocell devices were prepared, and mixing of the electrolytes managed to retain thermogalvanic activity, thus leading to a ‘second life’ thermocell, making it safe and ‘unbreakable’, relative to the widely reported Fe2+/3+ + [Fe(CN)6]3−/4− analogues. Qualitative comparisons vs. the principles of green chemistry and green engineering further confirmed this.
Experimental
Chemicals
All reagents were purchased from UK suppliers and were used as received, unless otherwise specified. These were iron(II) sulphate heptahydrate (99%, Acros Organics), iron(III) sulphate (97% Acros Organics), sodium sulphate (98%, Sigma Aldrich), potassium carbonate (Santa Cruz Biotechnology) and sodium hydrogen sulphate (Sigma Aldrich).Thermogalvanic measurements
All thermoelectrochemical measurements were performed using two types of tailormade poly(methyl methacrylate) (PMMA) cells, which were made in-house; a two-chamber thermocell and a six-chamber thermocell. The two-chamber thermocell was machined from a single block of PMMA (30 mm (width) × 20 mm (height) × 8.4 mm (depth)) and has been previously reported in detail elsewhere.23 The six-chamber thermocell was machined from a larger block (30 mm (width) × 44 mm (height) × 8.4 mm (depth)). Each chamber was a 6.7 mm diameter cylinder (giving a geometric electrode surface area of 35 mm2) and giving an inter-electrode spacing of 7.4 mm. The electrodes were 10 mm diameter circles which were inserted into 0.5 mm deep lips machined around the chambers in the thermocell, and were either solid gold electrodes (1 mm thick discs with 10 mm diameter, from Surepure Chemetals, USA) or previously characterised amorphous graphite23 (cut into circles by hand).Temperature control was achieved using copper heat exchangers connected to RS-TX150 thermostatic circulator baths (Grant Instruments Ltd, UK), as previously described.23 Notably, some temperature gradients form between the isothermal water sources and the surfaces of the thermogalvanic electrode; this has been previously characterised for our cell,42 such that an applied temperature difference, ΔT, of 20 K, equates to an ‘experienced’ temperature difference of ca. 18 K. The applied (rather than experienced) temperature difference is utilised throughout this manuscript, unless explicitly stated (cf. Table S2, ESI†).
All potential, current and power measurements were performed using a Keysight B2901A Source Measure Unit and Quick IV software (Keysight, UK), were carefully measured and allowed to reach steady-state, following precisely the ‘sequence of constant voltages’ method previously reported.42
Cyclic voltammetry
Cyclic voltammetric experiments were carried out using a PGSTAT204 potentiostat with NOVA software (Metrohm, UK). The electrochemical setup was a 1.6 mm diameter Au disc working electrode, a 1.6 mm diameter Pt disc counter electrode, and an Ag/AgCl (3 M NaCl) reference electrode (all BASi, USA). All scans were recorded at a scan rate of 100 mV s−1, unless specified otherwise (Fig. S5 in the ESI† demonstrates a scan rate study of the investigated systems). The cyclic voltammetry was performed ex situ in an isothermal setup.Electrochemical impedance spectroscopy
Electrochemical impedance spectroscopy measurements were carried out using a PGSTAT204 potentiostat with NOVA software (Metrohm, UK). These were performed in situ inside the thermocell at non-isothermal temperatures, using ΔT = 20 K (Th = 40 °C; Tc = 20 °C). Impedance was performed on both gold and graphite electrodes. Typically, the hot electrode was employed as the working electrode and the cold electrode employed as the counter electrode, unless otherwise specified (cf. Fig. S6†).UV-Vis and IR spectroscopy
All spectra were obtained using solutions containing either 0.03 M of the Fe(II) sulphate or 0.03 M of the Fe(III) sulphate, in the presence or absence of 0.075 M of either NaHSO4 or Na2SO4. UV-Vis spectroscopy was performed using a Cary 100 UV-Vis and WinUV software (Agilent, UK) between 200–800 nm and with a UV-Vis crossover wavelength of 400 nm, at ambient temperature (ca. 20 °C), using quartz cuvettes with a path length of 100 μm (FireflySci, USA). IR spectroscopy was performed on the same solutions, using a droplet placed on a monolithic diamond ATR (Quest ATR Diamond accessory, Specac Ltd, UK) connected to an IRAffinity-1S Shimadzu spectrophotometer (Shimadzu, UK); results were obtained over 32 scans with a resolution of 4 cm−1.Results and discussion
Seebeck coefficient sign inversion in the iron sulphate system
Initially a stoichiometric aqueous mixture of iron(II) and iron(III) sulphate (0.3 M of each) was investigated. This mixture (abbreviated as [Fe(SO4)]) yielded an apparent Seebeck coefficient (aSe) of +0.27 mV K−1 (shown in Fig. 1; blue circle in top left). This is slightly lower than previously reported values, with three similar un-acidified solutions also reporting Se in the range of +0.29 to +0.34 mV K−1.4,16,22 This is likely due to this study using a higher concentration of [Fe(SO4)] (which will reduce the Se) and also due to not correcting the applied temperature difference to the experienced temperature difference (explained in the Experimental section). The values measured here are referred to as the ‘apparent Seebeck coefficient’ (aSe) because they are only valid for the precise temperatures used (Tc, Th and ΔT; explained in more detail below).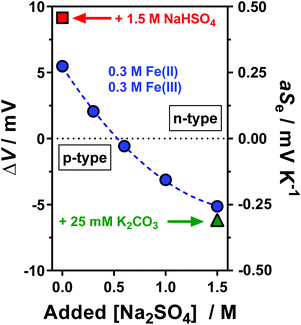 | ||
| Fig. 1 Plot of the potential difference (ΔV) generated and corresponding apparent Seebeck coefficient (aSe) when the thermocell was exposed to a temperature difference (ΔT) of 20 K. All systems contained 0.3 M Fe(II) and 0.3 M Fe(III) sulphate, with various Na2SO4 concentrations from 0 M to 1.5 M (as indicated by the x-axis), which resulted in inversion from a positive aSe (equivalent to an n-type thermoelectric) to negative aSe (p-type thermoelectric). Systems also containing either 1.5 M NaHSO4 or 25 mM K2CO3 are indicated. The temperature applied to the colder electrode, Tc, was fixed at 20 °C. All values are the average of triplicate measurements; error bars (±1 standard deviation) were smaller than the size of the data point and so are not shown. The effect of iron sulphate concentration and NaHSO4 concentration are shown in Fig. S1.† | ||
Next, acidification of the solution was explored. Acidified solutions of [Fe(SO4)] have previously been used in thermogalvanic cells.4,15,16,22 Specifically the addition of H2SO4 to [Fe(SO4)] thermocell solutions significantly increases the Se (with reported values between +0.50 and +0.90 mV K−1, depending upon concentration and pH),4,15,22 although notably this is below the Se observed for un-acidified hexaaqua Fe2+/3+ solutions (between 1.35 and 1.66 mV K−1).16,22 The Se observed for hexaaqua Fe2+/3+ solutions are also slightly increased by acidification.22 These observations have been attributed to the hexaaqua species being partially susceptible to hydrolysis (exemplified by Fe3+ in eqn (3)), whereas the un-acidified [Fe(SO4)] solutions demonstrate association of the Fe3+ with the sulphate dianion (eqn (4));16,22 this reduces the charge of the complex and hence lowers the Se.43
| [Fe(H2O)6]3+ ⇄ [Fe(H2O)5(OH)]2+ + H+ | (3) |
| [Fe(H2O)6]3+ + [SO4]2− ⇄ [Fe(SO4)(H2O)6−x]+ + xH2O | (4) |
Acidification of the hexaaqua species shifts eqn (3) to the left, whereas acidification of [Fe(SO4)] with H2SO4 is speculated to protonate the sulphate dianion (eqn (5)),22 increasing the fixed charge on the complex, and thus increasing the apparent Se.
| [Fe(SO4)(H2O)y]+ + H2SO4 + zH2O ⇄ [Fe(HSO4)(H2O)y+z]2+ + [HSO4]− | (5) |
Since H2SO4 is highly corrosive and ecologically damaging if released into the environment,44 the significantly more benign alternative sodium hydrogen sulphate (NaHSO4) was explored. Notably, sodium (Na+), hydrogen sulphate ([HSO4]−) and sulphate ([SO4]2−) ions are all naturally abundant in water sources, including tap water.22 As shown in Fig. 1, addition of 1.5 M NaHSO4 to the [Fe(SO4)] system increased the aSe from +0.27 mV K−1 to +0.50 mV K−1 (Fig. 1, red square). A concentration study demonstrated aSe increased with increasing NaHSO4 concentration (Fig. S1(d)†). While this change is not as significant as that achieved by the addition of 1 M H2SO4 (previously reaching up to +0.9 mV K−1)22 it nevertheless demonstrates a new and less potentially hazardous route of enhancing the positive Se of the [Fe(SO4)] system.
Next, the effect of Na2SO4 addition was evaluated. As shown by the trend in Fig. 1, increasing concentrations of Na2SO4 in the [Fe(SO4)] system resulted in a decrease in the aSe, so much so that the system switched from a positive aSe to a negative aSe. The solubility limit of the system was reached by 1.5 M Na2SO4, which gave an aSe of −0.29 mV K−1 (shown in Fig. 1; blue circle in bottom right). This inversion in aSe implies that the reduced species, Fe(II), now possesses a larger effective ionic charge than the oxidised species, Fe(III), such that reduction of Fe(III) to Fe(II) now occurs at the colder electrode in the thermocell. This is consistent with coordination of the iron cations with at least two [SO4]2− groups, as shown in eqn (6) and (7) for Fe(II) and Fe(III), respectively (water of hydration omitted for clarity).
| [Fe]2+ + 2[SO4]2− ⇄ [Fe(SO4)]0 + [SO4]2− ⇄ [Fe(SO4)2]2− | (6) |
| [Fe]3+ + 2[SO4]2− ⇄ [Fe(SO4)]+ + [SO4]2− ⇄ [Fe(SO4)2]− | (7) |
Whereas the positive aSe systems became more positive upon acidification, the negative aSe systems also became more negative upon addition of base, e.g. the addition of 25 mM K2CO3 increased the aSe coefficient (Fig. 1, green triangle) from −0.26 to −0.31 mV K−1. This is likely due to removal of some [HSO4]− present in the system, and thus further increasing the concentration of [SO4]2−. However, iron is known to have a rich, pH-dependent chemistry,45,46 and Fe(III) precipitates ≥pH 2.5.47 In this study, further addition beyond 1.5 M Na2SO4 and 25 mM K2CO3 resulted in rapid precipitation of the system.
The above observations are significant because they demonstrate that the Fe2+/3+ redox couple can be used as their relatively inexpensive and innocuous sulphate salts, and as-dissolved they yield a system roughly equivalent to ‘[Fe(SO4)]0/+’ (aSe = +0.27 mV K−1). Minor acidification with 1.5 M NaHSO4 increases the ‘[Fe(HSO4)]+/2+’ character of the system (aSe = +0.50 mV K−1), whereas the presence of 1.5 M Na2SO4 inverts the redox chemistry to give behaviour consistent with ‘[Fe(SO4)2]−/2−’ (aSe = −0.29 mV K−1). Thus, if these systems can thermogalvanically generate electricity they could be used to prepare ‘all-iron sulfate in-series’ thermocells. Their ability to do this was therefore investigated.
Thermogalvanic current and power properties of the iron sulphate systems
The same systems explored in Fig. 1 were measured thermogalvanically, and their current and power output quantified. The short circuit current density (jSC) produced by a single thermogalvanic cell (Fig. 2(a)) had the same trend as the aSe (cf.Fig. 1); this makes sense since the aSe is a major driving force in the current produced, as expressed by the Butler–Volmer equation.23 The maximum electrical power produced, Pmax, is given by Pmax = 0.25 × aSe × jSC, and the investigated systems displayed a clear U-like trend (Fig. 2(b)); maximum power was produced at the extremes of the system, namely those with the largest absolute aSe values, which in turn generated the larger absolute jSC values and thus even larger Pmax values. These results clearly demonstrate the various systems are able to generate electrical power via the thermogalvanic effect, but the direction and magnitude of the current flow is strongly influenced by the concentration of [SO4]2− and [HSO4]−.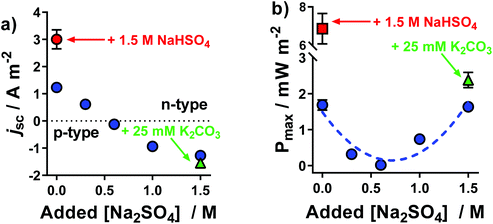 | ||
| Fig. 2 Plots of the (a) short-circuit current density, jSC, and (b) maximum power density, Pmax, generated by the thermocells as a function of Na2SO4 concentration; all experimental conditions are the same as Fig. 1. All values are the average of triplicate measurements; error bars represent ±1 standard deviation, and no error bars indicate error was equal to or smaller than the size of the data point. The effect of iron sulphate concentration and NaHSO4 concentration are shown in Fig. S1.† | ||
Temperature dependence of the thermoelectrochemistry
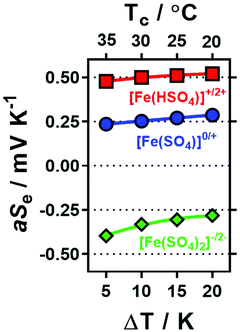
The thermogalvanic Seebeck coefficient for a system at a given concentration is generally a temperature-independent constant, which is unaffected by the temperature of the hotter electrode, the colder electrode and the temperature difference1 (within reason). However, this does not apply if there are temperature-dependent equilibria present in the system.22,48Throughout the rest of this study, three systems were exclusively investigated: one containing 0.3 M Fe(II)[SO4] and 0.3 M Fe(III)[SO4]1.5 (the ‘[Fe(SO4)]0/+’ system), and another two based upon this but in addition containing 1.5 M NaHSO4 (‘[Fe(HSO4)]+/2+’) or 1.5 M Na2SO4 (‘[Fe(SO4)2]−/2−’), respectively. Systems containing K2CO3 were not explored further, given the additional complexity it introduced for only minor benefit. The thermogalvanic Seebeck coefficients for all three systems were measured under a range of conditions, and all three were found to be temperature sensitive; in particular, they were found to be most influenced by the temperature of the colder electrode, Tc. Fig. 3 displays the measured apparent Seebeck coefficients (aSe) obtained at four different ΔT, achieved by varying Tc (Fig. S2† demonstrates the similar effect achieved when varying Th); the fact that aSe is not a constant value implies temperature-dependency, and explains why they have been referred to as ‘aSe’ rather than ‘Se’ throughout. The aSe for all three systems became more negative at higher Tc values, which is indicative of a greater tendency to form ion pairs at elevated T values. This can be rationalised by considering the water of solvation: when solvated iron cations and solvated sulphate anions ion pair, several waters of solvation could be liberated with the result that ion pairing would be more entropically favoured, and would therefore increase with increasing T.
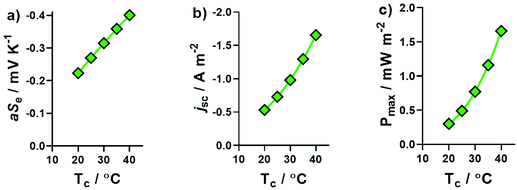
The [Fe(SO4)2]−/2− system displayed the highest degree of T sensitivity in Fig. 3, and this increased complexation at higher T values also corresponded to higher aSe values. These significant effects upon aSe also significantly affected the jSC and Pmax produced by [Fe(SO4)2]−/2− thermocells. Fig. 4(a) displays the different aSe values obtained when ΔT was fixed at 10 K, and the values of Tc and Th simultaneously changed; upon increasing Tc from 20 °C to 40 °C, the aSe value nearly doubled. This result is unusual, since typically a Se value would remain constant or near-constant over such a narrow temperature range.42 As a result, the jSC and Pmax (Fig. 4(b) and (c), respectively) also increased significantly. We have recently reported a study in the same cell assembly using 0.2 M K3[Fe(CN)6] and 0.2 M K4[Fe(CN)6]: fixing ΔT = 10 K and increasing Tc from 20 °C to 40 °C did not change Se significantly, but increased Pmax 1.6-fold, primarily due to enhanced electron transfer kinetics and ion conduction.42 This Tc effect had an even more significant effect upon the more dynamic [Fe(SO4)2]−/2− system investigated here, with aSe doubling and Pmax increasing 5.5-fold (from 0.3 mW m−2 at Tc = 20 °C to 1.66 mW m−2 at 40 °C). Unfortunately apparatus limitations prevent us pushing the temperature range even further.
Spectroscopic investigation of the various iron sulphate solutions
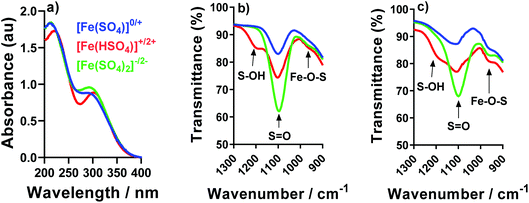
In order to probe the potential species present, IR and UV-Vis spectroscopy were used to compare the [Fe(SO4)]0/+, [Fe(HSO4)]+/2+ and [Fe(SO4)2]−/2− systems. For UV-Vis, only Fe(III) was investigated since any Fe(II) signals are typically obscured by the much stronger Fe(III) peaks;22 the solution also had to be diluted by an order of magnitude. The resulting UV-Vis spectra for all three systems are overlaid in Fig. 5; each system has two strong peaks in the ca. 220 nm and 300 nm regions, which have been previously attributed to the iron(III) hexaaqua species and the [Fe(SO4)]+ species, respectively.16,22,49 Acidification with [HSO4]− shifts the λmax of both features, consistent with a shift in equilibrium (as shown by eqn (3) and (5), respectively). Conversely, addition of [SO4]2− only resulted in a slight increase in the peak intensity attributed to the [Fe(SO4)]+ species. The UV-Vis results are therefore broadly consistent with the speculated interactions, but from these spectra we were unable to accurately determine the precise speciation.IR was also employed in an attempt to probe the speciation; in previous IR studies a [SO4]2− peak has been reported to be centred at 1100 cm−1, but is known to be highly pH-dependent between pH 1 and 3, and significantly affected by the ionic strength.47Fig. 5(b) and (c) shows the IR spectra for the Fe(II) and Fe(III) systems, respectively; both exhibit peaks at 1100 cm−1 corresponding to the asymmetric stretches of the [SO4]2− ion. All Fe-containing systems possessed small shoulders in the ca. 980 cm−1 region, which were absent from Fe-free solutions (e.g. only Na2SO4 and NaHSO4, as shown in the ESI in Fig. S3†). These features have previously been assigned to distortion of the [SO4]2− upon complexation with Fe;47 this is tentatively attributed here to the resulting Fe–O–S stretch. These shoulders/peaks which are related with Fe–O–S stretching (which is indicative of complexation of the Fe2+/3+ metal centre with [SO4]2− anions) increased for both Fe(II) and Fe(III) after the addition of Na2SO4 or NaHSO4, which is consistent with eqn (7); these features were significantly more pronounced in the Fe(III) systems. Furthermore, addition of [HSO4]− resulted in growth of a new peak at ca. 1200 cm−1, which has previously been attributed to the S–O–H stretch in the [HSO4]− ion.47
The IR results present evidence of interaction of the [SO4]2− and [HSO4]− anions with both the Fe(II) and Fe(III) cations, supporting the earlier thermogalvanic analysis which indicated complicated equilibria and interactions between species are present. However, since the above UV-Vis and IR results only yielded qualitative evidence of association, a more quantitative investigation of the thermoelectrochemical data was performed.
Thermoelectrochemical determination of speciation within the thermocell
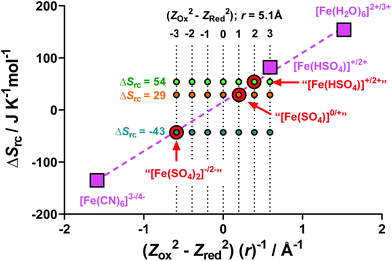
Previously, Weaver et al. have demonstrated that the difference in entropy of a simple redox couple (ΔSrc) is directly proportional to (Z2Ox − Z2Red)/r, where Z is the ionic charge of the species and r is the average ionic radius.43,50 The ΔSrc is given by the aSe, as shown by eqn (2).In order to test the validity of this model for the aqueous Fe(II)/Fe(III) redox system, the literature values of ΔSrc and (Z2Ox − Z2Red)/r were used for [Fe(H2O)6]2+/3+,22 [Fe(CN)6]3−/4−,10 and [Fe(HSO4)]+/2+,22 (values tabulated in Table S2†). These values have been plotted in Fig. 6 (pink squares), and the expected linear relationship was observed (dashed pink line).
Next, we calculated the ΔSrc for our systems, namely [Fe(SO4)]0/+, [Fe(HSO4)]+/2+ and [Fe(SO4)2]−/2− (tabulated in Table S2†). Knowing the value corresponding to the y-axis, these 3 systems were plotted on Fig. 6 (indicated by red circles) using the linear y = mx + c relationship as given by the three known and previously reported systems. From this fit, the x-axis value (i.e. (Z2Ox − Z2Red)/r) for the three systems could be estimated.
A value of 5.1 Å was estimated as r for all three systems;‡ knowing r, seven possible (Z2Ox − Z2Red) values were calculated, and these potential (Z2Ox − Z2Red)/r are shown on Fig. 6 as a 7 × 3 array. Notably, all three experimentally determined ΔSrc values fit three hypothetical (Z2Ox − Z2Red) values, corresponding to −3, +1 and +2 for the [Fe(SO4)2]−/2−, [Fe(SO4)]0/+ and [Fe(HSO4)]+/2+ systems, respectively.
The −3 and +1 scenarios correlate excellently with proposed species present in the “[Fe(SO4)2]−/2−” system (i.e. −12 to −22 = −3) and the “[FeSO4]0/+” system (i.e. +12 to 02 = +1), respectively. However, the (Z2Ox − Z2Red) = +2 scenario for the proposed “[Fe(HSO4)]+/2+” system does not correspond to any possible combination of ZOx and ZRed integers. Furthermore, the aSe for the “[Fe(HSO4)]+/2+” system generated here (using NaHSO4) is lower than the literature value reported for a [Fe(HSO4)]+/2+ system, which was achieved by acidification with a large excess of H2SO4.4,22 Therefore the “[Fe(HSO4)]+/2+” system investigated here using NaHSO4 likely has intermediate character between the [FeSO4]0/+ and [Fe(HSO4)]+/2+ systems, either as an unknown species, or more likely due to the aSe being a mixed potential corresponding to a number of distinct species in solution, e.g. [FeSO4]0/+ or [Fe(HSO4)]+/2+. This is likely due to the less acidic nature of NaHSO4, relative to H2SO4 (pKa values of H2SO4 and [HSO4]− are −3 and 1.99, respectively51).
With the speciation in the three interrogated thermocells determined, the redox chemistry of the three systems needed to be further investigated; this was performed with cyclic voltammetry and electrochemical impedance spectroscopy.
Cyclic voltammetry and electrochemical impedance spectroscopy
Cyclic voltammagrams (CVs) of the [Fe(SO4)2]−/2−, [Fe(SO4)]0/+ and [Fe(HSO4)]+/2+ systems were measured (Fig. 7). CVs of such highly concentrated and unsupported solutions (e.g. 0.6 M Fe(II)/Fe(III), with no large excess of added supporting electrolyte) leads to non-ideal responses, but is consistent with other thermoelectrochemical investigations.22 All three systems gave the expected reversible electrochemistry, although notably the [Fe(SO4)]0/+ system had a significantly larger peak-to-peak separation than the other two (following the trend [Fe(SO4)]0/+ ≫ [Fe(SO4)2]−/2− > [Fe(HSO4)]+/2+), which increased significantly with scan rate (Fig. S5†). This could have arisen due to either uncompensated resistance and/or slower electron transfer rates; electrochemical impedance spectroscopy was therefore employed to quantify these aspects.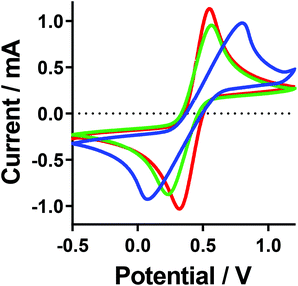 | ||
| Fig. 7 Cyclic voltammagrams recorded for the [Fe(SO4)]0/+ (blue line), [Fe(HSO4)]+/2+ (red line) and [Fe(SO4)2]−/2− (green line) systems. All recorded at ambient temperature using an Au working electrode, vs. an Ag/AgCl reference electrode, at 100 mV s−1. A table of data for the values can be found in the ESI.† | ||
Electrochemical impedance analysis was performed in situ in the thermocell, where the hot electrode was used as the working electrode, and the cold electrode as the counter and a Pt wire pseudo-reference; please note that during these measurements the cell was not generating power. These experiments were repeated with the cold electrode as the working electrode, and the same trends were observed; all impedance results can be found in the ESI.† The impedance spectra were modelled in order to determine the solution (or mass transport) resistance (RS) and electron transfer resistance (RET). Fig. 8(a) and (b) display the results for the RS and RET of the three investigated systems; both display a trend of decreasing resistance going from [Fe(SO4)]0/+ to [Fe(SO4)2]−/2− to [Fe(HSO4)]+/2+. The significantly higher RS for [Fe(SO4)]0/+ is consistent with the CVs, and the two other systems having a significantly higher ionic strength, whereas the abnormally high mobility of H+ accounts for [Fe(HSO4)]+/2+ having the lowest RS value. The trend in RET follows the same order, but is less easy to explain; further work is required to determine if this is related to speciation, the electrode surface chemistry, or due to other changes (such as in the electrochemical double layer). However, the same trend was also observed at graphite electrodes (discussed later).
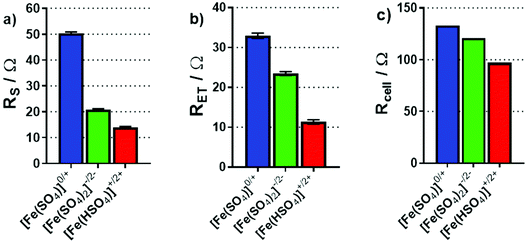 | ||
| Fig. 8 Bar charts summarising (a) the solution resistance, RS and (b) the electron transfer resistance, RET, determined through impedance spectroscopy in the non-isothermal thermocell. Also shown is (c) the calculated total thermocell resistance, Rcell of the thermogalvanic cell during steady-state discharge, based upon Ohm's Law (V = IR) from I–V plots during power production. All measurements were taken at an applied ΔT of 20 K (Tc = 20 °C). For EIS analysis, the spectra are included in the ESI,† and the fitting model has been previously reported elsewhere.22 | ||
The overall resistance of the thermocell (Rcell) during steady-state thermogalvanic discharge can also be calculated from the gradient of the I–V plots measured for the three systems (from the V = IR relationship). Fig. 8(c) plots these values, which also follow the same trend as Pmax, RS and RET. Notably, the Rcell calculated from thermogalvanic power measurements are higher than the sum of the RS and RET values, which relate to an additional mass transfer resistance of the redox active species, as well as possible changes in RS and RET during steady-state power generation; thermogalvanic cells which have achieved genuine steady-state42 possess a concentration gradient,10 given the active redox chemistry occurring at the two electrodes.
In-parallel and in-series thermocell devices
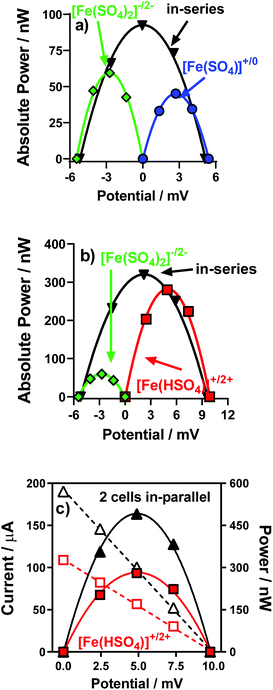
Individual thermocells can only generate a modest potential from modest temperature gradients. This is due to the limited Seebeck coefficients (in the 0.1–1.5 mV K−1 range).4,22 A solution to this is to combine several so-called n- and p-type thermocells (+ve and −ve Se values, respectively) and arrange them electrically in-series but thermally in-parallel; this increases the total potential,14–17 whilst avoiding a thermal short circuit.4 This was therefore demonstrated, initially by combining the [Fe(SO4)]0/+ and [Fe(SO4)2]−/2− systems.Fig. 9(a) displays the power curves for individual [Fe(SO4)]0/+ and [Fe(SO4)2]−/2− thermocells, as well as the power curve generated when combined in-series. The generated potential was nearly the sum of the two potentials, as expected; it reached only 95% of the sum due to the increased resistance of the thermocell due to the additional electrical connections.4 While the overall power output can in theory be doubled by connecting thermocells in series,4 here total Pmax increased only by a factor of 1.9 (rather than 2.0) due to the internal resistance mentioned above.
Next, the same was performed but with the [Fe(HSO4)]+/2+ and [Fe(SO4)2]−/2− thermocells; these two have a significantly bigger discrepancy in Pmax, as shown in Fig. 9(b). Despite this, the potential output still essentially doubled (97% of the sum), while the overall Pmax was 94% of the sum of two Pmax (a factor of 1.1 with respect to [Fe(HSO4)]+/2+, but a factor of 5.4 with respect to [Fe(SO4)2]−/2−). This demonstrated how these systems could be combined to significantly increase the voltage produced by thermocell devices, and also increase the overall power output.
Given that for in-series thermocells the overall current output cannot exceed the current of a single thermocell, connection electrically in-parallel is also useful.4 This serves to reduce the internal resistance, and potentially double the overall current output (once again potentially doubling the overall Pmax output). This was evaluated for the [Fe(HSO4)]+/2+ thermocells; Fig. 9(c) displays the power curve for one individual [Fe(HSO4)]+/2+ thermocell and for two connected electrically in-parallel; the overall current increased by a factor of 1.8, thus boosting the overall Pmax by a similar factor.
Towards ‘unbreakable’ thermocells for thermal energy harvesting
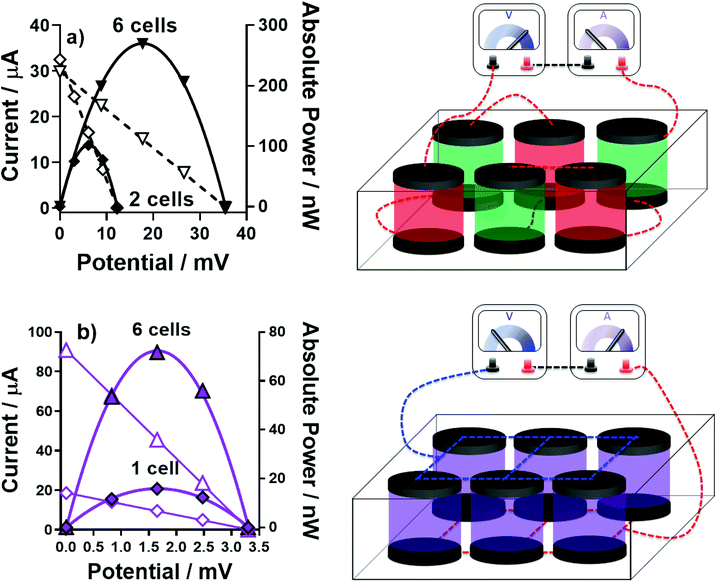
A device was prepared comprising of 6 thermocells (full details in Experimental) in order to further boost the overall power by combining in-series 3 pairs of n-type and p-type thermocells. Following on from the results discussed above, an ‘all-FeSO4-based’ thermocell was prepared containing [Fe(HSO4)]+/2+ and [Fe(SO4)2]−/2−; we were also able to explore the implications of the ‘accidental’ mixing of the two types of electrolytes in the device, without risk. This device now employed 12 graphite electrodes, since 12 gold electrodes were not available.Fig. 10(a) displays the power curves generated for a 2-cell device (one [Fe(HSO4)]+/2+ and one [Fe(SO4)2]−/2− in-series) and for a 6-cell device (three [Fe(HSO4)]+/2+ and three [Fe(SO4)2]−/2− in-series; this is shown visually in Fig. 10(a)). As expected, the potential and power essentially tripled. Notably, the absolute power from these devices are slightly lower than those discussed above, because this larger device used graphite electrodes, whereas gold was used for the investigations above; gold was a better electrocatalyst for the [Fe(HSO4)]+/2+ system (as demonstrated by RET measurements; Fig. S6†).
Next, the implication of a leak resulting in complete electrolyte mixing was explored. Combining [Fe(HSO4)]+/2+ and [Fe(SO4)2]−/2− results in a single solution with 0.3 M iron(II) sulphate, 0.3 M iron(III) sulphate, 0.75 M NaHSO4 and 0.75 M Na2SO4. Overall, this gave an aSe of +0.19 mV K−1 (ΔT = 20 K, Tc = 20 °C); the thermogalvanic characterisation of this electrolyte is further discussed in the ESI (Fig. S8–S10†). Therefore complete mixing throughout the device will result in a still-viable thermoelectrochemically-active electrolyte; however, since all 6 cells are now n-type, they cannot be operated in-series.
Fig. 10(b) displays the power curves generated by 1-cell containing the mixed electrolyte, and the 6-cell device when the electrodes were all connected to make it an electrically in-parallel device; this was achieved simply by placing a sheet of graphite either side to connect all of the individual graphite electrodes. Whereas the potential output remained largely unchanged upon connecting in-parallel, the overall power was significantly boosted because of overall current was increased by a factor of 4.5.
These results indicate how two iron sulphate electrolytes can be safely used in close proximity to generate electrically in-series thermocell devices. They also demonstrate an ‘unbreakable’ property of the system; when mixed, the electrolyte and overall device retain functionality, providing the electrical wiring is adjusted (in an easily achieved manner). This enables a ‘second life’ for the electrolyte and device; ‘second life’ processes are currently facilitating sustainable business models and practises in the battery industry.52
Assessing the sustainability of the all-FeSO4 thermocells
In order to explore the broader green and sustainable aspects of the all-FeSO4 thermocells, they were compared against the extensively-utilised thermocell combination of inherently acidic Fe2+/3+ thermocells in-series with [Fe(CN)6]3−/4− thermocells. This was done using the applicable principles taken from the 12 Principles of Green Chemistry53 and the 12 Principles of Green Chemical Engineering.54 From these, six broad areas were identified, covering 12 principles in total; these are compared in Table 2. Comparison was based upon assuming equivalently sized thermocell devices, and the implications of their efficacy during use, and outcomes if the electrolytes were accidentally mixed and/or released into the environment.| Principles of Green Chemistry (GC) & Green Engineering (GE) (adapted from ref. 53 and 54) | HCl-acidified FeClO4 and K3/[NH4]4[Fe(CN)6] in-series thermocell (exemplified by ref. 16) | All-FeSO4 in-series thermocell (this work) | ||
|---|---|---|---|---|
| – Minimise material diversity (GE 9) |

|
7 elements/ molecules; complexity lost on mixing (Fe2+/3+, H+, K+, (NH4)+, [ClO4]−, Cl−, [Fe(CN)6]3−/4−) |

|
4 elements/ molecules; complexity retained on mixing (Fe2+/3+, Na+, [HSO4]−, [SO4]2−) |
| – Conserve complexity (GE 6) | ||||
| – Designing safe chemicals (GC 4) |

|
Individually safe, hazardous if mixed; [Fe(CN)6]4− harmful to aquatic life (long lasting effects) |

|
Safe, both individually and mixed |
| – Safer chemistry for accident prevention (GC 12) | ||||
| – Inputs/outputs inherently non-hazardous (GE 1) | ||||
| – Design for degradation (GC 10) |

|
Biodegradable or already elemental |

|
Biodegradable or already elemental |
| – Durability vs. Immortality (GE 7) | ||||
| – Design for commercial ‘afterlife’ (GE 11) |

|
Mixing cannot be reversed; results in ‘end-of-life’ |

|
Mixing enables ‘second life’ of thermocell |
| – Waste prevention (GC 1) |

|
Insoluble and toxic waste generated if mixed |

|
‘Second life’ can prevent waste |
| – Waste prevention instead of treatment (GE 2) | ||||
| – Design energy efficiency (GC 6) |

|
S e = 1.7 + 1.3 mV K−1 |

|
aS e = 0.5 + 0.3 mV K−1 |
| – Maximise efficiency (GE 4) | = 3.0 mV K−1 | = 0.8 mV K−1 | ||
| Total number of rows thermocell is superior in | 2 | 5 | ||
Broadly, the complexity of the HCl-acidified Fe2+/3+ + [Fe(CN)6]3−/4− in-series thermocell is a detrimental aspect, as is the irreversible and potentially fatal nature of the side-reactions which can occur if they are heated and mixed. The main redeeming factor is that this system has a significantly higher Se, which typically directly correlates with its efficiency at thermogalvanic heat-to-electricity conversion.20 In the case of the all-FeSO4 thermocell, its simplicity and its ability to have a ‘second life’ as a safe but thermoelectrochemically active electrolyte post-mixing results in it being a comparatively more green and sustainable system. While Table 2 focuses solely upon the latest publication16 from Table 1, all reports in Table 1 share similar features (e.g. complex, harmful components which are hazardous if mixed, but all also provide higher Se values with summed values between 1.5 and 3.2 mV K−1). What is required now for the all-FeSO4 thermocell is further research in order to boost the thermogalvanic efficiency and power of such systems, to enable even more effective ‘waste heat-to-electricity’ conversion opportunities. To achieve this, dynamic systems such as those demonstrated here need to be harnessed, but achieve even greater (Z2Ox − Z2Red)/r values.
Conclusions
In this study it was demonstrated how an inversion of the Seebeck coefficient (Se) could be achieved in an all-iron-sulphate thermogalvanic system, to achieve the equivalent of both the n-type and p-type systems common to thermoelectric devices. While the Se of aqueous iron(II/II) sulphate solutions (Se = ca. +0.3 mV K−1) and their acidified analogues (Se = ca. +0.9 mV K−1) have been previously reported, we report here that much milder acidification can be achieved with NaHSO4, while still almost doubling the Se to +0.57 mV K−1. Conversely, it was demonstrated for the first time that Na2SO4 can be added to invert the entropic direction of the thermogalvanic process in the p-type direction, with a Se of −0.4 mV K−1 easily achieved. It was further demonstrated how these two novel systems can be combined electrically in-series, to additively boost the Se of the combined device, and thus increase overall thermogalvanic power output. For example, combining 2-cells in-series generated 97% of the sum of the power of the individual cells; moving from 2-cells to 6-cells essentially tripled the power output.These all-iron-sulphate thermogalvanic systems are less powerful than the comparatively more investigated Fe2+/3+ and [Fe(CN)6]3−/4− thermocells, as demonstrated clearly by their combined Seebeck coefficients being ca. 25% of the ‘state-of-the-art’ value14 (0.8 vs. 3.2 mV K−1, respectively). However, research into the aforementioned systems has not focussed upon introducing any safer thermocells or combinations to reduce the potential hazards; existing reports instead contain an inherent risk of hydrogen cyanide gas release. It was clearly demonstrated here that mixing of the all-iron-sulphate thermogalvanic electrolytes could occur safely, and even retain functionality as a mixed electrolyte system (Se = +0.19 mV K−1) thus demonstrating a potential ‘second life’ application of this system.
The novel iron(II/III) sulphate systems presented here are proposed as more benign alternatives to the conventional Fe2+/3+ and [Fe(CN)6]3−/4− thermocells, which are potentially lethal if combined. The thermoelectrochemically quantified ΔSrc values for the thermocells also allowed a detailed and quantitative analysis of the speciation. This could be employed in the future to probe other concentration-dependent transitions, and potentially those triggered by pH, solvent, etc. This study also highlights the need to carefully consider the ‘what if’ aspects of thermocells, including their potential for mixing, and their ‘end-of-life’ and even ‘second life’ possibilities.
Conflicts of interest
The authors have no conflicts of interest to declare.Acknowledgements
M. A. B. acknowledges the EPSRC for funding (Standard Research Studentship (DTP), EP/N509498/1).References
- T. I. Quickenden and Y. Mua, J. Electrochem. Soc., 1995, 142, 3985–3994 CrossRef.
- Fitriani, R. Ovik, B. D. Long, M. C. Barma, M. Riaz, M. F. M. Sabri, S. M. Said and R. Saidur, Renewable Sustainable Energy Rev., 2016, 64, 635–659 CrossRef.
- L. B. Kong, T. Li, H. H. Hng, F. Boey, T. Zhang and S. Li, Waste Energy Harvesting, 2014, vol. 24 Search PubMed.
- M. Al Maimani, J. J. Black and L. Aldous, Electrochem. Commun., 2016, 72, 181–185 CrossRef.
- A. Montecucco, J. Siviter and A. R. Knox, Appl. Energy, 2014, 123, 47–54 CrossRef.
- C. B. Vining, Nat. Mater., 2009, 8, 83–85 CrossRef CAS PubMed.
- Endangered Elements, https://www.acs.org/content/acs/en/greenchemistry/research-innovation/endangered-elements.html.
- G. Tan, L. D. Zhao and M. G. Kanatzidis, Chem. Rev., 2016, 116, 12123–12149 CrossRef CAS PubMed.
- J. Wu, J. J. Black and L. Aldous, Electrochim. Acta, 2017, 225, 482–492 CrossRef CAS.
- B. Burrows, J. Electrochem. Soc., 1976, 123, 154–159 CrossRef CAS.
- T. I. Quickenden and C. F. Vernon, Sol. Energy, 1986, 36, 63–72 CrossRef.
- S. G. Bratsch and J. Phys, Chem. Ref. Data, 1989, 18, 1–21 CrossRef.
- J. J. Black, T. Murphy, R. Atkin, A. Dolan and L. Aldous, Phys. Chem. Chem. Phys., 2016, 18, 20768–20777 RSC.
- J. H. Kim, J. H. Lee, R. R. Palem, M. S. Suh, H. H. Lee and T. J. Kang, Sci. Rep., 2019, 9, 8706 CrossRef PubMed.
- L. Zhang, T. Kim, N. Li, T. J. Kang, J. Chen, J. M. Pringle, M. Zhang, A. H. Kazim, S. Fang, C. Haines, D. Al-Masri, B. A. Cola, J. M. Razal, J. Di, S. Beirne, D. R. MacFarlane, A. Gonzalez-Martin, S. Mathew, Y. H. Kim, G. Wallace and R. H. Baughman, Adv. Mater., 2017, 29, 1605652 CrossRef PubMed.
- K. Kim, S. Hwang and H. Lee, Electrochim. Acta, 2020, 335, 135651 CrossRef.
- P. Yang, K. Liu, Q. Chen, X. Mo, Y. Zhou, S. Li, G. Feng and J. Zhou, Angew. Chem., Int. Ed., 2016, 55, 12050–12053 CrossRef PubMed.
- H. Jia, Z. Ju, X. Tao, X. Yao and Y. Wang, Langmuir, 2017, 33, 7600–7605 CrossRef.
- Y. Liang, J. K. H. Hui, T. Yamada and N. Kimizuka, ChemSusChem, 2019, 12, 4014–4020 CrossRef PubMed.
- L. Aldous, J. J. Black, M. C. Elias, B. Gélinas and D. Rochefort, Phys. Chem. Chem. Phys., 2017, 19, 24255–24263 RSC.
- J. Duan, B. Yu, K. Liu, J. Li, P. Yang, W. Xie, G. Xue, R. Liu, H. Wang and J. Zhou, Nano Energy, 2019, 57, 473–479 CrossRef.
- M. A. Buckingham, F. Marken and L. Aldous, Sustainable Energy Fuels, 2018, 2, 2717–2726 RSC.
- M. A. Buckingham, S. Hammoud, H. Li, C. J. Beale, J. T. Sengel and L. Aldous, Sustainable Energy Fuels, 2020, 4, 3388–3399 RSC.
- C. A. P. Arellano and S. S. Martínez, Sol. Energy Mater. Sol. Cells, 2010, 94, 327–332 CrossRef.
- S. Asperger, Trans. Faraday Soc., 1952, 48, 617–624 RSC.
- S. Asperger, I. Murati and D. Pavlovic, J. Chem. Soc., 1953, 730–736 Search PubMed.
- J. M. Kruse and L. E. Thibault, Anal. Chem., 1973, 45, 2260–2261 CrossRef.
- P. L. Domingo, B. Garcia and J. M. Leal, Can. J. Chem., 1990, 68, 228–235 CrossRef CAS.
- H. Basset and A. S. Corbet, J. Chem. Soc. Trans., 1924, 1358–1366 RSC.
- A. S. Brar, H. S. Sandhu and H. S. Sandhu, Thermochim. Acta, 1980, 41, 253–256 CrossRef CAS.
- A. S. Brar, H. S. Sandhu and S. S. Sandhu, J. Therm. Anal., 1983, 26, 7–15 CrossRef CAS.
- A. S. Brar, H. Singh, S. Brar and B. S. Randhawa, J. Therm. Anal., 1981, 21, 77–88 CrossRef CAS.
- J. I. Kunrath, C. S. Müller and E. Frank, J. Therm. Anal., 1978, 14, 253–264 CrossRef CAS.
- M. Ruiz-Bermejo, C. Rogero, C. Menor-Salván, S. Osuna-Esteban, J. Á. Martín-Gago and S. Veintemillas-Verdaguer, Chem. Biodivers., 2009, 6, 1309–1322 CrossRef CAS PubMed.
- A. C. L. Câmara and B. Soto-Blanco, Cyanide poisoning in animals and humans, Cyanide: Occurrence, Characteristics and Applications, ed. B. Soto-Blanco, Nova Science Publishers, Inc., 2013, pp. 23–46 Search PubMed.
- F. Musshoff, K. M. Kirschbaum and B. Madea, Forensic Sci. Int., 2011, 204, e4–e7 CrossRef CAS PubMed.
- A. H. Hall and B. H. Rumack, Ann. Emerg. Med., 1986, 15, 1067–1074 CrossRef CAS PubMed.
- H. A. H. Alzahrani, M. A. Buckingham, F. Marken and L. Aldous, Electrochem. Commun., 2019, 102, 41–45 CrossRef CAS.
- Sigma-Aldrich, Potassium ferricyanide(III) – SDS, https://www.sigmaaldrich.com/MSDS/MSDS/DisplayMSDSPage.do?country=GB&language=en&productNumber=702587&brand=SIGALD&PageToGoToURL=https%3A%2F%2Fwww.sigmaaldrich.com%2Fcatalog%2Fsearch%3Fterm%3DPotassium%2Bferricyanide%26interface%3DAll%26N%3D0%26mode%3Dpar, (accessed 18 May 2020).
- Sigma-Aldrich, Potassium hexacyanoferrate(II) trihydrate – SDS, https://www.sigmaaldrich.com/MSDS/MSDS/DisplayMSDSPage.do?country=GB&language=en&productNumber=P3289&brand=SIGALD&PageToGoToURL=https%3A%2F%2Fwww.sigmaaldrich.com%2Fcatalog%2Fsearch%3Fterm%3Dpotassium%2Bferrocyanide%26interface%3DAll%26N%3D0%26mode%3Dpart, (accessed 18 May 2020).
- Hydrogen Cyanide, https://www.cdc.gov/niosh/ershdb/emergencyresponsecard_29750038.html, (accessed 18 May 2020).
- M. A. Buckingham and L. Aldous, J. Electroanal. Chem., 2020 DOI:10.1016/j.jelechem.2020.114280.
- J. T. Hupp and M. J. Weaver, Inorg. Chem., 1984, 23, 3639–3644 CrossRef CAS.
- L. L. Trent, R. S. Hestand and C. C. Carter, J. Aquat. Plant Manage., 1978, 16, 40–43 CAS.
- N. N. Greenwood and A. Earnshaw, Chemistry of the Elements, Pergamon Press Ltd., Leeds, 1984 Search PubMed.
- R. J. Lemire, U. Berner, C. Musikas, D. A. Palmer, P. Taylor and O. Tochiyama, Chemical thermodynamics of iron Part 1, OECD, 2013, vol. 13a Search PubMed.
- J. Majzlan and S. C. B. Myneni, Environ. Sci. Technol., 2005, 39, 188–194 CrossRef PubMed.
- E. H. B. Anari, M. Romano, W. X. Teh, J. J. Black, E. Jiang, J. Chen, T. Q. To, J. Panchompoo and L. Aldous, Chem. Commun., 2016, 52, 745–748 RSC.
- F. J. Millero, W. Yao and J. Aicher, Mar. Chem., 1995, 50, 21–39 CrossRef.
- J. T. Hupp and M. J. Weaver, J. Phys. Chem., 1984, 88, 1860–1864 CrossRef.
- D. H. Ripin and D. A. Evans, pKa's of Inorganic and Oxo-Acids, 2005 Search PubMed, http://evans.rc.fas.harvard.edu/pdf/evans_pKa_table.pdf (accessed 2020).
- N. Jiao and S. Evans, Procedia CIRP, 2016, 40, 250–255 CrossRef.
- P. Anastas and J. Warner, Green Chemistry: Theory and Practice, Oxford University Press, Oxford [England], 2000 Search PubMed.
- P. T. Anastas and J. B. Zimmerman, Environ. Sci. Technol., 2003, 37, 94A–101A CrossRef PubMed.
Footnotes |
| † Electronic supplementary information (ESI) available. See DOI: 10.1039/d0gc01878c |
| ‡ The ionic radius of the species (r) was calculated from the ionic radius of the ions and postulated species present. This calculation is fully discussed in the ESI,† along with a demonstration of the effect of changing r for the determination of the species present in the system. |
| This journal is © The Royal Society of Chemistry 2020 |

