Charge transfer from perovskite oxide nanosheets to N-doped carbon nanotubes to promote enhanced performance of a zinc–air battery†
Rahul
Majee
,
Surajit
Mondal
and
Sayan
Bhattacharyya
 *
*
Department of Chemical Sciences, and Centre for Advanced Functional Materials, Indian Institute of Science Education and Research (IISER) Kolkata, Mohanpur 741246, India. E-mail: sayanb@iiserkol.ac.in
First published on 9th June 2020
Abstract
Room temperature engineered spatially connected p-type double perovskite oxide (BaPrMn1.75Co0.25O5+δ, BPMC) nanosheets (NSs) with n-type nitrogen-doped multi-walled carbon nanotubes (NCNTs) show significant enhancement in bifunctional oxygen electrocatalytic activity. The optimization of the donor level by charge transfer from the perovskite to NCNTs is demonstrated to be a prodigious approach to facilitate redox oxygen activation. A proof-of-concept rechargeable zinc–air battery (ZAB) with BPMC containing a 10 wt% NCNT (BPMC/NCNT-10) cathode demonstrates the highest specific discharge capacity of 789.2 mA h gZn−1 and cyclic stability for 85 h at a current density of 5 mA cm−2.
Electrochemical energy storage mediated by chemical bonds is one of the most promising headways towards renewable energy progress,1 which has spurred the research on alternative electrochemical storage systems such as metal–air batteries.2 The zinc–air battery, in particular, has the advantages of safe aqueous chemistry and high volumetric density, which is a prime determinant during mobile operations.3 However, their commercialization prospects are limited by impediments in oxygen electrocatalysis at the cathode.4 This has triggered major efforts to develop bifunctional catalysts for the air electrode to drive oxygen evolution and reduction reactions (OER and ORR) for successive charging and discharging, respectively. Aside from endeavors involving precious noble metals, transition metal oxides or nitrides and carbon nanomaterials,5,6 ABO3-type (A = rare earth; B = transition metal) perovskite oxides are one of the most studied candidates for driving electrocatalytic OER and ORR in alkaline medium.7 In perovskite oxides, oxygen activation is facilitated by inherent oxygen vacancies mostly at the catalyst surface.8 Notably, double perovskite oxides with the general formula A2B2O5+δ, which have a layered structure and elevated oxygen vacancies, show better oxygen activation, oxide transportation and operational stability of their chemical structure in comparison to their ABO3 counterparts.9–12
Nonetheless, the high temperature synthesis of double perovskite oxide results in large grains with poor electronic conductivity.12 Even alternative procedures, such as electrospinning and spray pyrolysis,13,14 are unable to address the low conductivity that thwarts the intrinsic catalytic activity.15 Therefore, external conducting agents such as carbon black and acetylene black are inevitably added to maximize the activity.15–20 However, these additives increase undesired peroxide formation and engender instability under oxidative bias, thereby causing ohmic loss.21,22 Additionally, the anticipated carbon oxidation at the cathode disrupts charge percolation, and device performance is compromised during charging of the battery.23 To address this challenge, spatial connection of the carbon nanostructure with dimensionally confined double perovskite oxide is anticipated to have enormous potential in achieving efficient and durable bifunctional oxygen electrocatalysis.22
Herein, we present a robust strategy consisting of a composite of p-type BPMC NSs with n-type NCNTs, obtained by room temperature processing. With 10 wt% NCNTs, a significant drop in overpotential (η) is observed: 174 mV in ORR at −1 mA cm−2 and 62 mV in OER at a current density of 10 mA cm−2. Charge transfer from BPMC to NCNTs optimizes the Fermi energy levels for facile reaction kinetics. The rechargeable ZAB with BPMC/NCNT-10 cathode demonstrates specific discharge capacity of 789.2 mA hgZn−1 and 85 h cyclic stability at 5 mA cm−2.
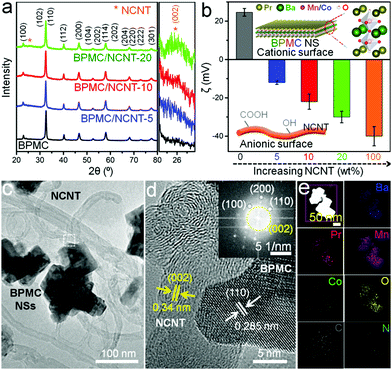
The synthesis of BPMC NSs was accomplished through glycine–nitrate sol–gel method followed by 950 °C, 5 h air calcination and 5% H2 in Ar reduction at 750 °C for 5 h (Experimental section, ESI†). With an optimized Co concentration of 12.5 wt%, the A-site ordered tetragonal (P4/mmm) phase of BPMC (Fig. 1a) has an anticipated oxygen vacancy (δ) of 0.09, estimated from Rietveld refinement of the powder X-ray diffraction (PXRD) pattern (Fig. S1 and Table S1, ESI†). This was duly corroborated by iodometric titration. On average, 5 unit cells are stacked along the crystallographic c-axis, resulting in the NS thickness of 4.1 nm (Fig. S2, ESI†). On the other hand, the NCNTs prepared from commercially available multi-walled CNTs have a partial graphitic nature with an ID/IG ratio of 1.06, elucidated by Raman spectroscopy (Fig. S3, ESI†). Zeta potential (ζ) analysis shows a positively charged BPMC surface (ζ = +24 mV) attributed to the oxygen depleted PrOx-terminated surface (Fig. 1b). On the contrary, NCNT has a negatively charged surface of −40 mV originating from partial surface oxidation during chemical processing. The electrostatic interaction between the spatially connected BPMC and NCNTs progressively increases the resultant ζ towards negative values with the increase in the NCNT wt% of the composite (Fig. 1b). Taking advantage of the complementary surface charges, our robust approach is based on room temperature engineering of the composite by simply stirring a mixture of BPMC NSs and NCNTs. The interconnectivity between BPMC and NCNTs was validated by transmission electron microscopy (TEM). The BPMC NSs were found to have lateral dimensions of 70 to 150 nm and the NS surfaces mainly comprise (110) and (100) lattice planes (Fig. S4a, ESI†). The ∼2 μm long NCNTs have diameters ranging from 20 to 50 nm, and the walls exhibit a semi-graphitic character with (002) lattice fringes (Fig. S4b, ESI†). Interconnectivity between the components can be minimized either by using too few NCNTs (5 wt%; BPMC/NCNT-5), where NS clusters are observed, or with a higher NCNT content (20 wt%; BPMC/NCNT-20), where NCNTs themselves agglomerate (Fig. S5, ESI†). An optimized distribution of the components in BPMC/NCNT-10 is shown in Fig. 1c. The high-resolution TEM (HRTEM) image (Fig. 1d) shows a continuous interface between the NS and NCNT, implying the possibility of facile interfacial charge percolation between the NS and NCNT. A fast Fourier transform (FFT) pattern at the BPMC/NCNT junction (Fig. 1d inset) displays the evident crystallinity of the interface, with diffraction spots from both the NS and NCNT. Elemental mapping obtained by high-angle annular dark-field scanning TEM (STEM-HAADF) shows the uniform distribution of the constituent elements (Fig. 1e), while energy dispersive spectroscopy (EDS) elucidates the relative abundance of different elements (Table S2, ESI†). The amount of N in the NCNTs was estimated from both EDS and CHN analysis as 0.05 ± 0.02 wt%.
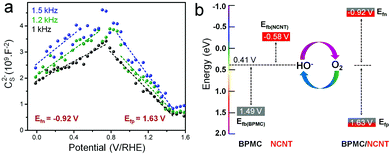
To elucidate the charge transfer propensities between BPMC and NCNT, Mott–Schottky measurements were performed for all BPMC/NCNT composites along with pure BPMC NSs and NCNTs. The measurements demonstrate p-type BPMC and n-type NCNT semiconductor characteristics with flat band potentials (Efb) of 1.49 and −0.58 V, respectively (Fig. S6a and b, ESI†).24 When interconnected, BPMC/NCNT p–n junctions are created (Fig. 2a and Fig. S6c,d, ESI†), where charge transfer from BPMC to NCNTs shifts the flat band energy of BPMC and NCNTs towards more positive and negative values, respectively (Fig. S7 and Table S3, ESI†). Despite having NS clusters, BPMC/NCNT-5 exhibits the most prominent charge transfer, with n- and p-type Efb values of −1.06 (Efn) and 1.79 V (Efp), respectively. The decrease in the interaction cross-section between BPMC and NCNTs, due to increased NCNT agglomeration at higher wt% (Fig. S5c, ESI†), gradually reduces the extent of charge transfer. Oxygen reduction is supposedly facilitated by the elevation of charge density in NCNTs, which shifts its Efn towards more negative values, i.e. higher energy (Fig. 2b).25 Likewise, the depletion of charge density in BPMC (more positive Efp) facilitates the electro-oxidation reaction. Hence, an optimum Efb is needed to benefit both reactions, since energy optimization is a better guiding factor to manipulate redox activity than to achieve maximum charge transfer. BPMC/NCNT-10, with an optimized Efn of −0.92 eV and Efp of +1.63 V, shows the perfect balance for redox oxygen activation. The Mott–Schottky results are also corroborated by infrared spectral analysis, which shows a lower frequency shift of the stretching mode of BO6 octahedra from 608 cm−1 for BPMC to 596 to 590 cm−1 for BPMC/NCNT-10 and BPMC/NCNT-5, respectively (Fig. S8, ESI†). The shift is attributed to the weakening of Mn–O/Co–O bonds due to prominent charge transfer from BPMC to NCNT, which depletes the relative charge density of the O 2p band.26 When the NCNTs tend to agglomerate at higher concentrations, this band experiences a lower shift because of reduced charge transfer.
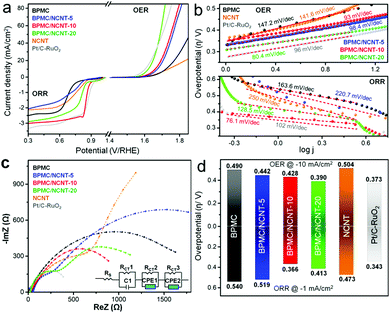
In 1 M KOH electrolyte, BPMC exhibits better OER activity than NCNT, while the composites outperform both (Fig. 3a). BPMC/NCNT-20 demonstrates the best OER performance, with η of 390 mV at 10 mA cm−2, and even surpasses state-of-the-art RuO2 at high current densities. For BPMC/NCNT-10 and BPMC/NCNT-5, η increases by 38 and 52 mV, respectively, at the same current density. The ease of reaction kinetics elucidated from the Tafel slopes is found to follow a similar trend as that of η (Fig. 3b). The Tafel slope values are 80.4, 93 and 98.4 mV dec−1 for BPMC/NCNT-20, BPMC/NCNT-10 and BPMC/NCNT-5, respectively. Electrochemical impedance spectral (EIS) analyses at 1.68 V versus a reversible hydrogen electrode (RHE) demonstrate charge transfer resistance (RCT) values of 7.22, 21.4 and 23.4 Ω for BPMC/NCNT-20, BPMC/NCNT-10 and BPMC/NCNT-5, respectively (Fig. S9, ESI†). Unlike OER, the ORR performance presents an intriguing trend, missing a direct correlation. The LSV plots in Fig. 3a reveal BPMC/NCNT-10 as the best performing ORR catalyst with η of 366 mV at −1 mA cm−2, which is 174, 153 and 47 mV lower than that of bare BPMC, BPMC/NCNT-5 and BPMC/NCNT-20, respectively. While BPMC exhibits a large limiting current density due to facile oxygen activation,9 the activity of BPMC/NCNT-5 worsens to the level of NCNTs at higher current density. The favorable O2 activation kinetics of BPMC/NCNT-10 is evident from its lower η compared to the benchmark 20% Pt/C and more so by the significantly smaller Tafel slope of 76.1 mV dec−1 compared to 102 mV dec−1 for Pt/C-RuO2 (Fig. 3b). The other BPMC/NCNT catalysts have higher Tafel slopes attributed to their sluggish ORR kinetics. The Nyquist plots corroborate this ORR trend from the estimated RCT values of 2.84, 1.55, 1.56, 2.71 and 3.45 kΩ for BPMC/NCNT-5, BPMC/NCNT-10, BPMC/NCNT-20, BPMC and NCNTs, respectively (Fig. 3c and Table S4, ESI†). Despite having weaker ORR performance, BPMC/NCNT-20 has a similar RCT to that of BPMC/NCNT-10, due to a significantly lower electrical resistance of 65.5 Ω in the former with higher NCNT content than 173.7 Ω in the latter (Fig. S10, ESI†). The increase of NCNT content also increases the electrochemically active surface area (ECSA) reflected by the double-layer charge capacitance (Cdl) (Fig. S11, ESI†). The Cdl values obtained are 0.1, 0.67, 1.43 and 1.94 mF for BPMC, BPMC/NCNT-5, BPMC/NCNT-10 and BPMC/NCNT-20, respectively. The intrinsic activity was suitably evaluated from ECSA-normalized LSV plots, which eliminate extrinsic factors such as NCNT-induced electronic conductivity, and thereby demonstrate pristine BPMC as the best OER/ORR catalyst (Fig. S12, ESI†). This normalized, nonlinear trend once again highlights the critical role of energy optimization, whereby OER is facilitated by a low-lying Efp in BPMC/NCNT-20 and BPMC/NCNT-5, and ORR activity is enhanced by the optimized Efb in BPMC/NCNT-10.
The bifunctionality index (BI) was estimated by combining the η values of OER and ORR at 10 and −1 mA cm−2, respectively (Fig. 3d). BPMC/NCNT-10 shows the lowest BI of 794 mV, while this value is 9 mV higher for BPMC/NCNT-20. A lower BI of BPMC/NCNT systems make them potential candidates for redox oxygen activation. Moreover, a rotating ring disk electrode (RRDE) experiment shows 3.8 electron transfer (n) kinetics for BPMC/NCNT-10, while it is 3.2 for BPMC/NCNT-20 (Fig. S13a and b, ESI†). The formation of H2O2 is <10% in the case of BPMC/NCNT-10 in comparison to 25% H2O2 formation for BPMC/NCNT-20 (Fig. S13c, ESI†). The lowest BI, high electron transfer and low H2O2 formation of BPMC/NCNT-10 is in accordance with the optimized Efn and Efp with respect to the ORR standard reduction potential of 0.41 V in alkaline medium (Fig. 2b). For BPMC/NCNT-5, the high Efn is counteracted by a suppressed Efp, which worsens the ORR activity (Fig. S14, ESI†). Since low-lying energy states favor OER activity by electron transfer from the reaction medium, BPMC/NCNT-20 offers the best OER activity, whereas the ORR activity is affected by the low-lying Efn. In addition to earlier experimental and computational predictions on interfacial charge reorganizations between an electrocatalyst and its carbon additive,32,33 our Mott–Schottky analyses have been able to decipher the in situ charge transfer process, which aids in optimizing the concentration of NCNTs. Chronopotentiometric (CP) stability tests performed with BPMC/NCNT-10 at 10 and −1 mA cm−2 demonstrate no apparent increase in the applied potential, revealing its outstanding durability under operating conditions (Fig. S14, ESI†). Post CP, the OER/ORR activation regions remain almost unchanged, although the high potential side in the LSV plots shows leaching of catalyst ink over time.
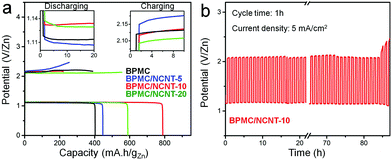
The bifunctional ability of the BPMC/NCNT catalysts was tested in homemade rechargeable ZAB (Fig. S15a, ESI†). At 10 mA cm−2, the polarization curves demonstrate charge/discharge voltage gaps of 1.02, 1.05, 1.15 and 1.14 V, for BPMC/NCNT-10, BPMC/NCNT-20, BPMC/NCNT-5 and BPMC, respectively (Fig. S15b, ESI†). This is in good agreement with the observed half-cell OER and ORR activity. The power density (P) calculated from discharge polarization plots is the highest: 51.7 mW cm−2 at 91.1 mA cm−2 for BPMC/NCNT-10, while P is 41.2, 37.7 and 32.8 mW cm−2 for BPMC/NCNT-20, BPMC/NCNT-5 and BPMC, respectively (Fig. S15b inset, ESI†). Specific capacities are estimated at 5 mA cm−2 and discharge capacities are 789.2, 586.7, 446.4 and 402.3 mA h gZn−1 for BPMC/NCNT-10, BPMC/NCNT-20, BPMC/NCNT-5 and BPMC, respectively (Fig. 4a). Unlike the discharge capacity, the charging capacity is the highest and the voltage required for charging is the lowest for BPMC/NCNT-20, which is attributed to its optimized OER activity. Cyclic stability tests of a BPMC/NCNT-10 cathode for 20 h with various cycle times of 10 min, 30 min, 2 h and 4 h show no obvious alteration in the voltage gap (Fig. S16, ESI†). A longer stability test at 5 mA cm−2 with 1 h cycle time demonstrates pristine stability for 85 h before an observable degradation occurs due to catalyst leaching, which turns the transparent electrolyte deep brown (Fig. 4b). The ZAB with the BPMC/NCNT-10 cathode demonstrates appealing performance with long charge–discharge time in comparison to recent reports on perovskite oxides and carbon nanostructure based composite cathodes (Table S5, ESI†).18,19,27–33
 | ||
| Fig. 4 Rechargeable ZAB performance: (a) capacity plots at 5 mA cm−2 with different BPMC cathode materials and (b) cyclic stability test of BPMC/NCNT-10 cathode. | ||
In conclusion, room temperature processing of a composite of p-type BPMC NSs and n-type NCNTs with variable NCNT content regulates the p–n junction interfaces and bifunctional oxygen electrocatalytic activity. The composite with 10 wt% NCNTs demonstrates the lowest BI of 794 mV. Optimization of the donor level through efficient charge transfer from BPMC to NCNTs facilitates the overall catalytic activity. In a rechargeable ZAB, the BPMC/NCNT-10 cathode shows a specific discharge capacity of 789.2 mA h gZn−1 and stable charge discharge cycling for at least 85 h at 5 mA cm−2. The successful design of an interconnected perovskite oxide and carbon nanostructure with effective charge transfer across the crystalline interface with a p–n junction is shown to be a prodigious strategy to achieve high-performing cathodes for metal–air batteries.
RM thanks CSIR, New Delhi, India for his fellowship. SM acknowledges UGC, New Delhi, India for his fellowship. The Academic & Research grant, IISER Kolkata, is duly acknowledged.
Conflicts of interest
The authors declare no conflict of interest.Notes and references
- T. M. Gür, Energy Environ. Sci., 2018, 11, 2696–2767 RSC.
- Y. Li and J. Lu, ACS Energy Lett., 2017, 2, 1370–1377 CrossRef CAS.
- J. Fu, R. Liang, G. Liu, A. Yu, Z. Bai, L. Yang and Z. Chen, Adv. Mater., 2019, 31, 1–13 Search PubMed.
- J. Pan, Y. Y. Xu, H. Yang, Z. Dong, H. Liu and B. Y. Xia, Adv. Sci., 2018, 5 Search PubMed.
- H. F. Wang and Q. Xu, Matter, 2019, 1, 565–595 CrossRef.
- J. Pan, X. L. Tian, S. Zaman, Z. Dong, H. Liu, H. S. Park and B. Y. Xia, Batteries Supercaps, 2019, 2, 336–347 CrossRef CAS.
- N. I. Kim, Y. J. Sa, T. S. Yoo, S. R. Choi, R. A. Afzal, T. Choi, Y. S. Seo, K. S. Lee, J. Y. Hwang, W. S. Choi, S. H. Joo and J. Y. Park, Sci. Adv., 2018, 4, eaap9360 CrossRef PubMed.
- W. J. Yin, B. Weng, J. Ge, Q. Sun, Z. Li and Y. Yan, Energy Environ. Sci., 2019, 12, 442–462 RSC.
- X. Xu, Y. Zhong and Z. Shao, Trends Chem., 2019, 1, 410–424 CrossRef.
- A. Grimaud, J. M. Bassat, F. Mauvy, M. Pollet, A. Wattiaux, M. Marrony and J. C. Grenier, J. Mater. Chem. A, 2014, 2, 3594–3604 RSC.
- T. Takeguchi, T. Yamanaka, H. Takahashi, H. Watanabe, T. Kuroki, H. Nakanishi, Y. Orikasa, Y. Uchimoto, H. Takano, N. Ohguri, M. Matsuda, T. Murota, K. Uosaki and W. Ueda, J. Am. Chem. Soc., 2013, 135, 11125–11130 CrossRef CAS PubMed.
- R. Majee, S. Chakraborty, H. G. Salunke and S. Bhattacharyya, ACS Appl. Energy Mater., 2018, 1, 3342–3350 CrossRef CAS.
- Y. Bu, O. Gwon, G. Nam, H. Jang, S. Kim, Q. Zhong, J. Cho and G. Kim, ACS Nano, 2017, 11, 11594–11601 CrossRef CAS PubMed.
- E. Fabbri, M. Nachtegaal, T. Binninger, X. Cheng, B. J. Kim, J. Durst, F. Bozza, T. Graule, R. Schäublin, L. Wiles, M. Pertoso, N. Danilovic, K. E. Ayers and T. J. Schmidt, Nat. Mater., 2017, 16, 925–931 CrossRef CAS PubMed.
- D. G. Lee, O. Gwon, H. S. Park, S. H. Kim, J. Yang, S. K. Kwak, G. Kim and H. K. Song, Angew. Chem., Int. Ed., 2015, 54, 15730–15733 CrossRef CAS PubMed.
- Q. A. Islam, R. Majee and S. Bhattacharyya, J. Mater. Chem. A, 2019, 7, 19453–19464 RSC.
- Y. Bu, G. Nam, S. Kim, K. Choi, Q. Zhong, J. H. Lee, Y. Qin, J. Cho and G. Kim, Small, 2018, 14, 1–7 Search PubMed.
- H. Ma and B. Wang, RSC Adv., 2014, 4, 46084–46092 RSC.
- M. Prabu, P. Ramakrishnan, P. Ganesan, A. Manthiram and S. Shanmugam, Nano Energy, 2015, 15, 92–103 CrossRef CAS.
- Y. Bu, H. Jang, O. Gwon, S. H. Kim, S. H. Joo, G. Nam, S. Kim, Y. Qin, Q. Zhong, S. K. Kwak, J. Cho and G. Kim, J. Mater. Chem. A, 2019, 7, 2048–2054 RSC.
- D. Lee, O. Gwon, H. Park, S. H. Kim, J. Yang, S. K. Kwak, G. Kim and H. Song, Angew. Chem., Int. Ed., 2015, 54, 15730–15733 CrossRef CAS PubMed.
- T. H. Shin, J. H. Myung, M. Verbraeken, G. Kim and J. T. S. Irvine, Faraday Discuss., 2015, 182, 227–239 RSC.
- R. Majee, Q. A. Islam and S. Bhattacharyya, ACS Appl. Mater. Interfaces, 2019, 11, 35853–35862 CrossRef CAS PubMed.
- K. Gelderman, L. Lee and S. W. Donne, J. Chem. Educ., 2007, 84, 685–688 CrossRef CAS.
- A. Zhang, J. Wu, L. Xue, S. Yan and S. Zeng, Inorg. Chem., 2020, 59, 403–414 CrossRef CAS PubMed.
- W. T. Hong, K. A. Stoerzinger, Y.-L. Lee, L. Giordano, A. Grimaud, A. M. Johnson, J. Hwang, E. J. Crumlin, W. Yang and Y. Shao-Horn, Energy Envion. Sci., 2017, 10, 2190–2200 RSC.
- D. U. Lee, M. G. Park, H. W. Park, M. H. Seo, V. Ismayilov, R. Ahmed and Z. Chen, Electrochem. Commun., 2015, 60, 38–41 CrossRef CAS.
- D. U. Lee, H. W. Park, M. G. Park, V. Ismayilov and Z. Chen, ACS Appl. Mater. Interfaces, 2015, 7, 902–910 CrossRef CAS PubMed.
- Z. Yan, H. Sun, X. Chen, X. Fu, C. Chen, F. Cheng and J. Chen, Nano Res., 2018, 11, 3282–3293 CrossRef CAS.
- T. Ishihara, L. M. Guo, T. Miyano, Y. Inoishi, K. Kaneko and S. Ida, J. Mater. Chem. A, 2018, 6, 7686–7692 RSC.
- J. Hu, L. Wang, L. Shi and H. Huang, Electrochim. Acta, 2015, 161, 115–123 CrossRef CAS.
- J. Hu, Q. Liu, Z. Shi, L. Zhang and H. Huang, RSC Adv., 2016, 6, 86386–86394 RSC.
- C. Alegre, E. Modica, A. S. Aricò and V. Baglio, J. Electroanal. Chem., 2018, 808, 412–419 CrossRef CAS.
Footnote |
| † Electronic supplementary information (ESI) available: Experimental details; Rietveld analysis, AFM height profile, Raman spectrum, TEM images, HAADF-STEM mapping and EDS analysis, Mott–Schottky analysis, Nyquist plots of OER, current–voltage plots, Cdl determination, RRDE experiments, chronopotentiometric stability test and comparison table. See DOI: 10.1039/d0cc03154b |
| This journal is © The Royal Society of Chemistry 2020 |


