 Open Access Article
Antibacterial performance of polymer quaternary ammonium salt–capped silver nanoparticles on Bacillus subtilis in water†
Jingyu Wang a,
Minghao Sui*b,
Zhanfang Mac,
Hongwei Lid and
Bojie Yuane
aSchool of Environmental Science and Engineering, Tongji University, 1239 Siping Road, Shanghai 200092, People's Republic of China
bState Key Laboratory of Pollution Control and Resource Reuse, Shanghai Institute of Pollution Control and Ecological Security, School of Environmental Science and Engineering, Tongji University, 1239 Siping Road, Shanghai 200092, People's Republic of China. E-mail: minghaosui@tongji.edu.cn; Fax: +86-21-65986313; Tel: +86-21-65982691
cSchool of Environmental Science and Engineering, Tongji University, 1239 Siping Road, Shanghai 200092, People's Republic of China
dCollege of Surveying and Geo-Informatics, Tongji University, 1239 Siping Road, Shanghai 200092, People's Republic of China
eSchool of Environmental Science and Engineering, Tongji University, 1239 Siping Road, Shanghai 200092, People's Republic of China
First published on 15th August 2019
Abstract
In this study, we prepared polymer quaternary ammonium salt–capped silver nanoparticles (PQAS–AgNPs) and investigated their antimicrobial activities. The antimicrobial effectiveness of PQAS–AgNPs on Bacillus subtilis (B. subtilis), and the effect of dose, pH, chloride ion and humic acid (HA) were studied. It was found that PQAS–AgNPs revealed excellent antimicrobial activity to B. subtilis, compared with polyvinylpyrrolidone-capped silver nanoparticles (PVP-AgNPs), which was the reference antimicrobial material. The positive surface, the antimicrobial activity of PQAS, and the synergistic antibacterial effect between PQAS and AgNPs contributed to the significant antibacterial superiority of PQAS–AgNPs. This study demonstrated that the impact of the dose of the material was positive and the microbiocidal efficacy of PQAS–AgNPs was stronger at lower pH. In addition, the antibacterial performance of PQAS–AgNPs decreased in the presence of Cl− and HA. Finally, in combination with the results of FCM and adenosine triphosphate (ATP) content, it was found that PQAS–AgNPs destroyed the respiratory chain of bacterial cells, reduced the synthesis of ATP, and destroyed the cell wall and cell membrane function.
1 Introduction
Disinfection is an obligatory process to guarantee the safety of drinking water. Traditional disinfection technology with disinfectants (e.g. chlorine, chloramines, ozone, and chlorine dioxide) can inactivate bacteria efficiently, but the formation of disinfection by-products (DBPs) remains a serious problem.1 Potential health risks of DBPs from drinking water include carcinogenic, teratogenetic and mutagenic effects.2–4 An epidemiological study has shown that 9.0% of all cases of prostate cancers and 15.0% of anal cancers are attributed to chlorinated drinking-water by-products.5 The development of novel disinfection methods without DBPs risks has been paid more and more attention by researchers in the last two decades.6,7Nanomaterials have attracted great attention for their potential use in water disinfection field, exhibiting highly antimicrobial activity and reducing the possibility of the formation of harmful DBPs.8 Among nanomaterials, silver nanoparticles (AgNPs) are the most promising antibacterial agent. Gong et al. proved that AgNPs have broad inhibitory biocidal spectra for microbes including bacteria, viruses and other eukaryotic micro-organisms.9 Dankovich et al. reported that AgNPs could inactivate Escherichia coli (E. coli) and Enterococcus faecalis (E. faecalis) effectively.10 Guzman et al. found that AgNPs inhibited the growth and multiplication of highly multidrug-resistant bacteria such as methicillin resistant Staphylococcus aureus (S. aureus), E. coli, and Pseudomonas aeruginosa (P. aeruginosa).11
The dissolution of metallic ions and their attack on microorganisms in aqueous solution were generally proposed to be the main antimicrobial pathways for metal-type of antimicrobial nanomaterials, however, some researchers considered that the contact of bacteria with nanomaterials had a crucial influence on the inactivating efficiency. Huang et al. reported that the efficient inactivation capacity of nano copper loaded multi-walled carbon nanotubes (nCu-MWCNTs) on E. coli was mainly because MWCNTs strengthened the contact of bacteria with nCu.12 Ma et al. found that in comparison with graphene oxide (GO), a significant decrease in the negative charge of Ag–GO composite which facilitated the contact between E. coli and Ag–GO was one of the important reasons for the improvement of the antibacterial activity of GO.13 The surface of the bacteria in natural water is generally negatively charged. So antimicrobial materials with positive surface which are prone to contacting with bacteria through electrostatic interaction should have better bactericidal capacity than those with negative or neutral charge. The existing studies on synthesis and antimicrobial properties of positively charged AgNPs have rarely been reported.
Quaternary ammonium salt (QAS), a positive charged antibacterial agent, is widely used as antiseptics, disinfectants, biocides, detergents, and so on.14,15 However, these small molecules are highly toxic to the environment and their protection is short-lived.16 During the last two decades, polymer quaternary ammonium salts (PQAS) have become a research hotspot, because it is believed that they are nonvolatile, chemically stable, and do not permeate through the skin.17,18 Dizman et al. synthesized a methacrylate monomer containing pendant QAS based on 1,4-di-azabicyclo-[2.2.2]-octane (DABCO), which contained either a butyl or a hexyl group and investigated the antimicrobial activities of the corresponding small molecules (bis-quaternary ammonium monocarboxylates) and polymers. Although the small molecules did not show any antimicrobial activity, the polymers were effectively bactericidal against S. aureus and E. coli in water.17,19
In this work, the polymer quaternary ammonium salt–capped silver nanoparticles (PQAS–AgNPs) was prepared aiming at obtaining a kind of antibacterial nanomaterial carrying positive-charge and possessing highly antibacterial capacity by combining the inactivating capacity of PQAS and AgNPs. Bacillus subtilis (B. subtilis) was chosen as the representative bacterium in water. To the best of the authors' knowledge, there is scarcely any publications on the deactivation of B. subtilis under PQAS–AgNPs. B. subtilis is the typical bacterium used in water or wastewater disinfection experiments. B. subtilis, the Gram-positive bacterium, has thicker peptidoglycans layer than Gram-negative bacteria which acts as an additional barrier for the entry of disinfectors inside the cells and is more difficult to be deactivated.20 And some water plants used B. subtilis as a microbial indicator for disinfection efficiency.21 Further, B. subtilis has similar biological characteristics to Cryptosporidium or Giardia.22–24 Therefore, B. subtilis was often used as a substitute for Cryptosporidium or Giardia to study the inactivation of the microorganisms. The results of the deactivation of AgNPs on B. subtilis might also provide some information on the deactivation effectiveness of nano-particles towards Cryptosporidium or Giardia, which can't be deactivated in chlorination. Besides, B. subtilis is not pathogenic, and colonies are easy to count. Special emphasis was placed on (1) investigating the antimicrobial efficiency of PQAS–AgNPs to B. subtilis; (2) examining the influencing factors, such as dose, pH, chloride ion and humic acid; and (3) exploring the damage to the B. subtilis cells, such as cell membrane and ATP changes.
2 Materials and methods
2.1 Materials
Silver nitrate (AgNO3) were purchased from Sigma-Aldrich. Glucose, sodium borohydride (NaBH4), ammonia water and anhydrous ethanol were purchased from Sinopharm (China). QAS can't combine with AgNPs via coordination bond, and chitosan was used as the chelator. Quaternized chitosan (QCS) (LOT: 104090, degree of substitution > 98%) was purchased from Cool Chemistry. The electrically neutral polyvinyl pyrrolidone-capped AgNPs (PVP-AgNPs) was used as the reference antibacterial material and purchased from Sigma-Aldrich (the size: 40 nm). Freeze-dried B. subtilis (ATCC 6633) was obtained from ATCC (USA). It was cultivated in nutrient broth (BD, USA) overnight at 37 °C in an aerobic shaker incubator with a constant agitation rate of 130 rpm. The labware and glassware used in the experiments were washed with 10% HNO3, rinsed thoroughly with pure water and oven-dried under dust-free conditions.2.2 Preparation of PQAS–AgNPs
PQAS–AgNPs were prepared following chemical reduction method. That was to say, in the liquid phase condition, silver ions were reduced to silver nanoparticles under the action of reductant. In order to prepare silver nanoparticles with uniform and controllable size, the crystal seed method was used. The total preparation process could be divided into four stages: solution preparation, crystal nucleus formation, crystal nucleus growth, purification and separation. Firstly, a certain concentration of solution was prepared, in which the concentration of AgNO3 solution was 25.0 mmol L−1, that of NaBH4 was 6.25 mmol L−1, that of QCS solution was 10.0 mg mL−1, and that of glucose solution was 1.0 mol L−1. Secondly, AgNO3 solution and QCS solution were mixed in volume ratio of 1![[thin space (1/6-em)]](https://www.rsc.org/images/entities/char_2009.gif) :
:![[thin space (1/6-em)]](https://www.rsc.org/images/entities/char_2009.gif) 5 and stirred for 5 min to obtain a white turbid solution, in which silver chloride precipitation formed. The silver ammonia solution was obtained by adding ammonia water dropwise to the turbid solution until the precipitation just disappeared. Sodium borohydride was slowly added to the silver ammonia solution in volume ratio of 6
5 and stirred for 5 min to obtain a white turbid solution, in which silver chloride precipitation formed. The silver ammonia solution was obtained by adding ammonia water dropwise to the turbid solution until the precipitation just disappeared. Sodium borohydride was slowly added to the silver ammonia solution in volume ratio of 6![[thin space (1/6-em)]](https://www.rsc.org/images/entities/char_2009.gif) :
:![[thin space (1/6-em)]](https://www.rsc.org/images/entities/char_2009.gif) 1 (AgNO3
1 (AgNO3![[thin space (1/6-em)]](https://www.rsc.org/images/entities/char_2009.gif) :
:![[thin space (1/6-em)]](https://www.rsc.org/images/entities/char_2009.gif) NaBH4). Then, the solution was transferred to three-necked flask at 95 °C and heated for one hour. Crystal seeds of PQAS–AgNPs were synthesized with the size of 4–5 nm. Thirdly, AgNO3 and glucose mixed solution with volume ratio of 1
NaBH4). Then, the solution was transferred to three-necked flask at 95 °C and heated for one hour. Crystal seeds of PQAS–AgNPs were synthesized with the size of 4–5 nm. Thirdly, AgNO3 and glucose mixed solution with volume ratio of 1![[thin space (1/6-em)]](https://www.rsc.org/images/entities/char_2009.gif) :
:![[thin space (1/6-em)]](https://www.rsc.org/images/entities/char_2009.gif) 1 were added to the obtained crystal seeds solution and reacted at 80 °C for 30 min. When the added AgNO3 volume attained a quarter of the volume of AgNO3 added in prior step, the size of PQAS–AgNPs reached 40 nm approximately. Finally, the PQAS–AgNPs solution was centrifuged and separated at a high speed of 10
1 were added to the obtained crystal seeds solution and reacted at 80 °C for 30 min. When the added AgNO3 volume attained a quarter of the volume of AgNO3 added in prior step, the size of PQAS–AgNPs reached 40 nm approximately. Finally, the PQAS–AgNPs solution was centrifuged and separated at a high speed of 10![[thin space (1/6-em)]](https://www.rsc.org/images/entities/char_2009.gif) 000 rpm for 40 min. After the supernatant was removed, the centrifuged PQAS–AgNPs were washed three times with pure water and anhydrous ethanol. Therefore, a purified polymer quaternary ammonium salt–capped silver nanoparticles composite (PQAS–AgNPs) was obtained.
000 rpm for 40 min. After the supernatant was removed, the centrifuged PQAS–AgNPs were washed three times with pure water and anhydrous ethanol. Therefore, a purified polymer quaternary ammonium salt–capped silver nanoparticles composite (PQAS–AgNPs) was obtained.
2.3 Characterization of PQAS–AgNPs
UV-visible absorption spectroscopy (JiHong, China) with quartz cuvettes (1 cm optical path) as the containers was used to record the UV-visible absorption spectra. The morphology and the size of PQAS–AgNPs were determined by transmission electron microscopy (TEM, JEM-2011, Jeol, Japan), which was coupled with an energy dispersive spectrometer (EDS). X-ray photoelectron spectroscopy (XPS) (PHI 5600, PerkinElmer Inc.) was used to determine the valence state of the produced AgNPs. The surface charge of the AgNPs was evaluated by zeta (ζ) potential, using a Zetasizer Nano instrument (Zetasizer Nano ZS 90, Malvern, UK) at 25 °C. The concentration of synthesized composite material was calculated by silver. The silver concentration was measured by an inductively coupled plasma mass spectrometry (ICP-MS7700, Agilent, USA) after being digested with concentrated HNO3 for 2 h.2.4 Antibacterial experiments
All antibacterial assays were performed in Class II microbiological safety cabinet (AC2-4S1, ESCO). The traditional heterotrophic plate counting (HPC) method was used to determine the viable cell numbers.25 Briefly, 100 μL bacteria suspension with initial cell concentration of about 107 CFU mL−1 was added to 900 μL of 2 mM NaHCO3 solution containing antimicrobial material. The number of viable cell was determined by spreading 30 μL of the above mixed suspension onto the nutrient agar plate for aerobic incubation at 37 °C. After 18–24 h incubation, bacterial colonies on each plate were counted. In control test, the bacteria suspension was added into 2 mM NaHCO3 solution in the absence of antimicrobial material. All experiments were conducted three times. The viable cell number was calculated as colony forming units per milliliter (CFU mL−1). The antibacterial rate was calculated as the equation below:The survival rate (lg![[thin space (1/6-em)]](https://www.rsc.org/images/entities/char_2009.gif) N0/N) = lg(viable cell number in control(sample without addition of antibacterial material)/viable cell number in sample(sample with addition of antibacterial material)) N0/N) = lg(viable cell number in control(sample without addition of antibacterial material)/viable cell number in sample(sample with addition of antibacterial material)) |
Zeta potential of bacterial suspension was conducted with a Zetasizer Nano instrument (Zetasizer Nano ZS 90, Malvern, UK). In order to quantify the ionic release of dissolved silver, samples were centrifuged and filtered by centrifugal ultrafilters (Amicon Ultra-15 3 K, Millipore, Billerica, MA) for 30 min at 15![[thin space (1/6-em)]](https://www.rsc.org/images/entities/char_2009.gif) 000 rpm. Nominal pore size of the porous cellulose membranes was 1–2 nm, which were small enough to separate silver ion from nanoparticles. The total organic carbon (TOC) of the composite material was measured by a TOC analyzer (TOC-LCPH, Shimadzu, JP).
000 rpm. Nominal pore size of the porous cellulose membranes was 1–2 nm, which were small enough to separate silver ion from nanoparticles. The total organic carbon (TOC) of the composite material was measured by a TOC analyzer (TOC-LCPH, Shimadzu, JP).
2.5 The analysis on the damage of B. subtilis
3 Results and discussion
3.1 Characterization of PQAS–AgNPs
The optical property of synthesized PQAS–AgNPs was displayed in Fig. 1(a). A single absorption peak at 418 nm was observed, which revealed the typical AgNPs optical absorbance feature.28 The steep absorption peak reflected the good dispersion of the nanoparticles, which indicated that AgNPs had been successfully synthesized. The morphology of PQAS–AgNPs was shown in Fig. 1(c and d). The PQAS–AgNPs were approximately spherical in shape, well dispersed and uniform in size. A bright film could be seen on the surface of AgNPs, which indicated that PQAS had been successfully coated on the surface of nanoparticles. The EDS and XPS results further confirmed the generation of AgNPs (Fig. 1(e and f)). A distinct signal and high atomic percent values for silver were obtained from the EDS profile. The strong silver signal along with a weak carbon, oxygen and nitrogen peak might originate from PQAS that were bound to the surface of AgNPs. XPS spectrum showed that the doublet Ag3d5/2 and Ag3d3/2 peaks were at 368.3 eV and 374.3 eV, respectively, demonstrating that Ag mainly stayed at zero valence.29,30 Wang reported that the surface modifier of AgNPs mainly depended on the ligand bond between lone pair electrons such as N or O in the materials and silver.31 In PQAS, there were a large number of amino and hydroxyl groups, so PQAS could bond with AgNPs. Nanomeasure was used to determine the particle size distribution, and the results were shown in Fig. 1(b). The particle sizes were mainly distributed between 26 to 54 nm and the average value was 40 nm. The PQAS–AgNPs possessed a positive surface, and the ζ potential of PQAS–AgNPs was monitored to be +30.8 mV. The physicochemical properties of PVP-AgNPs were also studied (Fig. S1†). The size was 40 nm and the ζ potential was −9.3 mV.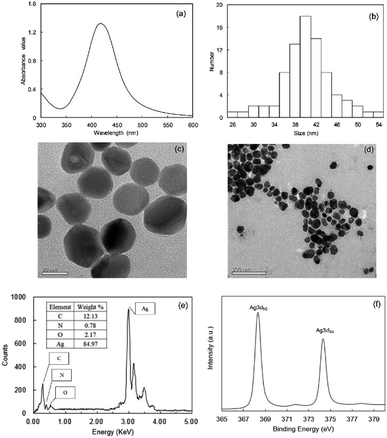 | ||
| Fig. 1 Characterization of PQAS–AgNPs (a) UV-visible spectrum; (b) the size distribution; (c and d) TEM images; (e) corresponding EDS spectrum and (f) XPS spectrum. | ||
3.2 Antibacterial capacity of PQAS–AgNPs
Taking PVP-AgNPs as reference, we evaluated the antibacterial capacity of PQAS–AgNPs towards B. subtilis. As shown in Fig. 2, PQAS–AgNPs showed a significant antibacterial superiority to PVP-AgNPs. After 5 minutes of contact with PQAS–AgNPs and PVP-AgNPs, the inactivation rates of B. subtilis were 1.21![[thin space (1/6-em)]](https://www.rsc.org/images/entities/char_2009.gif) log and 0.42
log and 0.42![[thin space (1/6-em)]](https://www.rsc.org/images/entities/char_2009.gif) log, respectively. Longer contact time was beneficial to the inactivation of PVP-AgNPs and PQAS–AgNPs to B. subtilis, while PQAS–AgNPs still showed better antibacterial capacity than PVP-AgNPs. At 30 min, the antibacterial rate of PQAS–AgNPs was 1.26 times higher than that of PVP-AgNPs. After 60 min, the antibacterial efficiency of PVP-AgNPs increased to 2.09
log, respectively. Longer contact time was beneficial to the inactivation of PVP-AgNPs and PQAS–AgNPs to B. subtilis, while PQAS–AgNPs still showed better antibacterial capacity than PVP-AgNPs. At 30 min, the antibacterial rate of PQAS–AgNPs was 1.26 times higher than that of PVP-AgNPs. After 60 min, the antibacterial efficiency of PVP-AgNPs increased to 2.09![[thin space (1/6-em)]](https://www.rsc.org/images/entities/char_2009.gif) log, and the inactivation rate of PQAS–AgNPs to B. subtilis reached 3.55
log, and the inactivation rate of PQAS–AgNPs to B. subtilis reached 3.55![[thin space (1/6-em)]](https://www.rsc.org/images/entities/char_2009.gif) log.
log.
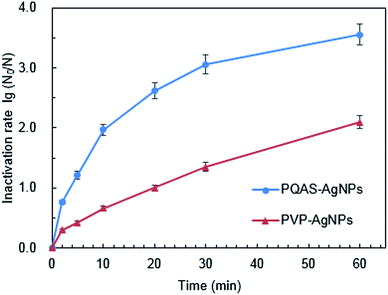 | ||
| Fig. 2 Inactivation efficiency of B. subtilis by PQAS–AgNPs and PVP-AgNPs. Reaction conditions: [AgNPs] = 10.0 mg L−1, pH = 7.1, T = 25 °C, initial concentration of bacteria: 106 CFU mL−1. | ||
The positive charge and the antimicrobial activity of PQAS should be the reason why PQAS–AgNPs possessed better antimicrobial capacity than PVP-AgNPs. The isoelectric points of bacteria were commonly between 2–5,32 and the surface potential of bacteria in natural water was negative. Antimicrobial materials with positive charge surface should have antibacterial advantage over that with negative charge surface because of the electrostatic attraction between bacteria and the antibacterial materials. El Badawy et al. have studied the antimicrobial activity of several AgNPs with different surface modifiers, including uncoated H2-AgNPs, PVP-AgNPs, citrate-AgNPs and BPEI-AgNPs (branched polyethyleneimine-coated silver nanoparticles).33 The results showed that BPEI-AgNPs with the positive surface had the strongest bactericidal effect than the other three antibacterial materials carrying negative charge. In our experiment, the ζ potential of B. subtilis at pH 7.1 was measured to be −40.5 mV, and the surface potential of PQAS–AgNPs was positive with ζ potential of +30.8 mV. Compared with PVP-AgNPs with negative surface potential (ζ potential: −9.3 mV), B. subtilis was obviously more easily accessible to the surface of PQAS–AgNPs, which then facilitated the deactivation of B. subtilis.
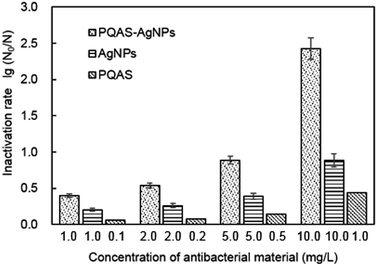
Different from PVP, PQAS could also contribute its antimicrobial activity to the overall deactivation efficiency of PQAS–AgNPs to B. subtilis. Some researchers have investigated the antimicrobial ability of PQAS. Chen et al. found that quaternary ammonium salts could significantly improve the antimicrobial effect, and had strong inactivation effect on E. coli and S. aureus.34 Huang et al. added chitosan quaternary ammonium salt to the nanofiltration membrane, and found that the filter membrane had better antibacterial properties during filtration process.35 The antibacterial activity of PQAS on B. subtilis was also studied in our test with PVP as reference. As illustrated in Fig. 3, PVP showed no any deactivation activity. While PQAS exhibited antibacterial activity on B. subtilis, and 0.1![[thin space (1/6-em)]](https://www.rsc.org/images/entities/char_2009.gif) log of B. subtilis was deactivated in the presence of 0.1 mg L−1 of PQAS in 60 min. Here a question, whether the antibacterial capacity of PQAS–AgNPs was just the simple summation of the antibacterial activities of PQAS and AgNPs or not, should be clarified. Then, the antibacterial activity of 1.0 mg L−1 of PQAS–AgNPs was compared with the combination of 0.1 mg L−1 PQAS and 1.0 mg L−1 of AgNPs. In this experiment, PVP-AgNPs were used to replace the uncoated AgNPs to avoid the poor dispersion of AgNPs alone. Here 1.0 mg L−1 nanosilver dosage was applied in order to distinguish the potency of each antimicrobial material, and 0.1 mg L−1 PQAS solution was used to simulate the coating concentration of 1.0 mg L−1 of PQAS–AgNPs (By measuring the TOC of PQAS–AgNPs, we found that the carbon content of 1.0 mg L−1 of PQAS–AgNPs didn't exceed 0.1 mg L−1. In order to facilitate calculation, 0.1 mg L−1 PQAS was used to simulate the surface coating content of 1.0 mg L−1 of PQAS–AgNPs.) The comparison results were shown in Fig. 3. It was worthy to note that the deactivation efficiency of 1.0 mg L−1 of PQAS–AgNPs on B. subtilis was much higher than that of the summation of 0.1 mg L−1 PQAS and 1.0 mg L−1 of AgNPs, which indicated that the synergistic antibacterial effect should occur between PQAS and AgNPs. It was inferred that positive charge surface of PQAS might facilitate the contact of B. subtilis with AgNPs, which improved the antimicrobial performance of PQAS–AgNPs.
log of B. subtilis was deactivated in the presence of 0.1 mg L−1 of PQAS in 60 min. Here a question, whether the antibacterial capacity of PQAS–AgNPs was just the simple summation of the antibacterial activities of PQAS and AgNPs or not, should be clarified. Then, the antibacterial activity of 1.0 mg L−1 of PQAS–AgNPs was compared with the combination of 0.1 mg L−1 PQAS and 1.0 mg L−1 of AgNPs. In this experiment, PVP-AgNPs were used to replace the uncoated AgNPs to avoid the poor dispersion of AgNPs alone. Here 1.0 mg L−1 nanosilver dosage was applied in order to distinguish the potency of each antimicrobial material, and 0.1 mg L−1 PQAS solution was used to simulate the coating concentration of 1.0 mg L−1 of PQAS–AgNPs (By measuring the TOC of PQAS–AgNPs, we found that the carbon content of 1.0 mg L−1 of PQAS–AgNPs didn't exceed 0.1 mg L−1. In order to facilitate calculation, 0.1 mg L−1 PQAS was used to simulate the surface coating content of 1.0 mg L−1 of PQAS–AgNPs.) The comparison results were shown in Fig. 3. It was worthy to note that the deactivation efficiency of 1.0 mg L−1 of PQAS–AgNPs on B. subtilis was much higher than that of the summation of 0.1 mg L−1 PQAS and 1.0 mg L−1 of AgNPs, which indicated that the synergistic antibacterial effect should occur between PQAS and AgNPs. It was inferred that positive charge surface of PQAS might facilitate the contact of B. subtilis with AgNPs, which improved the antimicrobial performance of PQAS–AgNPs.
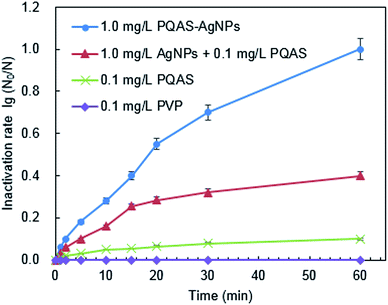 | ||
| Fig. 3 The role of PQAS and AgNPs in the antibacterial activity of PQAS–AgNPs. Reaction conditions: reaction time = 60 min, pH = 7.1, T = 25 °C, initial concentration of B. subtilis: 106 CFU mL−1. | ||
In addition, the role of the dissolution of metallic ions on the antibacterial capacity of PQAS–AgNPs must be taken into consideration. Many researchers proposed that the release of silver ions from AgNPs was the key to their antimicrobial ability.36–38 The different antibacterial capacity between PQAS–AgNPs and PVP-AgNPs might relate to the different dissolution of silver ions. The release of silver ions from 1.0 mg L−1 of PQAS–AgNPs and PVP-AgNPs after 60 min was studied. As shown in Fig. 4, there was no significant difference of silver ions dissolution. The silver ions released from PQAS–AgNPs and PVP-AgNPs were 4.3 μg L−1 and 4.1 μg L−1, respectively. The antimicrobial rate of 4.3 μg L−1 and 4.1 μg L−1 of silver ions were no more than 0.1![[thin space (1/6-em)]](https://www.rsc.org/images/entities/char_2009.gif) log (Fig. S2†). The antimicrobial rate of 4.3 μg L−1 of silver ions occupied only 10.0% of the antimicrobial rate of 1.0 mg L−1 of PQAS–AgNPs. And a conclusion could be obtained that the antibacterial process of PQAS–AgNPs was mainly the surface interaction of B. subtilis with PQAS–AgNPs.
log (Fig. S2†). The antimicrobial rate of 4.3 μg L−1 of silver ions occupied only 10.0% of the antimicrobial rate of 1.0 mg L−1 of PQAS–AgNPs. And a conclusion could be obtained that the antibacterial process of PQAS–AgNPs was mainly the surface interaction of B. subtilis with PQAS–AgNPs.
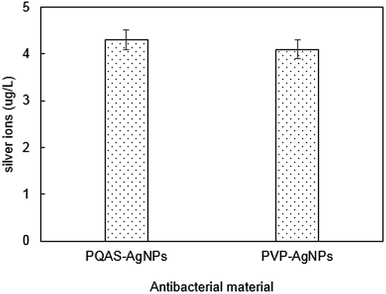 | ||
| Fig. 4 The silver ion release in PQAS–AgNPs or PVP-AgNPs solution. Reaction conditions: [AgNPs] = 1.0 mg L−1, reaction time = 60 min, pH = 7.1, T = 25 °C. | ||
3.3 Influencing factors
| a A* represented PQAS–AgNPs, B* represented AgNPs, C* represented PQAS. | ||||||||||||
|---|---|---|---|---|---|---|---|---|---|---|---|---|
| Dosage of antibacterial materials (mg L−1) | A* | B* | C* | A* | B* | C* | A* | B* | C* | A* | B* | C* |
| 1.0 | 1.0 | 0.1 | 2.0 | 2.0 | 0.2 | 5.0 | 5.0 | 0.5 | 10.0 | 10.0 | 1.0 | |
| Inactivation rate (log) | 0.400 | 0.200 | 0.055 | 0.540 | 0.260 | 0.078 | 0.885 | 0.390 | 0.138 | 2.425 | 0.885 | 0.437 |
| Ratio of inactivation rate of B*/A* | 0.500 | 0.481 | 0.441 | 0.365 | ||||||||
| Ratio of inactivation rate of (B* + C*)/A* | 0.638 | 0.626 | 0.597 | 0.545 | ||||||||
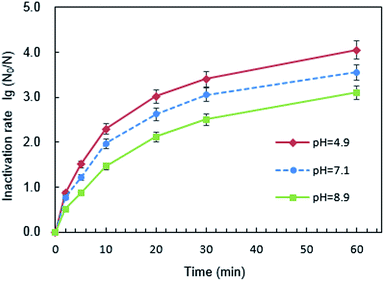
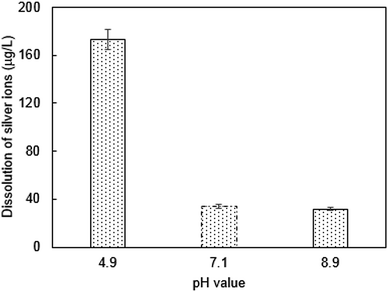
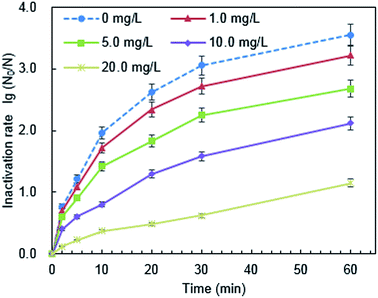
The surface potential of PQAS–AgNPs and B. subtilis at different pH was analyzed. The ζ potentials of PQAS–AgNPs at pH 4.9, 7.1 and 8.9 were +31.0, +30.8 and +22.0 mV, respectively. In neutral and weak acidic environment, the ζ potential of PQAS–AgNPs had little difference. However, in weak alkaline environment, the surface potential of PQAS–AgNPs decreased, which should be due to the adsorption of OH− on the surface of PQAS–AgNPs. At pH 4.9, 7.1 and 8.9, the ζ potentials of B. subtilis were measured to be −38.1, −40.5 and −44.3 mV, respectively. The potential differences between antimicrobial material and bacteria were 68.1 mV, 71.3 mV and 66.3 mV under pH 4.9, 7.1 and 8.9, respectively. The potential difference was the largest under neutral condition. Greater potential difference between PQAS–AgNPs and B. subtilis at pH 7.1 than that at pH 8.9 should be the reason of higher deactivation efficiency of B. subtilis at pH 7.1. The abnormally higher deactivation capacity of PQAS–AgNPs at pH 4.9, which should display the lower deactivation rate than that at pH 7.1 from the consideration of the potential differences of between PQAS–AgNPs and B. subtilis at pH 4.9 and 7.1, should be due to the contribution of the dissolved silver ions. The concentration of dissolved silver ions was 173.0 μg L−1 at pH 4.9, which was more than five times of that at pH 7.1 and 8.9 (34.2 and 31.8 μg L−1 at pH 7.1 and 8.9, respectively, Fig. 7). The deactivation activity of 173.0, 34.2 and 31.8 μg L−1 of silver ions was also tested. As shown in Fig. S3,† the deactivation efficiency of B. subtilis in the presence of 173.0 μg L−1 of silver ions (the corresponding concentration of silver ions dissolved at pH 4.9) was 3.1 times higher than that in the presence of 34.6 μg L−1 of silver ions (the corresponding concentration of silver ions dissolved at pH 7.1). And the ratio of the deactivation rate of 173.0 μg L−1 of silver ions to 10.0 mg L−1 of PQAS–AgNPs was 38.0%, which suggested that at acidic condition, the silver ions in the solution also played an important role for the deactivation of B. subtilis besides the surface deactivation of PQAS–AgNPs.
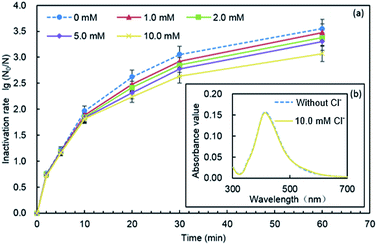
![[thin space (1/6-em)]](https://www.rsc.org/images/entities/char_2009.gif) log to 3.07
log to 3.07![[thin space (1/6-em)]](https://www.rsc.org/images/entities/char_2009.gif) log, and the antimicrobial effect decreased by 13.51%, while the inactivation rate of PVP-AgNPs to B. subtilis decreased by 36.57%. This should be due to unaffected antimicrobial reactivity of PQAS and the synergistic antimicrobial effect in PQAS–AgNPs.
log, and the antimicrobial effect decreased by 13.51%, while the inactivation rate of PVP-AgNPs to B. subtilis decreased by 36.57%. This should be due to unaffected antimicrobial reactivity of PQAS and the synergistic antimicrobial effect in PQAS–AgNPs.
Li et al. showed that the stability of AgNPs was strongly affected by the presence of Cl−, and the increase of the concentration of Cl− led to a corresponding increase in the aggregation rate.41 Chambers found that chloride might cause the formation of AgCl0(s) shells and bridging between AgNPs, thus AgNP aggregates were formed.40 In our study, as illustrated in Fig. 8(b), when Cl− was added, the ultraviolet absorption spectrum unchanged compared with that in the absence of Cl−, and the peak height and peak shape were well, which indicated that the particle size of PQAS–AgNPs did not change, and no agglomeration occurred. This result also suggested that stability of PQAS–AgNPs was not just dependent on the electrostatic repulsion effect, but also on the space steric effect.42
The effect of Cl− on the dissolution of nanoparticles was not conclusive. Li et al. found that the formation of a AgCl layer on the AgNPs inhibited their dissolution at the presence of 10–40 mM NaCl.41 However, chambers found that AgNP dissolution strongly increased under increased chloride conditions, but the dominant, theoretical, equilibrium aqueous silver species shifted to negatively charged AgClx(x−1)− species, which appeared to be less toxic to E. coli.40 The effect of the presence of Cl− on the dissolution of silver ions from PQAS–AgNPs was studied. It was shown that the dissolution of silver was inhibited in the presence of chloride ions. In 60 min, 34.2 μg L−1 of silver ions was detected originally (Fig. 7), while only 18.5 μg L−1 of silver ions was dissolved from 10.0 mg L−1 of PQAS–AgNPs in the presence of 10.0 mM Cl− under the same experimental conditions. This might be due to the formation of AgCl on the surface of PQAS–AgNPs which hindered the dissolution of silver ions. And the formation of AgCl should also occur on the surface of PQAS–AgNPs and then lead to the decrease of the effective antibacterial sites, which might be a key reason to the weakening of the antibacterial reactivity of PQAS–AgNPs in the presence of Cl−.
![[thin space (1/6-em)]](https://www.rsc.org/images/entities/char_2009.gif) log to 1.15
log to 1.15![[thin space (1/6-em)]](https://www.rsc.org/images/entities/char_2009.gif) log after adding 20.0 mg L−1 HA to PQAS–AgNPs antibacterial system for 1 h reaction. As a comparison, the results of inactivation effect of PVP-AgNPs was illustrated in Fig. S6.† After 20.0 mg L−1 of HA was added for 60 min reaction, the antimicrobial activity of PVP-AgNPs decreased by 0.82
log after adding 20.0 mg L−1 HA to PQAS–AgNPs antibacterial system for 1 h reaction. As a comparison, the results of inactivation effect of PVP-AgNPs was illustrated in Fig. S6.† After 20.0 mg L−1 of HA was added for 60 min reaction, the antimicrobial activity of PVP-AgNPs decreased by 0.82![[thin space (1/6-em)]](https://www.rsc.org/images/entities/char_2009.gif) log (39.2%), while that of PQAS–AgNPs decreased by 2.40
log (39.2%), while that of PQAS–AgNPs decreased by 2.40![[thin space (1/6-em)]](https://www.rsc.org/images/entities/char_2009.gif) log (67.6%). It was noteworthy that HA had a more conspicuous weakening effect to the inactivation reactivity of PQAS–AgNPs than PVP-AgNPs.
log (67.6%). It was noteworthy that HA had a more conspicuous weakening effect to the inactivation reactivity of PQAS–AgNPs than PVP-AgNPs.
The presence of HA was supposed to affect the property of both AgNPs and PQAS. Combining with the previous literatures, it could be known that HA weakened the antimicrobial ability of PQAS–AgNPs as the following reasons: (1) the basic structure of HA was aromatic and aliphatic rings, connecting with carboxyl, hydroxyl and carbonyl groups. It could adsorb on the surface of antimicrobial materials and bacteria and hinder the contact between cells and nanoparticles;39,43 (2) the presence of HA reduced the positive charge on the surface of the antimicrobial material, thus weakening the electrostatic attraction between the material and bacteria. We measured the ζ potential of PQAS–AgNPs and VP-AgNPs in the presence of HA, and found that the surface potential of PQAS–AgNPs and PVP-AgNPs decreased from +30.8 mV to −29.7 mV and from −9.3 mV to −27.2 mV, respectively. It was interesting to found that the decrease degree of surface potential of PQAS–AgNPs was more significantly than that of PVP-AgNPs, which might be one of the reasons that the antibacterial capacity of PQAS–AgNPs were weakened more seriously by HA; (3) the presence of HA might hinder the antibacterial effect of silver ions released from nano-silver. The reducibility of HA could reduce silver ions to silver monomers.44 In addition, silver ions might form complexes with HA,45,46 resulting in a reduction of antibacterial effectiveness; (4) Jeen-Kuan Chen reported that chitosan had potent adsorption capacity to HA.47 In this experiment, PQAS was obtained by modifying a quaternary ammonium salt with the chitosan polymer as a skeleton. Therefore, we speculated that PQAS and HA could also crosslink together due to the interaction of various groups, thus affecting the antibacterial properties of PQAS itself. More work was needed in the future to confirm this hypothesis.
3.4 Damage to B. subtilis cells
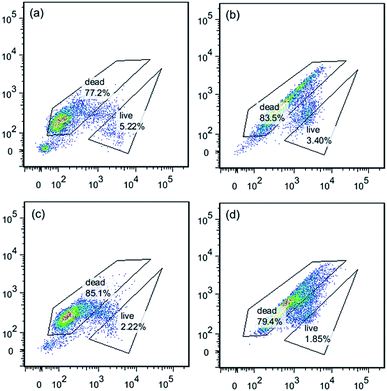
Comparing the same concentration of PQAS–AgNPs and PVP-AgNPs (Fig. S7†), it was found that with the increase of the concentration of antimicrobial materials, the difference of the ratio of dead/live bacteria increased gradually (Fig. S8†). When the material concentration reached 10.0 mg L−1, the ratio of dead/live bacteria was 42.9 in the FCM results of bacteria treated with PQAS–AgNPs, while the ratio of PVP-AgNPs was 13.8. This ratio also showed that the destruction of bacterial cell membrane by PQAS–AgNPs was greater than that by PVP-AgNPs.
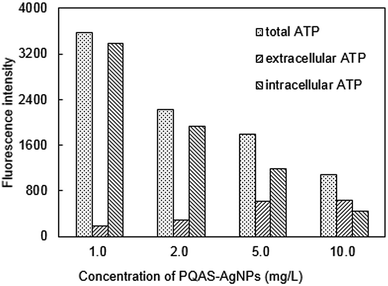 | ||
| Fig. 11 Changes of ATP of B. subtilis after treated by PQAS–AgNPs. Reaction conditions: reaction time = 15 min, pH = 7.1, T = 25 °C, initial concentration of B. subtilis: 106 CFU mL−1. | ||
By comparing the differences between PQAS–AgNPs and PVP-AgNPs (Fig. S9†), it could be found that the ratio of extracellular ATP/intracellular ATP after PQAS–AgNPs treatment was significantly higher than that treated with PVP-AgNPs at the same concentration. When bacteria were treated with 10.0 mg L−1 PQAS–AgNPs, the extracellular ATP content was 144.2% of intracellular ATP content, whereas that of PVP-AgNPs was only 34.8% (as Fig. S10† showed), indicating that PQAS–AgNPs treatment made the leakage of intracellular substances more serious and caused more severe damage to the cell wall and cell membrane structure.
4 Conclusions
In this study, polymer quaternary ammonium salt–capped silver nanoparticles (PQAS–AgNPs) were synthesized and tested for their antimicrobial activities. The results showed that PQAS–AgNPs revealed excellent antimicrobial activity to B. subtilis. The positive surface, the antimicrobial activity of PQAS, and the synergistic antibacterial effect between PQAS and AgNPs contributed to the significant antibacterial superiority of PQAS–AgNPs. The antimicrobial efficiency of PQAS–AgNPs to B. subtilis was affected by the dose of the material, pH, Cl− and HA in water. The antimicrobial efficacy of PQAS–AgNPs was stronger at lower pH condition. The impact of the dose of the material was positive, whereas the effects of Cl− and HA were negative. In combination with the results of FCM and ATP content, it was found that PQAS–AgNPs destroyed the respiratory chain of cells, reduced the synthesis of ATP, and destroyed the cell wall and cell membrane function which led to the leaking of the intracellular substances.Conflicts of interest
There are no conflicts to declare.Acknowledgements
This study was supported by the National Natural Science Foundation of China (Grant 51478322, 51278351), and the Major National Water Pollution Control and Management Project (Grant 2014ZX07405-003, 2017ZX07201001).Notes and references
- J. Lu, T. Zhang, J. Ma and Z. Chen, J. Hazard. Mater., 2009, 162, 140–145 CrossRef CAS PubMed.
- Y. Kargalioglu, B. J. McMillan, R. A. Minear and M. J. Plewa, Teratog., Carcinog., Mutagen., 2002, 22, 113–128 CrossRef CAS PubMed.
- E. D. Wagner and M. J. Plewa, J. Environ. Sci., 2017, 58, 64–76 CrossRef PubMed.
- S. Sciacca and G. O. Conti, Mediterr. J. Nutr. Metab., 2009, 2, 157–162 Search PubMed.
- M. Greenberg, Am. J. Ind. Med., 1992, 21, 137–139 CrossRef CAS PubMed.
- S. Pigeot-Rémy, F. Simonet, E. Errazuriz-Cerda, J. C. Lazzaroni, D. Atlan and C. Guillard, Appl. Catal., B, 2011, 104, 390–398 CrossRef.
- Q. Zhang, R. Ma, Y. Tian, B. Su, K. Wang, S. Yu, J. Zhang and J. Fang, Environ. Sci. Technol., 2016, 50, 3184–3192 CrossRef CAS PubMed.
- F. Hossain, O. J. Perales-Perez, S. Hwang and F. Román, Sci. Total Environ., 2014, 466–467, 1047–1059 CrossRef CAS PubMed.
- P. Gong, H. Li, X. He, K. Wang, J. Hu, W. Tan, S. Zhang and X. Yang, Nanotechnology, 2007, 18, 285604 CrossRef.
- T. A. Dankovich and D. G. Gray, Environ. Sci. Technol., 2011, 45, 1992–1998 CrossRef CAS PubMed.
- M. Guzman, J. Dille and S. Godet, Nanomedicine, 2012, 8, 37–45 CrossRef CAS PubMed.
- T. D. Huang, M. H. Sui and J. Y. Li, Sci. Total Environ., 2017, 574, 818–828 CrossRef CAS PubMed.
- J. Z. Ma, J. T. Zhang, Z. G. Xiong, Y. Yong and X. S. Zhao, J. Mater. Chem., 2011, 21, 3350–3352 RSC.
- X. R. Xie, W. Cong, F. Zhao, H. J. Li, W. Y. Xin, G. G. Hou and C. H. Wang, J. Enzyme Inhib. Med. Chem., 2017, 33, 98–105 CrossRef PubMed.
- C. Zhang, F. Cui, G.-m. Zeng, M. Jiang, Z.-z. Yang, Z.-g. Yu, M.-y. Zhu and L.-q. Shen, Sci. Total Environ., 2015, 518–519, 352–362 CrossRef CAS PubMed.
- S. M. Iconomopoulou and G. A. Voyiatzis, J. Controlled Release, 2005, 103, 451–464 CrossRef CAS PubMed.
- B. Dizman, M. O. Elasri and L. J. Mathias, J. Appl. Polym. Sci., 2004, 94, 635–642 CrossRef CAS.
- G. Lu, D. Wu and R. Fu, React. Funct. Polym., 2007, 67, 355–366 CrossRef CAS.
- Y. Xue, H. Xiao and Y. Zhang, Int. J. Mol. Sci., 2015, 16, 3626 CrossRef CAS PubMed.
- R. Sinha, R. Karan, A. Sinha and S. K. Khare, Bioresour. Technol., 2011, 102, 1516–1520 CrossRef CAS PubMed.
- A. Huertas, B. Barbeau, C. Desjardins, A. Galarza, M. A. Figueroa and G. A. Toranzos, Water Sci. Technol., 2003, 47, 255–259 CrossRef CAS PubMed.
- B. Setlow, K. A. McGinnis, K. Ragkousi and P. Setlow, J. Bacteriol., 2000, 182, 6906–6912 CrossRef CAS PubMed.
- M. Cho, J.-H. Kim and J. Yoon, Water Res., 2006, 40, 2911–2920 CrossRef CAS PubMed.
- M. A. Larson and B. J. Mariñas, Water Res., 2003, 37, 833–844 CrossRef CAS PubMed.
- Y. O. Thomas, W. J. Lulves and A. A. Kraft, J. Food Sci., 1981, 46, 1951–1952 CrossRef.
- J. Y. Wang, M. H. Sui, B. J. Yuan, H. W. Li and H. T. Lu, Sci. Total Environ., 2019, 648, 271–284 CrossRef CAS PubMed.
- F. Hammes, F. Goldschmidt, M. Vital, Y. Y. Wang and T. Egli, Water Res., 2010, 44, 3915–3923 CrossRef CAS PubMed.
- L. Li, J. Sun, X. R. Li, Y. Zhang, Z. X. Wang, C. R. Wang, J. W. Dai and Q. B. Wang, Biomaterials, 2012, 33, 1714–1721 CrossRef CAS PubMed.
- D. Teng-Yuan, C. Wei-Ting, W. Ching-Wen, C. Chiao-Pei, C. Chen-Ni, L. Ming-Cheng, S. Jenn-Ming, C. In-Gann and K. Tzu-Hsuan, Phys. Chem. Chem. Phys., 2009, 11, 6269–6275 RSC.
- Y.-M. Long, L.-G. Hu, X.-T. Yan, X.-C. Zhao, Q.-F. Zhou, Y. Cai and G.-B. Jiang, Int. J. Nanomed., 2017, 12, 3193–3206 CrossRef CAS PubMed.
- H. Wang, X. Qiao, J. Chen, X. Wang and S. Ding, Mater. Chem. Phys., 2005, 94, 449–453 CrossRef CAS.
- V. P. Harden and J. O. Harris, J. Bacteriol., 1953, 65, 198 CAS.
- A. M. El Badawy, R. G. Silva, B. Morris, K. G. Scheckel, M. T. Suidan and T. M. Tolaymat, Environ. Sci. Technol., 2011, 45, 283–287 CrossRef CAS PubMed.
- Y. X. Chen, J. N. Li, Q. Q. Li, Y. Y. Shen, Z. C. Ge, W. W. Zhang and S. G. Chen, Carbohydr. Polym., 2016, 143, 246–253 CrossRef CAS PubMed.
- R. H. Huang, G. H. Chen, M. K. Sun, Y. M. Hu and C. J. Gao, J. Membr. Sci., 2006, 286, 237–244 CrossRef CAS.
- W.-R. Li, X.-B. Xie, Q.-S. Shi, H.-Y. Zeng, Y.-S. OU-Yang and Y.-B. Chen, Appl. Microbiol. Biotechnol., 2010, 85, 1115–1122 CrossRef CAS PubMed.
- Z.-m. Xiu, Q.-b. Zhang, H. L. Puppala, V. L. Colvin and P. J. J. Alvarez, Nano Lett., 2012, 12, 4271–4275 CrossRef CAS PubMed.
- S. J. Lia, Y. P. Zhang, X. H. Pan, F. Z. Zhu, C. Y. Jiang, Q. Q. Liu, Z. Y. Cheng, G. Dai, G. J. Wu, L. Q. Wang and L. Y. Chen, Int. J. Nanomed., 2019, 14, 1469–1487 CrossRef PubMed.
- T. D. Huang, M. H. Sui, X. Yan, X. Zhang and Z. Yuan, Colloids Surf., A, 2016, 509, 492–503 CrossRef CAS.
- B. A. Chambers, A. R. M. N. Afrooz, S. Bae, N. Aich, L. Katz, N. B. Saleh and M. J. Kirisits, Environ. Sci. Technol., 2014, 48, 761–769 CrossRef CAS PubMed.
- X. Li, J. J. Lenhart and H. W. Walker, Langmuir, 2010, 26, 16690–16698 CrossRef CAS PubMed.
- H. Y. Zhang, J. A. Smith and V. Oyanedel-Craver, Water Res., 2012, 46, 691–699 CrossRef CAS PubMed.
- K. A. Huynh and K. L. Chen, Environ. Sci. Technol., 2011, 45, 5564–5571 CrossRef CAS PubMed.
- A. Nelson, R. I. Maccuspie, D. A. Navarro, D. S. Aga, B. Sarbajit, S. Mary and V. K. Sharma, Environ. Sci. Technol., 2011, 45, 3895–3901 CrossRef PubMed.
- X. Wang, W. Fan, Z. Dong, D. Liang and T. Zhou, Water Res., 2018, 138, 224–233 CrossRef CAS PubMed.
- S. M. Wirth, G. V. Lowry and R. D. Tilton, Environ. Sci. Technol., 2012, 46, 12687–12696 CrossRef CAS PubMed.
- J. K. Chen, C. H. Yeh, L. C. Wang, T. H. Liou, C. R. Shen and C. L. Liu, Mar. Drugs, 2011, 9, 2488–2498 CrossRef CAS PubMed.
- Y. Lee, S. Imminger, N. Czekalski, U. von Gunten and F. Hammes, Water Res., 2016, 101, 617–627 CrossRef CAS PubMed.
- C. N. Lok, C. M. Ho, R. Chen, Q. Y. He, W. Y. Yu, H. Z. Sun, P. K. H. Tam, J. F. Chiu and C. M. Che, J. Proteome Res., 2006, 5, 916–924 CrossRef CAS PubMed.
- P. V. AshaRani, G. Low Kah Mun, M. P. Hande and S. Valiyaveettil, ACS Nano, 2009, 3, 279–290 CrossRef CAS PubMed.
Footnote |
| † Electronic supplementary information (ESI) available. See DOI: 10.1039/c9ra05944j |
| This journal is © The Royal Society of Chemistry 2019 |

