 Open Access Article
Aqueous leaching of lithium from simulated pyrometallurgical slag by sodium sulfate roasting†
Na Lia,
Jiahui Guoa,
Zhidong Chang *a,
Hui Danga,
Xin Zhaoa,
Shujaat Alib,
Wenjun Li
 a,
Hualei Zhoua and
Changyan Suna
aSchool of Chemistry and Biological Engineering, University of Science and Technology Beijing, Beijing 100083, PR China. E-mail: zdchang@ustb.edu.cn
bWomen University Swabi, 23430, KPK, Pakistan
First published on 1st August 2019
Abstract
In the pyrometallurgical treatment for spent lithium-ion batteries (LIBs), lithium is generally present in slag with Al, Ca and Si and is hard to be further treated. In this study, lithium was recovered from a simulated pyrometallurgical slag (pyro-slag) via sodium roasting and water leaching. The thermodynamic process for the reactions between slag and additives such as NaCl, NaNO3 and Na2SO4 were simulated during roasting by the HSC software, where Na2SO4 possessed stronger chemical reactivity. The optimal conditions for roasting were experimentally determined to be 800 °C for 60 min and an Na2SO4/Li molar ratio of 3![[thin space (1/6-em)]](https://www.rsc.org/images/entities/char_2009.gif) :
:![[thin space (1/6-em)]](https://www.rsc.org/images/entities/char_2009.gif) 1, followed by water leaching at 70 °C for 80 min using a liquid-to-solid (L/S) mass ratio of 30
1, followed by water leaching at 70 °C for 80 min using a liquid-to-solid (L/S) mass ratio of 30![[thin space (1/6-em)]](https://www.rsc.org/images/entities/char_2009.gif) :
:![[thin space (1/6-em)]](https://www.rsc.org/images/entities/char_2009.gif) 1. This yielded a maximum of 93.62% lithium recovery. The mechanism by which insoluble lithium in slag was transformed into soluble lithium by salt roasting was proposed using the analysis of XRD and EDS spectra, in which ion exchange occurred between Na+ and Li+ at a certain temperature.
1. This yielded a maximum of 93.62% lithium recovery. The mechanism by which insoluble lithium in slag was transformed into soluble lithium by salt roasting was proposed using the analysis of XRD and EDS spectra, in which ion exchange occurred between Na+ and Li+ at a certain temperature.
1. Introduction
Due to the large energy density, high voltage, low self-discharge rate and long storage life,1–3 lithium-ion batteries (LIBs) are the best energy storage devices for hybrid electric vehicles (HEVs) or electric vehicles (EVs),4–6 which are substituting conventional inner combustion engine-based vehicles globally. To date, LIBs represent about 37% of the rechargeable battery world market, and this figure is increasing over time.7–9 Ironically, the more LIBs are produced, the more spent LIBs will be treated in the coming years.10 Moreover, cumulative data show that the demand for lithium resources will exceed the globally available value before 2025.7,11,12 In order to acquire lithium in a sustainable way, it is significant to recover lithium from spent LIBs.Currently, the recovery techniques for spent LIBs are mainly pyrometallurgical and hydrometallurgical. Most metals, including lithium, can be recovered from the spent LIBs by the hydrometallurgical technique.13 In general, pretreatment techniques such as dismantling, physical separation, and crushing are necessary for this process.14,15 Alternatively, in the pyrometallurgical process,16–21 which is simple and does not even require dismantling the spent LIBs,22 metals such as Fe, Cu, Ni and Co in lithium batteries are converted into an alloy after the organic materials are burnt away and then, they are further isolated through hydrometallurgical treatments.23,24 Nevertheless, a big disadvantage of all pyrometallurgical recycling processes for spent LIBs is that lithium is hard to be reduced,22 due to which lithium is left in the smelting slag phase25 with the addition of slag-forming agents such as CaO and SiO2.26,27 Generally, the slag is directly utilized as an additive in cement manufacturing, which is neither ecological nor resource-saving, especially for lithium. Recently, our research group proposed a strategy of lithium recovery from pyrometallurgical slag (pyro-slag) involving CaCl2 by roasting at high temperatures, in which the evaporation of LiCl from slag was the key to recovery.28 However, the relatively high reaction temperature (1000 °C) inevitably led to high energy consumption.
An effective method of salt roasting followed by water-leaching was applied to extract lithium from lepidolite and spodumene, in which the ore was activated at certain temperatures and insoluble lithium was transformed into soluble lithium, which was extracted by water. In 1955, Ellestad and Clarke confirmed that K2SO4 as an ion exchange reagent can greatly extract lithium from spodumene.29 Due to the high cost of K2SO4, an improved base exchange with Na2SO4 was introduced by Yan et al., in which over 90% lithium from lepidolite was recovered by salt roasting with the mixture of Na2SO4 and K2SO4, followed by water leaching.30 Salt roasting using Na2SO4 for lepidolite was subsequently conducted by Luong et al.31 Because the main chemical composition of the pyro-slag is very similar to that of lepidolite, if lithium is extracted by water leaching from its slag, the recovery process can be greatly valuable for the cyclic utilization of LIBs.
In this study, the approach of salt roasting and water leaching was employed to recycle lithium from pyro-slag which was obtained by the pyrometallurgical treatment of spent LIBs. The factors influencing lithium extraction were investigated and optimized, including roasting and leaching conditions. In addition, the mechanism of lithium recovery was demonstrated by XRD and SEM analyses.
2. Experimental
2.1 Instruments and reagents
The concentration of lithium in the samples was measured using an atomic absorption spectrophotometer (AAS, AA 6800, Shimadzu, Japan) at a wavelength of 670.8 nm with a current of 8 mA. The thermochemical properties of the samples were characterized by a thermogravimetric analyzer (TG/SDTA, TGA/SDTA851e, Mettler Toledo, Switzerland), in which the mixtures were heated in an air environment from 25 to 1000 °C at a heating rate of 10 °C min−1 in an alumina crucible. The data were processed with Mettler Toledo STAR software. The crystalline phases of the samples were analyzed by powder X-ray diffraction (XRD) (D/MAX-RB, Rigaku, Japan) with a Cu Kα radiation of λ = 1.5405 Å. The morphologies and element distribution of the samples were determined using a scanning electron microscope (SEM, SU8010, Hitachi, Japan) equipped with energy-dispersive X-ray spectroscopy (EDS).Lithium oxide (Li2O, analytical grade, >98.0% purity, Mw = 29.88 g mol−1), calcium oxide (CaO, analytical grade, Mw = 56.077 g mol−1), aluminum oxide (Al2O3, analytical grade, Mw = 101.96 g mol−1), silica (SiO2, analytical grade, Mw = 60.08 g mol−1), sodium sulfate (Na2SO4, analytical grade, ≥99.0% purity, Mw = 142.04 g mol−1), and deionizer water (the Laboratory Center of University of Science and Technology Beijing, China) were used.
2.2 Thermodynamic calculation
The reactions between three salts (NaCl, NaNO3 and Na2SO4) and the slag were simulated and further balanced by HSC chemistry 6.0, which is a computational thermochemical software developed by Outokumpu Oy Information Center.32,33 It can calculate enthalpy (H), entropy (S) and Gibbs free energy values (G) for given compounds and temperatures. For the chemical reactions, the Gibbs free energy change (ΔrGm) and the logarithm of the equilibrium constant (log![[thin space (1/6-em)]](https://www.rsc.org/images/entities/char_2009.gif) K) were calculated using the HSC software. In many cases, it is a very inexpensive and useful tool to find the optimal reaction conditions for experimental investigations.34
K) were calculated using the HSC software. In many cases, it is a very inexpensive and useful tool to find the optimal reaction conditions for experimental investigations.34
In this work, the values of ΔrGm and log![[thin space (1/6-em)]](https://www.rsc.org/images/entities/char_2009.gif) K for the related reactions were calculated at 50 °C intervals from 25 to 1000 °C at 1 atm based on the HSC software. According to the ΔrGm and log
K for the related reactions were calculated at 50 °C intervals from 25 to 1000 °C at 1 atm based on the HSC software. According to the ΔrGm and log![[thin space (1/6-em)]](https://www.rsc.org/images/entities/char_2009.gif) K values, the optimal roasting reagent and temperature were subsequently determined.
K values, the optimal roasting reagent and temperature were subsequently determined.
2.3 Preparation of simulated pyro-slag
Using pyrometallurgical treatment for spent LIBs, most of the metals such as Fe, Ni, Cu, and Co in the battery could be recovered as an alloy by carbon reduction roasting. The residues containing aluminum and lithium, which were hard to reduce, were used to produce the building materials by adding slag-forming agents, e.g., CaO and SiO2. The approximate composition of slag could be expressed as xSiO2·yCaO·zAl2O3·nLi2O.Generally, the composition of actual pyro-slag is 20–60 wt% SiO2, 20–35 wt% CaO, 10–30 wt% Al2O3 and 0.5–15 wt% Li2O.35 The intricacy of the actual slag composition makes it hard to be scientifically analyzed. Therefore, a simulated slag containing the dominant components of actual slag such as SiO2, CaO, Al2O3 and Li2O was prepared. The detailed mass ratio of SiO2![[thin space (1/6-em)]](https://www.rsc.org/images/entities/char_2009.gif) :
:![[thin space (1/6-em)]](https://www.rsc.org/images/entities/char_2009.gif) CaO
CaO![[thin space (1/6-em)]](https://www.rsc.org/images/entities/char_2009.gif) :
:![[thin space (1/6-em)]](https://www.rsc.org/images/entities/char_2009.gif) Al2O3
Al2O3![[thin space (1/6-em)]](https://www.rsc.org/images/entities/char_2009.gif) :
:![[thin space (1/6-em)]](https://www.rsc.org/images/entities/char_2009.gif) Li2O was 50
Li2O was 50![[thin space (1/6-em)]](https://www.rsc.org/images/entities/char_2009.gif) :
:![[thin space (1/6-em)]](https://www.rsc.org/images/entities/char_2009.gif) 35
35![[thin space (1/6-em)]](https://www.rsc.org/images/entities/char_2009.gif) :
:![[thin space (1/6-em)]](https://www.rsc.org/images/entities/char_2009.gif) 12
12![[thin space (1/6-em)]](https://www.rsc.org/images/entities/char_2009.gif) :
:![[thin space (1/6-em)]](https://www.rsc.org/images/entities/char_2009.gif) 3. The mixture in the graphite crucibles was prepared after grinding and then roasted in a muffle furnace for 2 h under 1200 °C. After being cooled in air, the as-prepared sintered simulated slag was crushed and further ground.
3. The mixture in the graphite crucibles was prepared after grinding and then roasted in a muffle furnace for 2 h under 1200 °C. After being cooled in air, the as-prepared sintered simulated slag was crushed and further ground.
2.4 Roasting and leaching procedure
Two g of simulated slag was mixed with Na2SO4 at different molar ratios of Na2SO4/Li (1![[thin space (1/6-em)]](https://www.rsc.org/images/entities/char_2009.gif) :
:![[thin space (1/6-em)]](https://www.rsc.org/images/entities/char_2009.gif) 1, 2
1, 2![[thin space (1/6-em)]](https://www.rsc.org/images/entities/char_2009.gif) :
:![[thin space (1/6-em)]](https://www.rsc.org/images/entities/char_2009.gif) 1, 3
1, 3![[thin space (1/6-em)]](https://www.rsc.org/images/entities/char_2009.gif) :
:![[thin space (1/6-em)]](https://www.rsc.org/images/entities/char_2009.gif) 1 and 4
1 and 4![[thin space (1/6-em)]](https://www.rsc.org/images/entities/char_2009.gif) :
:![[thin space (1/6-em)]](https://www.rsc.org/images/entities/char_2009.gif) 1) and then roasted in graphite crucibles at a selected temperature region (500–900 °C) from 20 to 120 min. Calcines were cooled to room temperature. Subsequently, the above samples were ground for 20 min and leached with water at 30–90 °C for 20–120 min using water/calcine mass ratios of 10
1) and then roasted in graphite crucibles at a selected temperature region (500–900 °C) from 20 to 120 min. Calcines were cooled to room temperature. Subsequently, the above samples were ground for 20 min and leached with water at 30–90 °C for 20–120 min using water/calcine mass ratios of 10![[thin space (1/6-em)]](https://www.rsc.org/images/entities/char_2009.gif) :
:![[thin space (1/6-em)]](https://www.rsc.org/images/entities/char_2009.gif) 1 to 50
1 to 50![[thin space (1/6-em)]](https://www.rsc.org/images/entities/char_2009.gif) :
:![[thin space (1/6-em)]](https://www.rsc.org/images/entities/char_2009.gif) 1. The liquid–solid phase was separated by filtration and the residue was washed thoroughly with distilled water several times. The leaching solution was analyzed by AAS to determine the concentration of lithium. The formulas for the recovery rate of lithium are expressed as follows:
1. The liquid–solid phase was separated by filtration and the residue was washed thoroughly with distilled water several times. The leaching solution was analyzed by AAS to determine the concentration of lithium. The formulas for the recovery rate of lithium are expressed as follows:| m1 = C0VM1 | (1) |
 | (2) |
 | (3) |
3. Results and discussion
3.1 Characterization of simulated slag
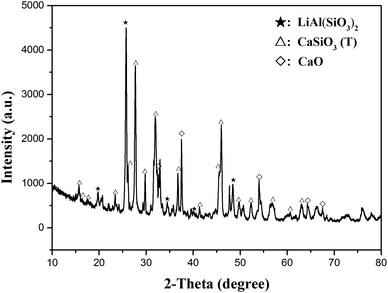
The XRD pattern of simulated slag is shown in Fig. 1. The major peaks matched well with the peaks of CaSiO3 (triclinic, JCPDS file no. 31-0300) and LiAl(SiO3)2 (β-spodumene, JCPDS file no. 31-0706), indicating that the main components of the simulated pyro-slag were CaSiO3 (T) and LiAl(SiO3)2. A few weak peaks corresponded to the peaks of CaO (JCPDS file no. 48-1467).3.2 Selection of roasting reagents
It is impossible to acquire lithium from initial pyro-slag directly since lithium exists in LiAl(SiO3)2, which can hardly be broken. The insoluble lithium can be converted to soluble lithium by salt roasting; then, it can be extracted with water, which is used in the process of lithium recovery from an ore.36 To investigate whether the pyro-slag exhibits a similar behavior to that of a lithium ore, three reactions between the NaCl, NaNO3 and Na2SO4 salts and LiAl(SiO3)2 were simulated; the thermodynamic parameters such as ΔrGm and log![[thin space (1/6-em)]](https://www.rsc.org/images/entities/char_2009.gif) K were calculated using the HSC software. The possible reactions of NaCl, NaNO3 and Na2SO4 with LiAl(SiO3)2 during roasting can be expressed as follows:
K were calculated using the HSC software. The possible reactions of NaCl, NaNO3 and Na2SO4 with LiAl(SiO3)2 during roasting can be expressed as follows:| NaCl + LiAl(SiO3)2 = NaAl(SiO3)2 + LiCl | (4) |
| NaNO3 + LiAl(SiO3)2 = NaAl(SiO3)2 + LiNO3 | (5) |
| Na2SO4 + LiAl(SiO3)2 = NaAl(SiO3)2 + NaLiSO4 | (6) |
The results obtained are plotted in Fig. 2. It can be seen that ΔrGm is positive and log![[thin space (1/6-em)]](https://www.rsc.org/images/entities/char_2009.gif) K is negative within the temperature range (Fig. 2a), which suggest that the reaction for extracting lithium with NaCl cannot occur spontaneously. The relevant values of ΔrGm and log
K is negative within the temperature range (Fig. 2a), which suggest that the reaction for extracting lithium with NaCl cannot occur spontaneously. The relevant values of ΔrGm and log![[thin space (1/6-em)]](https://www.rsc.org/images/entities/char_2009.gif) K calculated by eqn (5) are depicted in Fig. 2b. The value for ΔrGm was positive and that for log
K calculated by eqn (5) are depicted in Fig. 2b. The value for ΔrGm was positive and that for log![[thin space (1/6-em)]](https://www.rsc.org/images/entities/char_2009.gif) K was negative, indicating that NaNO3 could not exchange lithium in the roasting process. The trend graphs of ΔrGm and log
K was negative, indicating that NaNO3 could not exchange lithium in the roasting process. The trend graphs of ΔrGm and log![[thin space (1/6-em)]](https://www.rsc.org/images/entities/char_2009.gif) K between LiAl(SiO3)2 and Na2SO4. are shown in Fig. 2c; ΔrGm is positive from 25 to 525 °C, and log
K between LiAl(SiO3)2 and Na2SO4. are shown in Fig. 2c; ΔrGm is positive from 25 to 525 °C, and log![[thin space (1/6-em)]](https://www.rsc.org/images/entities/char_2009.gif) K is less than zero within this range, which indicate that the reaction cannot occur spontaneously at 25–525 °C. Interestingly, ΔrGm was negative and the corresponding log
K is less than zero within this range, which indicate that the reaction cannot occur spontaneously at 25–525 °C. Interestingly, ΔrGm was negative and the corresponding log![[thin space (1/6-em)]](https://www.rsc.org/images/entities/char_2009.gif) K value was positive after 525 °C, which indicated that the reaction could occur spontaneously when the temperature increased to 525 °C. Accordingly, Na2SO4 was assumed to be a suitable reagent for roasting.
K value was positive after 525 °C, which indicated that the reaction could occur spontaneously when the temperature increased to 525 °C. Accordingly, Na2SO4 was assumed to be a suitable reagent for roasting.
 | ||
Fig. 2 Calculated ΔrGm and log![[thin space (1/6-em)]](https://www.rsc.org/images/entities/char_2009.gif) K for the reactions as a function of temperature: (a) eqn (4), (b) eqn (5) and (c) eqn (6). K for the reactions as a function of temperature: (a) eqn (4), (b) eqn (5) and (c) eqn (6). | ||
To further prove the reaction possibility of Na2SO4 and slag, the characteristics of the mixture of slag and Na2SO4 at a molar ratio of 1![[thin space (1/6-em)]](https://www.rsc.org/images/entities/char_2009.gif) :
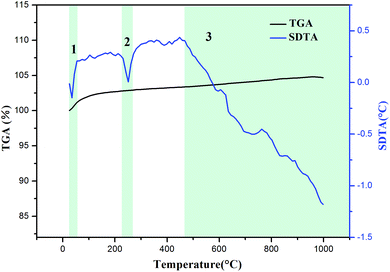
:![[thin space (1/6-em)]](https://www.rsc.org/images/entities/char_2009.gif) 3 were studied by thermogravimetric analysis and simultaneous differential thermal analysis (TGA-SDTA). As shown in Fig. 3, three significant endothermic processes in the SDTA curve are observed at 25–1000 °C. For the first process, the endothermic peak was located at approximately 40 °C and a weight increase was observed from the TGA curve, which could be ascribed to the water absorption behavior of slag. In the second endothermic process, the endothermic peak was at about 250 °C. There was no weight loss observed from the TGA curve, which was attributed to the phase transition of Na2SO4 to rhombic Na2SO4. The third endothermic process occurred from 470 to 1000 °C, where the TGA curve showed no change, indicating that the reaction between Na2SO4 and slag may occur at this stage. Therefore, Na2SO4 was considered as the optimized roasting reagent and the temperature of 470–1000 °C was selected as the best roasting range for lithium extraction, which was in accordance with HSC thermodynamic calculations.
3 were studied by thermogravimetric analysis and simultaneous differential thermal analysis (TGA-SDTA). As shown in Fig. 3, three significant endothermic processes in the SDTA curve are observed at 25–1000 °C. For the first process, the endothermic peak was located at approximately 40 °C and a weight increase was observed from the TGA curve, which could be ascribed to the water absorption behavior of slag. In the second endothermic process, the endothermic peak was at about 250 °C. There was no weight loss observed from the TGA curve, which was attributed to the phase transition of Na2SO4 to rhombic Na2SO4. The third endothermic process occurred from 470 to 1000 °C, where the TGA curve showed no change, indicating that the reaction between Na2SO4 and slag may occur at this stage. Therefore, Na2SO4 was considered as the optimized roasting reagent and the temperature of 470–1000 °C was selected as the best roasting range for lithium extraction, which was in accordance with HSC thermodynamic calculations.
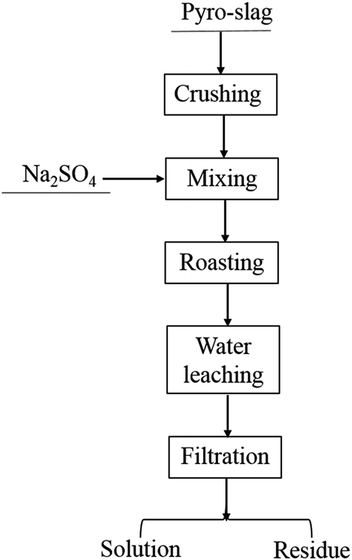
Here, the technological process of roasting and water leaching was employed to discuss the possibility of recovering lithium from pyro-slag. The flow sheet is shown in Fig. 4.
3.3 Roasting procedure
For the roasting procedure, the lithium extraction efficiency was significantly influenced by several operational parameters such as the roasting temperature, roasting duration and molar ratio of Na2SO4/Li. In order to balance the roasting efficiency and cost, the optimization of the roasting conditions is necessary. The leaching conditions were fixed as follows: liquid-to-solid (L/S) mass ratio of 20![[thin space (1/6-em)]](https://www.rsc.org/images/entities/char_2009.gif) :
:![[thin space (1/6-em)]](https://www.rsc.org/images/entities/char_2009.gif) 1, leaching temperature of 25 °C and leaching time of 60 min.
1, leaching temperature of 25 °C and leaching time of 60 min.
![[thin space (1/6-em)]](https://www.rsc.org/images/entities/char_2009.gif) :
:![[thin space (1/6-em)]](https://www.rsc.org/images/entities/char_2009.gif) 1, 2
1, 2![[thin space (1/6-em)]](https://www.rsc.org/images/entities/char_2009.gif) :
:![[thin space (1/6-em)]](https://www.rsc.org/images/entities/char_2009.gif) 1, 3
1, 3![[thin space (1/6-em)]](https://www.rsc.org/images/entities/char_2009.gif) :
:![[thin space (1/6-em)]](https://www.rsc.org/images/entities/char_2009.gif) 1 and 4
1 and 4![[thin space (1/6-em)]](https://www.rsc.org/images/entities/char_2009.gif) :
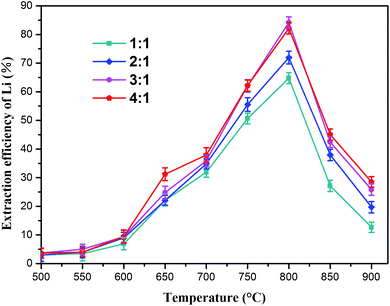
:![[thin space (1/6-em)]](https://www.rsc.org/images/entities/char_2009.gif) 1) on the lithium extraction efficiency was investigated. The results are shown in Fig. 5 (the lithium concentration data are given in Table S1†), which indicate that temperature has a considerable influence on lithium extraction. The extraction rate of lithium increased first and then decreased as the annealing temperature increased. The best roasting temperature was 800 °C at each ratio. As the molar ratio of Na2SO4/Li increased from 1
1) on the lithium extraction efficiency was investigated. The results are shown in Fig. 5 (the lithium concentration data are given in Table S1†), which indicate that temperature has a considerable influence on lithium extraction. The extraction rate of lithium increased first and then decreased as the annealing temperature increased. The best roasting temperature was 800 °C at each ratio. As the molar ratio of Na2SO4/Li increased from 1![[thin space (1/6-em)]](https://www.rsc.org/images/entities/char_2009.gif) :
:![[thin space (1/6-em)]](https://www.rsc.org/images/entities/char_2009.gif) 1 to 3
1 to 3![[thin space (1/6-em)]](https://www.rsc.org/images/entities/char_2009.gif) :
:![[thin space (1/6-em)]](https://www.rsc.org/images/entities/char_2009.gif) 1, the lithium extraction efficiency increased with the increase in the Na2SO4/Li molar ratios at the same temperature. However, excess Na2SO4 (4
1, the lithium extraction efficiency increased with the increase in the Na2SO4/Li molar ratios at the same temperature. However, excess Na2SO4 (4![[thin space (1/6-em)]](https://www.rsc.org/images/entities/char_2009.gif) :
:![[thin space (1/6-em)]](https://www.rsc.org/images/entities/char_2009.gif) 1) had a slight effect on the extraction of lithium within the given temperature range. When the Na2SO4/Li molar ratio of 3
1) had a slight effect on the extraction of lithium within the given temperature range. When the Na2SO4/Li molar ratio of 3![[thin space (1/6-em)]](https://www.rsc.org/images/entities/char_2009.gif) :
:![[thin space (1/6-em)]](https://www.rsc.org/images/entities/char_2009.gif) 1 was used, the lithium extraction reached a maximum (84.2%) at 800 °C. Nevertheless, higher temperatures (800–900 °C) led to reduction in the leachable lithium compounds. This indicated that the reacting ability between Na2SO4 and slag weakened above 800 °C, leading to reduction in soluble lithium.
1 was used, the lithium extraction reached a maximum (84.2%) at 800 °C. Nevertheless, higher temperatures (800–900 °C) led to reduction in the leachable lithium compounds. This indicated that the reacting ability between Na2SO4 and slag weakened above 800 °C, leading to reduction in soluble lithium.
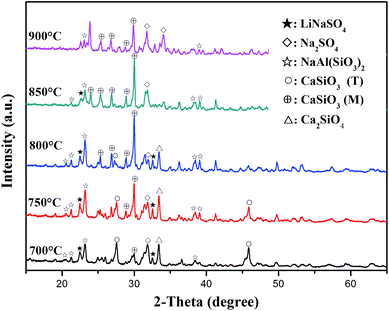
XRD analysis was performed to evaluate the components of the roasted slag. The XRD patterns of the slag and Na2SO4 after roasting with a molar ratio of Na2SO4/Li of 3![[thin space (1/6-em)]](https://www.rsc.org/images/entities/char_2009.gif) :
:![[thin space (1/6-em)]](https://www.rsc.org/images/entities/char_2009.gif) 1 at different temperatures (700–900 °C) are shown in Fig. 6. When the roasting temperature was 700 °C, the main components of the sample were LiNaSO4 (JCPDS file no. 20-0638) and CaSiO3 (T). In addition, small peaks for Ca2SiO4 appeared, which were due to the reaction between CaSiO3 and CaO in the initial slag. It should be noted that the diffraction peaks of CaSiO3 (T) became weaker and the peaks of CaSiO3 (monoclinic, JCPDS file no. 27-0088) appeared as the temperature increased to 750 °C. This behavior may be related to the phase transition of CaSiO3 (T) in slag at high temperatures. The peaks of LiNaSO4 and CaSiO3 (M) became stronger at 800 °C. Meanwhile, the peaks of CaSiO3 (T) disappeared due to the complete phase transformation of CaSiO3 (T). When the roasting temperature increased to 850 °C, the diffraction peaks of LiNaSO4 became weaker and the peaks of Na2SO4 (JCPDS file no. 24-1132) appeared. The main phases were CaSiO3 (M) and Na2SO4 containing a small amount of LiNaSO4 at this temperature. As the temperature increased to 900 °C, the diffraction peaks of LiNaSO4 almost disappeared and the peaks of Na2SO4 obviously increased, which can be attributed to the weaker reactivity of Na2SO4 at 800–900 °C. The appearance of LiNaSO4 in the roasted products indicated that the insoluble lithium in the original slag was transformed to a soluble structure during the roasting process. Accordingly, water leaching is an effective way to extract lithium from roasted products. Moreover, the trend for the peak intensity of LiNaSO4 with temperature was positively associated with the change in the lithium extraction efficiency (Fig. 5).
1 at different temperatures (700–900 °C) are shown in Fig. 6. When the roasting temperature was 700 °C, the main components of the sample were LiNaSO4 (JCPDS file no. 20-0638) and CaSiO3 (T). In addition, small peaks for Ca2SiO4 appeared, which were due to the reaction between CaSiO3 and CaO in the initial slag. It should be noted that the diffraction peaks of CaSiO3 (T) became weaker and the peaks of CaSiO3 (monoclinic, JCPDS file no. 27-0088) appeared as the temperature increased to 750 °C. This behavior may be related to the phase transition of CaSiO3 (T) in slag at high temperatures. The peaks of LiNaSO4 and CaSiO3 (M) became stronger at 800 °C. Meanwhile, the peaks of CaSiO3 (T) disappeared due to the complete phase transformation of CaSiO3 (T). When the roasting temperature increased to 850 °C, the diffraction peaks of LiNaSO4 became weaker and the peaks of Na2SO4 (JCPDS file no. 24-1132) appeared. The main phases were CaSiO3 (M) and Na2SO4 containing a small amount of LiNaSO4 at this temperature. As the temperature increased to 900 °C, the diffraction peaks of LiNaSO4 almost disappeared and the peaks of Na2SO4 obviously increased, which can be attributed to the weaker reactivity of Na2SO4 at 800–900 °C. The appearance of LiNaSO4 in the roasted products indicated that the insoluble lithium in the original slag was transformed to a soluble structure during the roasting process. Accordingly, water leaching is an effective way to extract lithium from roasted products. Moreover, the trend for the peak intensity of LiNaSO4 with temperature was positively associated with the change in the lithium extraction efficiency (Fig. 5).
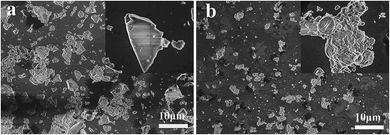
The SEM image of the initial slag after being reground by a planetary ball mill is shown in Fig. 7a. It can be seen that the particles exhibit a smooth surface with diameters from 1 to 5 μm. Fig. 7b shows the SEM image of the calcined mixture of pyro-slag and Na2SO4. Clearly, the particle size after sodium roasting was smaller than that of the initial slag. Moreover, the uneven and porous nature of the surface was observed after calcination.
![[thin space (1/6-em)]](https://www.rsc.org/images/entities/char_2009.gif) :
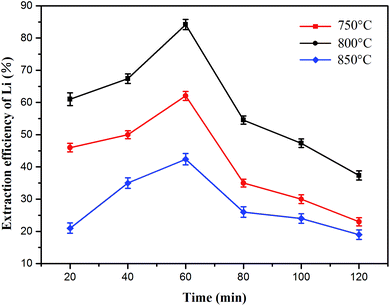
:![[thin space (1/6-em)]](https://www.rsc.org/images/entities/char_2009.gif) 1) at various temperatures (750 °C, 800 °C and 850 °C) is shown in Fig. 8 and the lithium concentration data are shown in Table S2.† The curves for the lithium extraction efficiency showed almost the same trends at different roasting temperatures. As the roasting time increased from 20 to 60 min, the efficiency of lithium extraction had a positive correlation with the roasting time. However, the opposite trend appeared at 60–120 min. The lithium recovery rate reached a maximum of 84.2% under the following conditions: roasting time of 60 min and roasting temperature of 800 °C. Therefore, the roasting time was set at 60 min in the subsequent experiments.
1) at various temperatures (750 °C, 800 °C and 850 °C) is shown in Fig. 8 and the lithium concentration data are shown in Table S2.† The curves for the lithium extraction efficiency showed almost the same trends at different roasting temperatures. As the roasting time increased from 20 to 60 min, the efficiency of lithium extraction had a positive correlation with the roasting time. However, the opposite trend appeared at 60–120 min. The lithium recovery rate reached a maximum of 84.2% under the following conditions: roasting time of 60 min and roasting temperature of 800 °C. Therefore, the roasting time was set at 60 min in the subsequent experiments.
3.4 Water leaching procedure
To investigate the effect of leaching temperature, leaching time and L/S mass ratio on the lithium extraction efficiency, typical leaching tests at different conditions were conducted. The conditions for the roasting product were fixed: Na2SO4/Li molar ratio of 3![[thin space (1/6-em)]](https://www.rsc.org/images/entities/char_2009.gif) :
:![[thin space (1/6-em)]](https://www.rsc.org/images/entities/char_2009.gif) 1 and roasting temperature of 800 °C for 60 min.
1 and roasting temperature of 800 °C for 60 min.
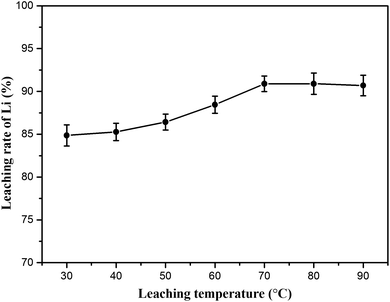
![[thin space (1/6-em)]](https://www.rsc.org/images/entities/char_2009.gif) :
:![[thin space (1/6-em)]](https://www.rsc.org/images/entities/char_2009.gif) 1) and leaching time (60 min) were fixed. As shown in Fig. 9 (lithium concentration data are given in Table S3†), the results reveal that the leaching temperature has considerable influence on lithium recovery. The lithium extraction efficiency increased from 84.86 to 90.89% in the experimental temperature range. Here, 70 °C was recommended as the optimum leaching temperature for energy consumption.
1) and leaching time (60 min) were fixed. As shown in Fig. 9 (lithium concentration data are given in Table S3†), the results reveal that the leaching temperature has considerable influence on lithium recovery. The lithium extraction efficiency increased from 84.86 to 90.89% in the experimental temperature range. Here, 70 °C was recommended as the optimum leaching temperature for energy consumption.
Additionally, the effect of leaching time was investigated from 20 to 120 min; the leaching temperature (70 °C) and L/S mass ratio (20![[thin space (1/6-em)]](https://www.rsc.org/images/entities/char_2009.gif) :
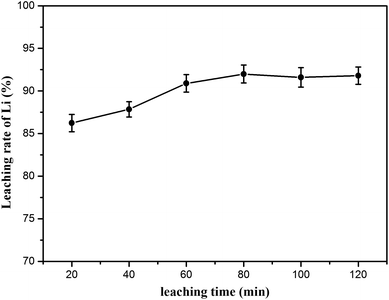
:![[thin space (1/6-em)]](https://www.rsc.org/images/entities/char_2009.gif) 1) were fixed. The lithium extraction was positively correlated with the leaching time, as shown in Fig. 10. It was clear that the leaching time of 80 min resulted in the maximum recovery of lithium, in which 91.98% of lithium was recovered after leaching (lithium concentration data are given in Table S4†).
1) were fixed. The lithium extraction was positively correlated with the leaching time, as shown in Fig. 10. It was clear that the leaching time of 80 min resulted in the maximum recovery of lithium, in which 91.98% of lithium was recovered after leaching (lithium concentration data are given in Table S4†).
![[thin space (1/6-em)]](https://www.rsc.org/images/entities/char_2009.gif) :
:![[thin space (1/6-em)]](https://www.rsc.org/images/entities/char_2009.gif) 1 to 50
1 to 50![[thin space (1/6-em)]](https://www.rsc.org/images/entities/char_2009.gif) :
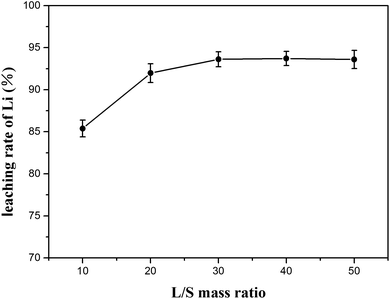
:![[thin space (1/6-em)]](https://www.rsc.org/images/entities/char_2009.gif) 1 at 70 °C for 80 min. The results are plotted in Fig. 11 with the lithium concentration data given in Table S5.† The lithium extraction efficiency showed slight increase as the mass ratio of L/S increased; when the ratio was 30
1 at 70 °C for 80 min. The results are plotted in Fig. 11 with the lithium concentration data given in Table S5.† The lithium extraction efficiency showed slight increase as the mass ratio of L/S increased; when the ratio was 30![[thin space (1/6-em)]](https://www.rsc.org/images/entities/char_2009.gif) :
:![[thin space (1/6-em)]](https://www.rsc.org/images/entities/char_2009.gif) 1, the extraction efficiency of lithium increased to 93.62% and remained stable at the subsequent ratios. Since a higher L/S ratio in the water leaching process indicates that more energy is consumed in the subsequent liquid recovery, the L/S ratio of 30
1, the extraction efficiency of lithium increased to 93.62% and remained stable at the subsequent ratios. Since a higher L/S ratio in the water leaching process indicates that more energy is consumed in the subsequent liquid recovery, the L/S ratio of 30![[thin space (1/6-em)]](https://www.rsc.org/images/entities/char_2009.gif) :
:![[thin space (1/6-em)]](https://www.rsc.org/images/entities/char_2009.gif) 1 seemed to be advisable.
1 seemed to be advisable.
For the water-leaching process, the optimal conditions were experimentally determined to be 70 °C for 80 min using a liquid-to-solid (L/S) mass ratio of 30![[thin space (1/6-em)]](https://www.rsc.org/images/entities/char_2009.gif) :
:![[thin space (1/6-em)]](https://www.rsc.org/images/entities/char_2009.gif) 1 to yield a maximum of 93.62% lithium recovery.
1 to yield a maximum of 93.62% lithium recovery.
3.5 Recovery mechanism
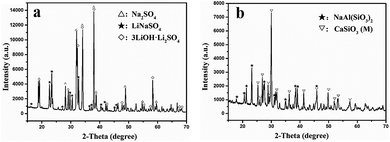
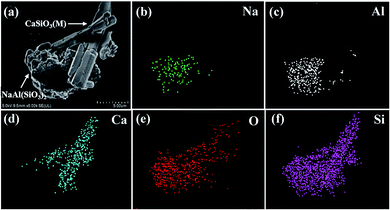
To analyze the mechanism of lithium extraction by Na2SO4, the phase analysis of the leaching solution and leached residue is shown in Fig. 12. The XRD pattern of the product by the evaporation of the leaching solution is depicted in Fig. 12a. The peaks of Na2SO4, LiNaSO4 and 3LiOH·Li2SO4 are observed, indicating that insoluble lithium in slag has been transformed into soluble lithium compounds by roasting. The peaks of NaAl(SiO3)2 (JCPDS file no. 46-0012) and CaSiO3 (M) in the leached residue were observed (Fig. 12b). It was obvious that CaSiO3 had a crystal phase transition from triclinic in the initial slag to monoclinic in the leached residue. The peaks of LiAl(SiO3)2 in the initial slag disappeared completely and those for NaAl(SiO3)2 appeared, indicating that sodium in Na2SO4 was fixed in the solid phase by roasting.Fig. 13a–f show the SEM images of the leached residue and the corresponding EDS mapping. From Fig. 13e and f, it can be observed that the distribution of Si and O is homogeneous in the whole imaging area of the corresponding SEM image. Additionally, the Na and Al elements are mainly distributed in the bottom area of the images, as shown in Fig. 13b and c, indicating the existence of NaAl(SiO3)2. The uneven and porous surface of NaAl(SiO3)2 is observed in Fig. 13a. Furthermore, the rod-like morphology of the Ca element is observed in Fig. 13d, which corresponds to the same morphology in Fig. 13a. The observation indicates the CaSiO3 (M) in leached residue presents a rod-like morphology. Based on the above analysis, it was concluded that NaAl(SiO3)2 and CaSiO3 (M) existed in the leached residue simultaneously, which was in accordance with the results of XRD in Fig. 12a.
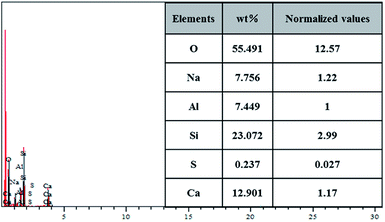
The chemical composition of the leached residue was analyzed by EDS. As shown in Fig. 14, the elements of O, Na, Al, Si, S and Ca are detected on the surface. The mass fraction and the normalized molecular numbers of each element are listed in the inset of Fig. 14. It is worth noting that the presence of S in the sample could be attributed to the adsorption of excess Na2SO4 on porous NaAl(SiO3)2, which was hard to leach. Based on the comparison of the results after normalization for different elements, the results revealed that the stoichiometric proportion of O, Na, Al, Si, S and Ca was in accordance with the composition of NaAl(SiO3)2, CaSiO3 (M) and Na2SO4, which was consistent with the XRD and SEM results.
According to above analysis, an ion exchange mechanism was proposed for the process of salt roasting, where the insoluble lithium in initial pyro-slag was exchanged with Na+ to convert to soluble lithium and was then recovered by water. The schematic diagram of the ion exchange process for lithium is shown in Fig. 15.
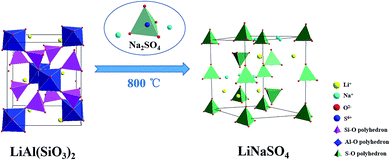 | ||
| Fig. 15 Schematic of insoluble lithium conversion into soluble lithium with the additive Na2SO4 by roasting. | ||
4. Conclusion
In conclusion, the strategy of recycling lithium from the simulated pyro-slag of spent LIBs by salt roasting and water leaching was studied. The main components of the simulated slag used in this work were LiAl(SiO3)2 and CaSiO3. Na2SO4 was optimized as the proper sodium roasting reagent compared to NaCl and NaNO3. When the slag and Na2SO4 were mixed with an Na2SO4/Li molar ratio of 3![[thin space (1/6-em)]](https://www.rsc.org/images/entities/char_2009.gif) :
:![[thin space (1/6-em)]](https://www.rsc.org/images/entities/char_2009.gif) 1 and calcined at 800 °C for 60 min with water leaching at 70 °C for 80 min and a mass ratio of L/S of 30
1 and calcined at 800 °C for 60 min with water leaching at 70 °C for 80 min and a mass ratio of L/S of 30![[thin space (1/6-em)]](https://www.rsc.org/images/entities/char_2009.gif) :
:![[thin space (1/6-em)]](https://www.rsc.org/images/entities/char_2009.gif) 1, the lithium recovery rate reached 93.62%. Further research suggested that insoluble lithium in slag was transformed into soluble lithium by ion exchange at high temperatures.
1, the lithium recovery rate reached 93.62%. Further research suggested that insoluble lithium in slag was transformed into soluble lithium by ion exchange at high temperatures.
Conflicts of interest
There are no conflicts of interest to declare.Acknowledgements
This work was financially supported by the National Natural Science Foundation of China [21276022].References
- Q. Meng, Y. Zhang and P. Dong, Waste Manag., 2017, 64, 214–218 CrossRef CAS PubMed.
- X. Zeng, J. Li and L. Liu, Renewable Sustainable Energy Rev., 2015, 52, 1759–1767 CrossRef CAS.
- N. Bahaloo-Horeh and S. M. Mousavi, Waste Manag., 2017, 60, 666–679 CrossRef CAS PubMed.
- V. T. Luong, D. J. Kang, J. W. An, D. A. Dao, M. J. Kim and T. Tran, Hydrometallurgy, 2014, 141, 8–16 CrossRef CAS.
- S. Manzetti and F. Mariasiu, Renewable Sustainable Energy Rev., 2015, 51, 1004–1012 CrossRef CAS.
- B. Huang, Z. Pan, X. Su and L. An, J. Power Sources, 2018, 399, 274–286 CrossRef CAS.
- B. Swain, Sep. Purif. Technol., 2017, 172, 388–403 CrossRef CAS.
- T. Hoshino, Fusion Eng. Des., 2013, 88, 2956–2959 CrossRef CAS.
- K. Richa, C. W. Babbitt, G. Gaustad and X. Wang, Resour., Conserv. Recycl., 2014, 83, 63–76 CrossRef.
- L. Gaines, Sustainable Mater. Technol., 2014, 1, 2–7 CrossRef.
- G. H. Broadbent, D. Drozdzewski and G. Metternicht, Geography Compass, 2018, 12, e12358 CrossRef.
- X. Zhang, L. Li, E. Fan, Q. Xue, Y. Bian, F. Wu and R. Chen, Chem. Soc. Rev., 2018, 47, 7239–7302 RSC.
- H. Li, S. Xing, Y. Liu, F. Li, H. Guo and G. Kuang, ACS Sustainable Chem. Eng., 2017, 5, 8017–8024 CrossRef CAS.
- G. Nayaka, J. Manjanna, K. Pai, R. Vadavi, S. Keny and V. Tripathi, Hydrometallurgy, 2015, 151, 73–77 CrossRef CAS.
- G. Nayaka, K. Pai, G. Santhosh and J. Manjanna, Hydrometallurgy, 2016, 161, 54–57 CrossRef CAS.
- W. Liu, T. Yang, D. Zhang, L. Chen and Y. Liu, JOM, 2014, 66, 1694–1700 CrossRef CAS.
- T. Tirronen, D. Sukhomlinov, H. O'Brien, P. Taskinen and M. Lundström, J. Cleaner Prod., 2017, 168, 399–409 CrossRef CAS.
- W. Lv, Z. Wang, H. Cao, Y. Sun, Y. Zhang and Z. Sun, ACS Sustainable Chem. Eng., 2018, 6, 1504–1521 CrossRef CAS.
- G.-x. Ren, S.-w. Xiao, M.-q. Xie, P. Bing, C. Jian, F.-g. Wang and X. Xing, Trans. Nonferrous Met. Soc. China, 2017, 27, 450–456 CrossRef CAS.
- S. Xiao, G. Ren, M. Xie, B. Pan, Y. Fan, F. Wang and X. Xia, Journal of Sustainable Metallurgy, 2017, 3, 703–710 CrossRef.
- C. W. Purnomo, E. P. Kesuma, I. Perdana and M. Aziz, Waste Manag., 2018, 79, 454–461 CrossRef CAS PubMed.
- T. Georgi-Maschler, B. Friedrich, R. Weyhe, H. Heegn and M. Rutz, J. Power Sources, 2012, 207, 173–182 CrossRef CAS.
- A. Chagnes and J. Swiatowska, Lithium process chemistry: Resources, extraction, batteries, and recycling, Elsevier, 2015 Search PubMed.
- S. Al-Thyabat, T. Nakamura, E. Shibata and A. Iizuka, Miner. Eng., 2013, 45, 4–17 CrossRef CAS.
- Y. Chen, N. Liu, F. Hu, L. Ye, Y. Xi and S. Yang, Waste Manag., 2018, 75, 469–476 CrossRef CAS PubMed.
- S. Ziemann, M. Weil and L. Schebek, Resour., Conserv. Recycl., 2012, 63, 26–34 CrossRef.
- K. Karmazínová, T. Kazda and K. Jandova, ECS Trans., 2017, 81, 255–260 CrossRef.
- H. Dang, B. Wang, Z. Chang, X. Wu, J. Feng, H. Zhou, W. Li and C. Sun, ACS Sustainable Chem. Eng., 2018, 6, 13160–13167 CrossRef CAS.
- R. B. Ellestad and F. F. Clarke, Extraction of lithium from its ores, Min. Eng., 1955, 7, 1045–1047 Search PubMed.
- Q. Yan, X. Li, Z. Wang, X. Wu, J. Wang, H. Guo, Q. Hu and W. Peng, Int. J. Miner. Process., 2012, 110, 1–5 CrossRef.
- V. T. Luong, D. J. Kang, J. W. An, M. J. Kim and T. Tran, Hydrometallurgy, 2013, 134, 54–61 CrossRef.
- M. B. Guerrero, J. S. Gutiérrez, M. M. Zaragoza, A. L. Ortiz and V. Collins-Martínez, Int. J. Hydrogen Energy, 2016, 41, 23232–23237 CrossRef.
- A. Roine, HSC 6.0 Chemistry. Chemical reactions and Equilibrium software with extensive thermochemical database and Flowsheet simulation, Outokumpu Research Oy Information Center, Pori, 2006 Search PubMed.
- L. I. Barbosa, J. A. González and M. del Carmen Ruiz, Thermochim. Acta, 2015, 605, 63–67 CrossRef CAS.
- D. Cheret and S. Santen, Battery recycling, US Pat. US7169206A1, January 30, 2007.
- B. Swain, Sep. Purif. Technol., 2017, 172, 388–403 CrossRef CAS.
Footnote |
| † Electronic supplementary information (ESI) available: See DOI: 10.1039/c9ra03754c |
| This journal is © The Royal Society of Chemistry 2019 |

