Formation of small clusters of NaCl dihydrate in the gas phase†
Juan-José
García
a,
Raymundo
Hernández-Esparza
a,
Rubicelia
Vargas
 a,
William
Tiznado
b and
Jorge
Garza
 *a
*a
aDepartamento de Química, División de Ciencias Básicas e Ingeniería, Universidad Autónoma Metropolitana-Iztapalapa, San Rafael Atlixco 186, Col. Vicentina. Iztapalapa. C. P., 09340, Ciudad de México, Mexico. E-mail: jgo@xanum.uam.mx
bDepartamento de Ciencias Químicas, Facultad de Ciencias Exactas, Universidad Andres Bello, República 275, Santiago, Chile
First published on 8th February 2019
Abstract
Isomers of (NaCl)n(H2O)2n clusters, with n = 1, 2 and 4, were investigated using an implementation of the simulated annealing method that imposes a virtual confinement on each isomer to stay within a sphere with an arbitrary radius. By using several confinement radii, we reported 2, 56 and 38 isomers for n = 1, 2 and 4, respectively. For n = 1, the CCSD(T)/aug-cc-pVTZ method was used as a reference by optimizing the corresponding isomers. These results were contrasted with those obtained by the MP2 method and eight exchange–correlation functionals: PBE, PBE0, B3LYP, PBE-D3, PBE0-D3, B3LYP-D3, LC-ωPBE and M06-2X. From this analysis we conclude that the M06-2X method gives reliable results and then, isomers with n = 2 and 4 were analyzed with this exchange–correlation functional. From the analysis of these two systems, the resulting isomers with the lowest energy showed cuboid structures and no breaking bond was present for NaCl molecules. Thus, in the nucleation process of the NaCl dihydrate our results suggest that the Na–Cl bond is present. Besides, bond length and electron density evaluated at bond critical points for the biggest system delivered values close to those found in the crystal structure.
1 Introduction
The interaction between NaCl and water molecules has been the key to understand the dissociation of this kind of salt.1–7 In many reports the proportion of water-molecules/NaCl is high. This difference between the number of molecules of solvent and solute is used to find the number of water molecules needed to dissociate one NaCl molecule. However, there are studies where this proportion is minimal; for example, there are reports where this relation is 2 H2O molecules to 1 NaCl molecule. In these cases, no dissociation is observed, and the NaCl contact is present. Such reports are related to the crystal phase, where the NaCl dihydrate is analyzed experimentally by calorimetry and crystallographic techniques.8,9 This system is quite interesting since it is part of sea-salt aerosols, which in principle could affect the ozone shield in the Earth's stratosphere.8 Therefore, the processes involved in the formation of small clusters in this system are essential to understand their nucleation10 or to elucidate the stabilizing forces needed since they could compete with the creation of other species.11To date, theoretical methods based on the wave-function12 or density functional theory (DFT)13 have not been used to analyze the NaCl dihydrate in the crystal phase or (NaCl)n(H2O)2n clusters with n > 1. Evidently, for this kind of system, DFT is the most appropriate method since wave-function methods are computationally expensive, even for clusters with n = 2. For NaCl(H2O)2, there are several theoretical reports based mainly on wave-function techniques. Very recently, Hou et al.6 studied several NaCl(H2O)m clusters. For m = 2, they report geometries and relative energies using the CCSD(T)/aug-cc-pVTZ method over LC-ωPBE/6-311++G(d,p) geometries. For similar isomers, the B3LYP exchange–correlation functional has been used with 6-31+G(d,p)1 and 6-311++G(d,p) basis sets.2
The aim of this article is the study of (NaCl)n(H2O)2n clusters with n = 1, 2 and 4 using quantum chemistry methods to obtain candidates from these clusters to global minima. For this purpose, we have implemented a version of the simulated annealing method to explore their potential energy surface. This approach allows the estimation of the probability to find such isomers in the gas phase for several temperatures. Besides, we have elucidated Na–Cl, Na–O and Cl–H contacts involved in each isomer by using the atoms in molecules approach14,15 and comparing their characteristics with those observed in the experimental structure, where we applied DFT to analyze the corresponding electronic density.
2 Methods
In this article, we use DFT in its Kohn–Sham (KS)16 version to study the electronic structure of NaCln(H2O)2n clusters with n = 1, 2 and 4. Isomer selection is an issue in theoretical chemistry since they are sometimes proposed by using chemical intuition, which does not always work appropriately. Consequently, for this purpose, we use the Restricted Isomers Searching by Simulated Annealing (RISSA) program to explore the potential energy surface, which was developed in our group and is based mainly on the simulated annealing method (SAM)17,18 imposing spatial restrictions in the search for the corresponding isomers. In RISSA, the system is defined by a user through fragments, where an atom, a molecule or a surface represent fragments. For example, in this article the (NaCl)2(H2O)4 system is built by 6 pieces; two NaCl molecules and four water molecules. When RISSA launches the SAM, each fragment is translated and rotated randomly by imposing non-overlap between fragments and satisfying one of the three spatial restrictions implemented in RISSA. Only one restriction implemented in this code is related to this article; the corresponding system, or parts of it, cannot escape from a sphere defined by a user. From here, SAM is applied under the conditions that all fragments are within the sphere defined by the user. RISSA can also build isomers under translational symmetry to create crystals or surfaces. Therefore, these spatial restrictions are linked with periodic boundary conditions. These restrictions are useful in solid-state chemistry and catalysis applications. However, in this article we do not use this kind of restriction.As we know, SAM is based on a cost function, while at this moment, RISSA uses several cost functions. In this article, the PM7 method implemented in MOPAC16 is used as an objective function,19 although we have implemented Lennard-Jones potentials20 and the maximum matching of the Fukui functions21 as additional cost functions. The implementation of other cost functions is straightforward in RISSA.
For the isomers considered in this work, we used three different values for the sphere radius (3.0, 3.5 and 4.0 Å for NaCl(H2O)2; 3.5, 4.0 and 4.5 Å for NaCl2(H2O)4 and 4.0, 4.5 and 5.0 Å for NaCl4(H2O)8). For these cases, SAM started at a temperature of 500, which was then reduced to 0.0001 by using T = T0![[thin space (1/6-em)]](https://www.rsc.org/images/entities/char_2009.gif) exp(−kα/N). In this expression, k represents the step in the iterative process, α = 0.3 is used from ref. 22 and N is the dimensionality of the system. Using this procedure, isomers with relative energy less than 10 kcal mol−1, as for their putative global minimum, were considered to be optimized with KS methods.
exp(−kα/N). In this expression, k represents the step in the iterative process, α = 0.3 is used from ref. 22 and N is the dimensionality of the system. Using this procedure, isomers with relative energy less than 10 kcal mol−1, as for their putative global minimum, were considered to be optimized with KS methods.
Eight exchange–correlation functionals, PBE,23 PBE-D3,24 PBE0,25 PBE0-D3,24 B3LYP,26 B3LYP-D3,24 LC-ωPBE27 and M06-2X,28 were tested for the NaCl(H2O)2 cluster. In this way, we analyzed the performance of exchange–correlation functionals of different natures. Thus, we have GGA, hybrid, and meta-GGA exchange–correlation functionals including in some cases dispersion effects.29 The results of these functionals were contrasted with those obtained by the CCSD(T) method. For this cluster, 6-311++G(d,p)30 and aug-cc-pVTZ31 basis sets were coupled with all methods. For the rest of the systems, the M06-2X/6-311++G(d,p) method was applied over all the structures proposed by SAM. The minima of all isomers were confirmed by frequency analysis. All calculations were carried out via the NWChem v6.0 suite code.32 The electronic structure analysis of the crystal was considered in this article and it was performed using the CRYSTAL14 code33 with 1170 k-points over the experimental structure.9
The connectivity in each isomer was determined through the bond paths delivered by the atoms in molecules (AIM) approach.14,15 For this method, all critical points (rc) of the electron density that satisfy
| ∇ρ(rc) = 0, | (1) |
3 Results
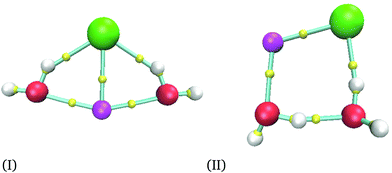
For the smallest system considered in this work, NaCl(H2O)2, and according to the procedure mentioned in the last section, we obtained 36 isomers as possible minima. After the optimization process for each candidate, we obtained only two different isomers depicted in Fig. 1. As we mentioned previously, the AIM analysis provided the connectivity presented in all figures, where the smallest spheres represent bond critical points. The structures obtained by the M06-2X functional were re-optimized by using MP2 and CCSD(T) methods. Two basis sets were used for all methods in this system. The corresponding CCSD(T) structures are reported in the ESI.†Relative energies between these two isomers are reported in Table 1, where eV are used as energy units to compare with another report. However, kcal mol−1 are the energy units used in the rest of this article. From Table 1, we can see that our results produce similar conclusions to those reported by Hou et al. even when they use KS geometries.6 From this table, it is clear that the PBE exchange–correlation functional gives the worst results; thus, we do not recommend this functional to study these systems. This conclusion is confirmed with a recent report where NaCl in liquid water is analyzed by using several exchange–correlation functionals and the MP2 method;38 in that report, PBE and BLYP39,40 results are the most significant ones concerning the MP2 method and they cannot reproduce other properties accurately. In this article, the best results are obtained from PBE0 and M06-2X exchange–correlation functionals for the largest basis set, although PBE0 results are deteriorated if this exchange–correlation functional uses the smallest basis set. From here, we decided to use the M06-2X exchange–correlation functional for n = 2 and 4, since this functional gives a good comparison with the CCSD(T) method even for the smallest basis set. We would like to end this comparison mentioning that MP2 produces impressive results by their proximity to those delivered by CCSD(T). Remember that for this system the CCSD(T) was used to optimize the two NaCl(H2O)2 isomers, and the results obtained by MP2 are similar to those provided by our reference. From this discussion, we will discuss only results related to the M06-2X method.
| Isomer | CCSD(T) | MP2 | PBE-D3 | PBE | PBE0-D3 | PBE0 | B3LYP-D3 | B3LYP | M06-2X | LC-ωPBE |
|---|---|---|---|---|---|---|---|---|---|---|
| aug-cc-pVTZ | ||||||||||
| I | 0.0 | 0.0 | 0.0 | 0.072 | 0.0 | 0.0 | 0.0 | 0.0 | 0.0 | 0.0 |
| II | 0.091 | 0.097 | 0.011 | 0.0 | 0.034 | 0.112 | 0.022 | 0.051 | 0.118 | 0.065 |
| 6-311++G(d,p) | ||||||||||
| I | 0.0 | 0.0 | 0.094 | 0.053 | 0.057 | 0.0 | 0.0 | 0.0 | 0.0 | 0.0 |
| II | 0.115 | 0.109 | 0.0 | 0.0 | 0.0 | 0.047 | 0.008 | 0.037 | 0.100 | 0.048 |
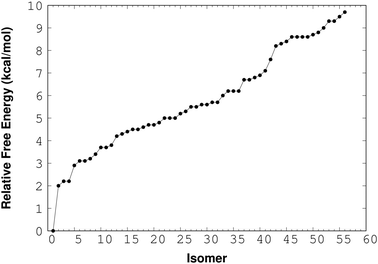
For the (NaCl)2(H2O)4 cluster, RISSA delivered 150 isomers and after the optimization process with the M06-2X/6-311++G(d,p) method we found 36 isomers with relative energy less than 10 kcal mol−1. The relative-energy behavior of these isomers is presented in Fig. 2. From here, it is clear that there is an important number of isomers within this energy range. However, the isomer with the lowest energy shows an energy gap of about 2 kcal mol−1 from the next one. This result indicates an excellent possibility to find this isomer in the gas phase. It is important to mention that the energy used in this analysis contains the zero point energy (ZPE).
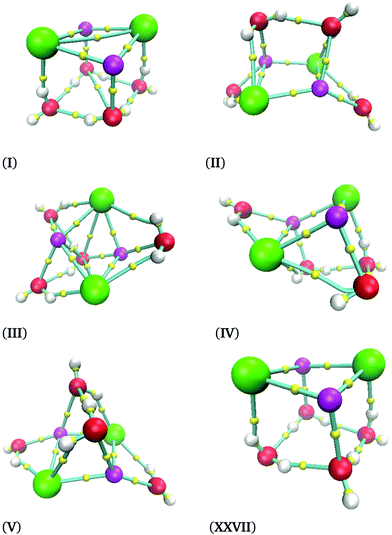
In Fig. 3, we present six (NaCl)2(H2O)4 isomers. The label of each isomer corresponds to the relative-energy ordering. Thus, the isomer (NaCl)2(H2O)4-I has the lowest energy associated with it. As a conclusion, we can state that we always found Na–Cl contacts, indicating that the ion pair is preserved. In other words, four water molecules are not capable of dissociating the Na–Cl. The lowest energy isomer, (NaCl)2(H2O)4-I, shows that two NaCl molecules create a quadrilateral. This result coincides with the experimental observation reported for the NaCl dimer; this system forms a rhombus.41
In Fig. 3 there is an interesting situation between isomers (NaCl)2(H2O)4-I and (NaCl)2(H2O)4-XXVII; the relative free energy between these isomers is 5.5 kcal mol−1. However, both structures have a similar molecular structure: a distorted cube. One face of this cube is built with two NaCl molecules, and the opposite face to it has oxygen atoms at the vertexes. The main difference is related to the orientation of the hydrogen atoms in two water molecules. Such a subtle difference induces a significant energy difference. We are uncertain to find both isomers by chemical intuition because the geometrical difference is minimal.
For the (NaCl)4(H2O)8 cluster, thirty eight isomers were optimized with the M06-2X/6-311++G(d,p) method. The corresponding relative free energy ordering is reported in Fig. 4. In this figure, there are only 18 isomers between 0 and 10 kcal mol−1, the rest of the isomers are above this interval, although the 38 structures are reported in the ESI.† The impact of the temperature on this property is also presented in this plot for three temperatures: 0, 100 and 300 K. From this figure, there is one important conclusion; the temperature is not relevant for the lowest lying free energy isomers, and consequently the isomer with the lowest free energy found by RISSA prevails for this range of temperature. Besides, there is a large relative free energy between the lowest value and the remainder of the isomers.
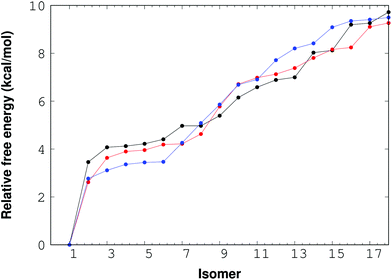 | ||
| Fig. 4 Free energy for the (NaCl)4(H2O)8 cluster. Points and lines in black, red and blue represent the 0 K, 100 K and 300 K temperatures respectively. | ||
The isomer with the lowest energy for the (NaCl)4(H2O)8 cluster is depicted in Fig. 5. In this case, the connectivity was also obtained by using the bond paths delivered by the AIM approach. In this figure, we tried to use the best view to show that NaCl molecules form a slightly distorted cube. This result is striking since it indicates that in early stages of the nucleation of NaCl–water clusters, the proportion 1![[thin space (1/6-em)]](https://www.rsc.org/images/entities/char_2009.gif) :
:![[thin space (1/6-em)]](https://www.rsc.org/images/entities/char_2009.gif) 2 is not enough to break the Na–Cl bond, and that a Na–Cl cube appears instead of this breaking.
2 is not enough to break the Na–Cl bond, and that a Na–Cl cube appears instead of this breaking.
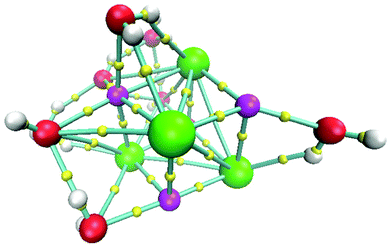 | ||
| Fig. 5 Lowest energy structure for the system (NaCl)4(H2O)8 at 0 K. Chlorine atoms in green, sodium atoms in magenta, oxygen atoms in red, hydrogen atoms in white and bond critical points in yellow. | ||
The cube formation in our study has two precedents. The analysis of the Na4Cl4 cluster was characterized by experimental X-ray spectra, and a distorted cube was determined as the most probable structure.42 Besides, Liu et al. found cuboid structures for the (NaCl)3(H2O)6 cluster.43 Therefore, our proposal as global minima for (NaCl)2(H2O)4 and (NaCl)4(H2O)8 coincides with cuboid structures found in similar systems. In summary, not only does the Na–Cl breaking bond not exist, but such a contact is present in our clusters and the isomer with the lowest energy form cubes. The next four structures in relative-energy ordering are presented in Fig. 6 where it is clear that a NaCl cube is not present, contrary to the result obtained for the isomer with the lowest energy. We conclude that cuboid structures stabilize these systems.
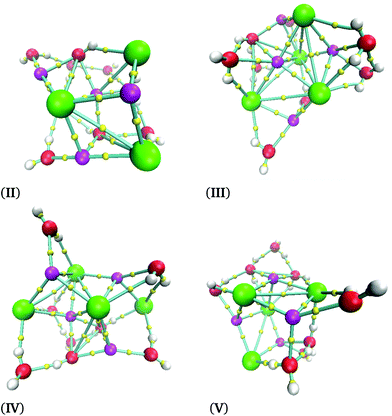 | ||
| Fig. 6 Isomers obtained for the (NaCl)4(H2O)8 cluster obtained using the M06-2X/6-311++G(d,p) method at 0 K. | ||
At this point, we have discussed relative free energy ordering for (NaCl)n(H2O)2n clusters with n = 1, 2 and 4. However, it is necessary to evaluate the free energy involved in the formation process
| nNaCl + 2nH20 → (NaCl)n(H2O)2n. | (2) |
This energy change is reported in Table 2 for the most stable isomers found in this article for n = 1, 2 and 4 at 298 K. From these results we can undoubtedly state that the (NaCl)n(H2O)2n clusters with n = 1, 2 and 4 can be found in the gas phase, with a high probability of cuboid structures.
| Isomer | n | ||
|---|---|---|---|
| 1 | 2 | 4 | |
| I | −19.7 | −63.3 | −148.2 |
| II | −17.3 | −62.3 | −145.4 |
| III | −62.0 | −145.1 | |
| IV | −61.6 | −144.8 | |
| V | −61.6 | −144.7 | |
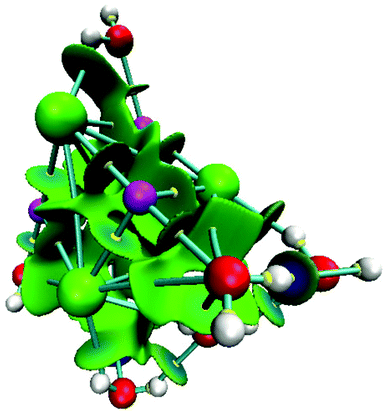
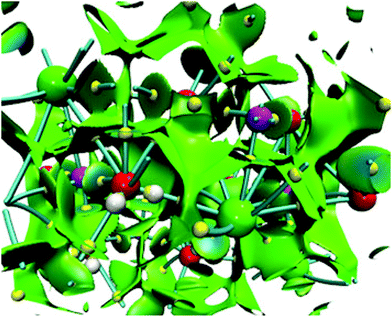
For NaCl–water clusters we expect non-covalent interactions since Na and Cl form an ionic bond. Due to this, the non-covalent interaction index (NCI) was used in this article to study the contacts involved in these clusters. The NCI for the isomer with the lowest energy of the (NaCl)4(H2O)8 cluster is presented in Fig. 7.
From this figure, the non-covalent interaction between Na and Cl is evident. Although this is an expected result, we show this interaction through the NCI because charged atoms induce the ionic bond, and consequently, the electron density is small at the bond critical point. Naturally, NaCl–water and water–water contacts form non-covalent interactions. According to our color scale, there are several strong non-covalent interactions; Na⋯Cl, Na⋯O, Cl⋯H, and O⋯H are contacts we can find in this kind of cluster. For this case, we did not observe red color over this surface indicating that this system exhibits only attractive interactions. All contacts mentioned in this paragraph show blue color on the NCI surface suggesting stronger interactions in these contacts. This result is in accordance with the values exhibited by the formation-free-energy of these clusters.
For the isomers of (NaCl)n(H2O)2n (n = 1, 2, 4) presented in Fig. 1, 3, 5 and 6, the electron density evaluated at a bond critical point, ρ(rc), and its Laplacian are reported in Table 3 for Na⋯Cl, Na⋯O and Cl⋯H contacts. In this table, we report the average of these quantities since there are some of these contacts within each isomer.
| Isomer | Na⋯Cl | O⋯Na | Cl⋯H | |||
|---|---|---|---|---|---|---|
| ρ(rc) | ∇2ρ(rc) | ρ(rc) | ∇2ρ(rc) | ρ(rc) | ∇2ρ(rc) | |
| (NaCl)(H2O)2 | ||||||
| I | 0.0235 | 0.1215 | 0.0236 | 0.1706 | 0.0213 | 0.0666 |
| II | 0.0289 | 0.1577 | 0.0268 | 0.1920 | 0.0280 | 0.0733 |
| (NaCl)2(H2O)4 | ||||||
| I | 0.0202 | 0.1065 | 0.0256 | 0.1682 | 0.0278 | 0.0756 |
| II | 0.0173 | 0.0892 | 0.0237 | 0.1560 | 0.0197 | 0.0602 |
| III | 0.0178 | 0.0902 | 0.0176 | 0.1087 | 0.0190 | 0.0583 |
| IV | 0.0186 | 0.0975 | 0.0237 | 0.1560 | 0.0197 | 0.0602 |
| XXVII | 0.0212 | 0.1114 | 0.0215 | 0.1409 | 0.0209 | 0.0654 |
| (NaCl)4(H2O)8 | ||||||
| I | 0.0158 | 0.0823 | 0.0211 | 0.1344 | 0.0167 | 0.0544 |
| II | 0.0163 | 0.0845 | 0.0214 | 0.1378 | 0.0123 | 0.0662 |
| III | 0.0149 | 0.0770 | 0.0205 | 0.1320 | 0.0168 | 0.0558 |
| IV | 0.0159 | 0.0818 | 0.0213 | 0.1366 | 0.0190 | 0.0589 |
| V | 0.0169 | 0.0884 | 0.0204 | 0.1301 | 0.0195 | 0.0605 |
The sign of the Laplacian is the first result we must mention since this quantity is positive for the considered contacts and therefore we are dealing with non-covalent interactions. Besides, the electron density, Na⋯Cl, O⋯Na and Cl⋯H contacts show similar values to those found in hydrogen bonds with medium strength. However, it is worth noting that for the biggest system this property is smaller for the considered contacts than the one observed for the clusters with n = 1 and 2.
From here, it is interesting to discover if some properties, discussed so far, are related to the crystal phase where the NaCl–water ratio is the same. The Na–Cl distance is the first property to be compared between finite and infinite systems. In Table 4, we report the Na–Cl bond length for different structures. For this discussion, we use two experimental references. NaCl is the first one, and it represents the diatomic molecule,41 while Crys represents the NaCl dihydrate in the crystal phase. From this table, the action of the cluster size on the bond length is evident; the larger the system, the larger this bond length. This effect is confirmed through the electron density at the bond critical point exhibited between Na and Cl atoms reported in Table 3. Clearly, there is a reduction of this property when the number of molecules is increased in the cluster. Thus, when the NaCl distance is enlarged the electron density associated with this contact decreases its value. For this reason, we performed a single point calculation over the crystal structure imposing periodic boundary conditions by means of the CRYSTAL code. From the electron density obtained from the crystal, this electron density was used to achieve an AIM analysis within the unit cell. The average of the bond critical points is reported in Fig. 8 for Na⋯Cl, Na⋯O and H⋯Cl contacts. Comparing the values of this figure to those reported in Table 3, we can notice similar values between the crystal and the (NaCl)4(H2O)8-I isomer. This result shows that some properties for the (NaCl)4(H2O)8 cluster are similar to those found in the crystal structure, strengthening our proposal of the global minimum for the (NaCl)4(H2O)8 cluster.
| NaCl | NaCl(H2O)2 | (NaCl)2(H2O)4 | (NaCl)4(H2O)8 | Crys | |
|---|---|---|---|---|---|
| Exp. | 2.361 | 2.790 | |||
| I | 2.546 | 2.593 | 2.700 | ||
| II | 2.445 | 2.674 | 2.695 | ||
| III | 2.659 | 2.734 | |||
| IV | 2.636 | 2.670 | |||
| V | 2.656 | 2.693 |
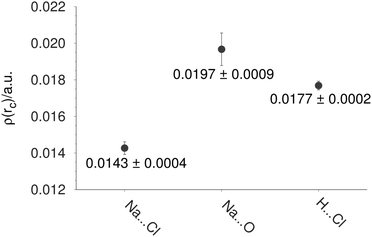 | ||
| Fig. 8 Average of the electron density at bond critical points in a unit cell of the (NaCl)4(H2O)8 crystal. | ||
NCI and bond critical points for the sodium chloride dihydrate are presented in Fig. 9 within the unit cell of this crystal. It is important to mention that this unit cell contains 4 NaCl molecules and 8 water molecules. Due to this, we use this size to build the corresponding (NaCl)4(H2O)8 cluster. This figure shows several characteristics found in some clusters considered in this article. First, the NCI is quite similar to that presented in Fig. 7, no repulsion zones are found in both cases, blue regions appear between several atoms in the unit cell, and each atom is surrounded by green surfaces indicating non-covalent interactions within the whole crystal.
4 Conclusions
In this article, three (NaCl)n(H2O)2n clusters, with n = 1, 2, and 4, were analyzed by using theoretical techniques. The first task performed in this study was the isomer search for each cluster. For this purpose, we used a new implementation of the simulated annealing method where we impose three spatial restrictions. In this report, we used only one restriction to move water and NaCl molecules within a spherical region by using the PM7 semiempirical method as a cost function. From this procedure, we selected several isomers and their structure was relaxed using the Kohn–Sham method. For the smallest cluster (n = 1) we showed that the M06-2X exchange–correlation functional gives the smallest deviation concerning the CCSD(T) method. This conclusion was reached among 8 exchange–correlation functionals designed from different approaches. In this part of the study, the PBE exchange–correlation functional rendered the worst results: thus, we do not recommend this functional to study this kind of system.For clusters with n = 2 and 4, cuboid structures gave the lowest energies with no changes when the temperature was changed from 0 to 300 K. This result suggests that at incipient stages of the nucleation of the sodium chloride dihydrate we can find cubes built among NaCl and water molecules. In addition, we did not observe a Na–Cl breaking bond. Therefore, the water/NaCl ratio is enough to keep the Na–Cl contact, enabling people to see Na–Cl dihydrate crystals.
From the electron density analysis of the crystal and clusters, there is no doubt that non-covalent interactions command the stabilization of these systems, where Na⋯Cl, Na⋯O, and Cl⋯H contacts, evaluated at bond critical points, present similar electron density values among themselves. Although these contacts are non-covalent they induce strong links in these systems due to the large free-energies of the clusters studied here. These results suggest that this NaCl dihydrate forms an ionic crystal.
Conflicts of interest
There are no conflicts of interest to declare.Acknowledgements
We thank the Laboratorio de Supercómputo y Visualización en Paralelo at the Universidad Autónoma Metropolitana-Iztapalapa for access to its computer facilities. JG thanks CONACYT, México, for financial support through the project FC-2016/2412. JJG and RHE thank CONACYT for the scholarships 467303 and 283251, respectively.References
- S. S. M. C. Godinho, P. C. do Couto and B. J. C. Cabral, Chem. Phys. Lett., 2004, 399, 200–205 CrossRef CAS
.
- M. K. Ghosh, S. Re, M. Feig, Y. Sugita and C. H. Choi, J. Phys. Chem. B, 2013, 117, 289–295 CrossRef CAS
.
- M. J. Wiedemair, A. K. H. Weiss and B. M. Rode, Phys. Chem. Chem. Phys., 2014, 16, 7368–7376 RSC
.
- N. Holmberg, J.-C. Chen, A. S. Foster and K. Laasonen, Phys. Chem. Chem. Phys., 2014, 16, 17437–17446 RSC
.
- J. Tandy, C. Feng, A. Boatwright, G. Sarma, A. M. Sadoon, A. Shirley, N. D. N. Rodrigues, E. M. Cunningham, S. Yang and A. M. Ellis, J. Chem. Phys., 2016, 144, 121103 CrossRef PubMed
.
- G.-L. Hou, C.-W. Liu, R.-Z. Li, H.-G. Xu, Y. Q. Gao and W.-J. Zheng, J. Phys. Chem. Lett., 2017, 8, 13–20 CrossRef CAS PubMed
.
- T. Takayanagi, T. Nakatomi and Y. Yonetani, J. Comput. Chem., 2018, 39, 1835–1842 CrossRef CAS PubMed
.
- T. Koop, A. Kapilashrami, L. T. Molina and M. J. Molina, J. Geophys. Res.: Atmos., 2000, 105, 26393–26402 CrossRef CAS
.
- A. A. C. Bode, P. G. M. Pulles, M. Lutz, W. J. M. Poulisse, S. Jiang, J. A. M. Meijer, W. J. P. van Enckevort and E. Vlieg, Cryst. Growth Des., 2015, 15, 3166–3174 CrossRef CAS
.
- R. Wagner, J. Kaufmann, O. Moehler, H. Saathoff, M. Schnaiter, R. Ullrich and T. Leisner, J. Geophys. Res.: Atmos., 2018, 123, 2841–2860 CAS
.
- K. D. Custard, A. R. W. Raso, P. B. Shepson, R. M. Staebler and K. A. Pratt, ACS Earth Space Chem., 2017, 1, 142–151 CrossRef CAS
.
-
A. Szabo and N. S. Ostlund, Modern quantum chemistry: Introduction to advanced electronic structure theory, Dover, New York, 1996 Search PubMed
.
-
R. G. Parr and W. Yang, Density-Functional Theory of Atoms and Molecules, Oxford University Press, Oxford, 1994 Search PubMed
.
- R. F. W. Bader, Phys. Rev. B: Condens. Matter Mater. Phys., 1994, 49, 13348–13356 CrossRef CAS
.
-
R. F. W. Bader, Atoms in molecules: A Quantum Theory, Oxford University Press, New York, 1990 Search PubMed
.
- W. Kohn and L. J. Sham, Phys. Rev., 1965, 140, A1133–A1138 CrossRef
.
- S. Kirkpatrick, C. D. Gelatt and M. P. Vecchi, Science, 1983, 220, 671–680 CrossRef CAS PubMed
.
- M. Wevers, J. Schon and M. Jansen, J. Solid State Chem., 1998, 136, 233–246 CrossRef CAS
.
- Stewart Computational Chemistry, Colorado Springs, CO, USA, MOPAC. https://OpenMOPAC.net.
- J. E. Jones D. Sc., Proc. R. Soc. London, Ser. A, 1924, 106, 463–477 CrossRef
.
- E. Osorio, M. B. Ferraro, O. B. Ona, C. Cardenas, P. Fuentealba and W. Tiznado, J. Chem. Theory Comput., 2011, 7, 3995–4001 CrossRef CAS PubMed
.
- Z. Ye, K. Xiao and Y. Deng, 2015 IEEE International Conference on Data Mining Workshop (ICDMW), 2015, pp. 1078–1084.
- J. P. Perdew, K. Burke and M. Ernzerhof, Phys. Rev. Lett., 1996, 77, 3865–3868 CrossRef CAS PubMed
.
- S. Grimme, S. Ehrlich and L. Goerigk, J. Comput. Chem., 2011, 32, 1456–1465 CrossRef CAS PubMed
.
- C. Adamo and V. Barone, J. Chem. Phys., 1999, 110, 6158–6170 CrossRef CAS
.
- A. D. Becke, J. Phys. Chem., 1993, 98, 5648–5652 CrossRef CAS
.
- O. A. Vydrov and G. E. Scuseria, J. Chem. Phys., 2006, 125, 234109 CrossRef PubMed
.
- Y. Zhao and D. G. Truhlar, Theor. Chem. Acc., 2008, 120, 215–241 Search PubMed
.
- J. P. Perdew and K. Schmidt, AIP Conf. Proc., 2001, 577, 1–20 CrossRef CAS
.
- M. P. Andersson and P. Uvdal, J. Phys. Chem. A, 2005, 109, 2937–2941 CrossRef CAS PubMed
.
- D. E. Woon and T. H. Dunning, J. Chem. Phys., 1993, 98, 1358–1371 CrossRef CAS
.
- M. Valiev, E. J. Bylaska, N. Govind, K. Kowalski, T. P. Straatsma, H. J. J. Van Dam, D. Wang, J. Nieplocha, E. Apra, T. L. Windus and W. de Jong, Comput. Phys. Commun., 2010, 181, 1477–1489 CrossRef CAS
.
- R. Dovesi, R. Orlando, A. Erba, C. M. Zicovich-Wilson, B. Civalleri, S. Casassa, L. Maschio, M. Ferrabone, M. De La Pierre, P. D’Arco, Y. Noel, M. Causa, M. Rerat and B. Kirtman, Int. J. Quantum Chem., 2014, 114, 1287–1317 CrossRef CAS
.
- J. Contreras-García, E. R. Johnson, S. Keinan, R. Chaudret, J.-P. Piquemal, D. N. Beratan and W. Yang, J. Chem. Theory Comput., 2011, 7, 625–632 CrossRef PubMed
.
- R. Hernández-Esparza, S. M. Mejia-Chica, A. D. Zapata-Escobar, A. Guevara-García, A. Martínez-Melchor, J. M. Hernández-Pérez, R. Vargas and J. Garza, J. Comput. Chem., 2014, 35, 2272–2278 CrossRef PubMed
.
- R. Hernández-Esparza, A. Vázquez-Mayagoitia, L.-A. Soriano-Agueda, R. Vargas and J. Garza, Int. J. Quantum Chem., 2018, 119, e25671 CrossRef
.
- W. Humphrey, A. Dalke and K. Schulten, J. Mol. Graphics, 1996, 14, 33–38 CrossRef CAS PubMed
.
- Y. Yao and Y. Kanai, J. Chem. Theory Comput., 2018, 14, 884–893 CrossRef CAS PubMed
.
- A. D. Becke, Phys. Rev. A: At., Mol., Opt. Phys., 1988, 38, 3098–3100 CrossRef CAS
.
- C. T. Lee, W. T. Yang and R. G. Parr, Phys. Rev. B: Condens. Matter Mater. Phys., 1988, 37, 785–789 CrossRef CAS
.
- Z. K. Ismail, R. H. Hauge and J. L. Margrave, J. Mol. Spectrosc., 1975, 54, 402–411 CrossRef CAS
.
- G. É. Yalovega, A. V. Soldatov, K. Novak, M. Riedler, O. Löfken, A. Kolmakov and T. Möller, Phys. Solid State, 2000, 42, 1942–1945 CrossRef CAS
.
- C.-W. Liu, G.-L. Hou, W.-J. Zheng and Y. Q. Gao, Theor. Chem. Acc., 2015, 8, 155–164 Search PubMed
.
Footnote |
| † Electronic supplementary information (ESI) available. See DOI: 10.1039/c8nj06315j |
| This journal is © The Royal Society of Chemistry and the Centre National de la Recherche Scientifique 2019 |

