 Open Access Article
Exploring ultraviolet photoinduced charge-transfer dynamics in a model dinucleotide of guanine and thymine†‡§
Marta
Duchi
a,
Michael P.
O’Hagan
a,
Rhea
Kumar¶
a,
Simon J.
Bennie
a,
M. Carmen
Galan
 a,
Basile F. E.
Curchod
 b and
Thomas A. A.
Oliver
 *a
*a
aSchool of Chemistry, Cantock's University of Bristol, Bristol, BS8 1TS, UK. E-mail: tom.oliver@bristol.ac.uk
bDepartment of Chemistry, Durham University, South Road, Durham, DH1 3LE, UK
First published on 6th March 2019
Abstract
An understanding of the initial photoexcited states of DNA is essential to unravelling deleterious photoinduced chemical reactions and the intrinsic ultrafast photoprotection of the genetic code for all life. In our combined experimental and theoretical study, we have elucidated the primary non-radiative relaxation dynamics of a model nucleotide of guanine and thymine (2′-deoxyguanosine 3′-monophosphate 5′-thymidine, d(GpT)) in buffered aqueous solution. Experimentally, we unequivocally demonstrate that the Franck–Condon excited states of d(GpT) are significantly delocalised across both nucleobases, and mediate d(G+pT−) exciplex product formation on an ultrafast (<350 fs) timescale. Theoretical studies show that the nature of the vertical excited states is very dependent on the specific geometry of the dinucleotide, and dictate the degree of delocalised, charge-transfer or localised character. Our mechanism for prompt exciplex formation involves a rapid change in electronic structure and includes a diabatic surface crossing very close to the Franck–Condon region mediating fast d(G+pT−) formation. Exciplexes are quickly converted back to neutral ground state molecules on a ∼10 ps timescale with a high quantum yield, ensuring the photostability of the nucleotide sequence.
1. Introduction
The ultraviolet component of solar radiation poses a threat to all life on Earth. If UV light is absorbed by DNA, deleterious photochemical reactions can be initiated, leading to genetic damage of the source code for life.1,2 The mechanistic details of such processes have been the subject of intense study, with ultrafast spectroscopy playing a pivotal role establishing the molecular mechanisms of DNA excited state deactivation or photoinduced reactions.3–11 It is apparent that as the complexity of the DNA structure is increased from a bare nucleobase to a polynucleotide the associated non-radiative relaxation dynamics become increasingly complicated; the amplitude associated with the tens-to-hundreds of picoseconds excited state lifetime component becomes more significant,3,5,8,12 and additional non-radiative pathways such as excited state charge-transfer8,13 or proton-coupled electron transfer become accessible.9Intermolecular electrostatic interactions become increasingly influential when the structure is further extended to include multiple nucleic acids, e.g. di-, tri-, or oligo-nucleotides. In these single (or double) strands of DNA, π-stacking becomes an important structural motif, and due to the short distances between adjacent nucleobases, significant electronic coupling is anticipated.4,14 Resultantly, theoretical studies have suggested the Franck–Condon electronic states are no longer localised to specific nucleobases,15–18 and could be delocalised over up to 4 moieties.19 Static circular dichroism20 and ultrafast spectroscopic investigations3,6,13,19,21 have established a picture where the photoexcited states of DNA structures are initially delocalised over multiple nucleobases. However whilst these experimental studies are pioneering, they either represent a time-averaged picture of DNA systems,20,22 concentrate on sufficiently large systems where precise molecular details are difficult to ascertain,3,6 deliberately incorporated unnatural nucleobases into structures to shift absorptions and thereby reducing inter-nucleobase dipole coupling compared to natural sequences,8,13 or are unable to definitively assign the transient products formed.21,23 Therefore, despite a consensus being reached, irrefutable experimental evidence supporting the hypothesis of delocalised Franck–Condon excited states in natural DNA sequences with a high level of molecular precision is missing.
We used ultrafast transient absorption (TA), time-resolved infrared spectroscopy (TRIR) and theoretical calculations to study the non-radiative relaxation dynamics of 2′-deoxyguanosine 3′-monophosphate 5′-thymidine, d(GpT), a dinucleotide that contains the naturally occurring nucleic acids thymine and guanine in buffered aqueous solution. Experimentally we demonstrate that (i) the Franck–Condon excited states of d(GpT) are significantly delocalised over both guanine and thymine and (ii) the Franck–Condon states rapidly decay into an ion-pair exciplex state forming d(G+pT−) products. (iii) At least 51% of photoexcited dinucleotides follow this non-radiative pathway, but efficiently reform neutral ground state molecules on a ∼10 ps timescale, and thereby minimise the probability of deleterious excited state photochemical reactions.
2. Results and discussion
2.1 Ground state molecular structure
Dinucleotides are inherently conformationally very flexible molecules due a large number of internal degrees of freedom. It is therefore reasonable to conclude that they will have associated complex conformational free energy landscapes which will support many different local minima structures. If the barriers to interconversion are sufficiently low, then multiple conformers will be present in room temperature solution. There are two dominant effects that determine the balance of structures present in aqueous solution; (i) the hydrophobicity experienced by the hydrocarbon nucleobase rings which favour π-stacked conformations as illustrated in Fig. 1(a), and entropically favoured conformers where the energetic stabilisation of π-stacking is outweighed by conformational flexibility (e.g.Fig. 1(b)).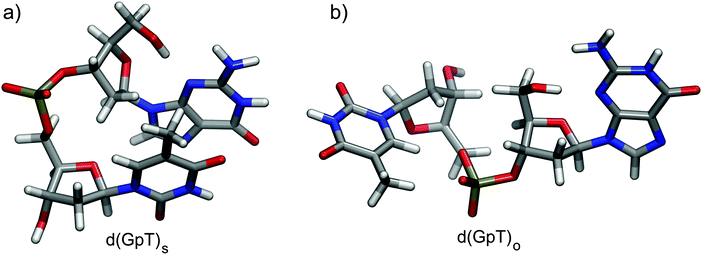 | ||
| Fig. 1 Calculated representative (a) π-stacked and (b) open structures of d(GpT) optimised at the ωB97X-D/6-31G*/IEFPCM level of theory. | ||
The conformational structure has ramifications for the electronic structure of photoexcited d(GpT); in π-stacked configurations the inter-nucleobase distance is short (typically <3 Å) and dipole–dipole coupling is anticipated to be the strongest. For structures that lack π-stacking, the inter-nuclear separation between rings is large and to a low-order approximation, excitation can be described as localised to individual nucleobases. To date, quantification of the conformational equilibrium using molecular dynamics (MD) simulations has proved very challenging for di-, tri- or oligo-nucleotides as the MD force-fields have been optimised for double stranded DNA (B-form),24 and thus over-emphasise the percentage of π-stacked conformers. A recent study of d(TpT) exemplified this issue: MD simulations could not reproduce experimentally determined equilibrium constants extracted from NOSY and COSY NMR measurements.25
We utilised MD simulations to generate a variety of possible d(GpT) ground state conformations, from which we extracted several “representative” molecular structures. These MD geometries were then re-optimised using density functional theory (DFT) and used to inform the analysis of our time-resolved infrared measurements (see Sections 2.2, 5.3 and ESI§ for full details). It is important to emphasise that we did not attempt to use the MD simulations to obtain the absolute global minimum energy structures, or to predict the percentage of stacked d(GpT) molecules in solution due to the aforementioned problem with MD force fields. Throughout the paper, we focus on π-stacked (denoted with subscript s) and open conformations (subscript o) of d(GpT). The optimised geometries of these structures at the DFT/ωB97X-D/6-31G* level are displayed in Fig. 1.
2.2 Electronic and vibrational absorption spectroscopy
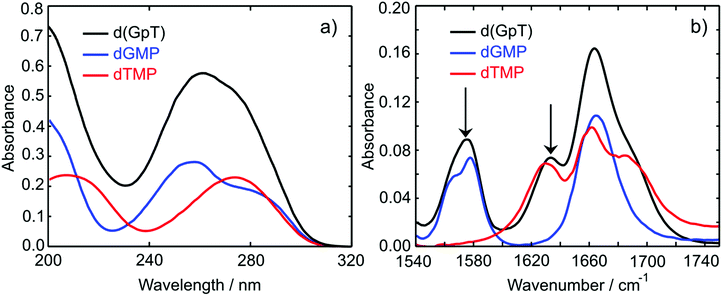
The UV absorption spectra of 10 mM buffered (pD 7) aqueous solutions of 2′-deoxyguanosine 5′-monophosphate (dGMP), thymidine-5′-monophosphate (dTMP) and d(GpT) are displayed in Fig. 2(a). The dGMP absorption spectrum is dominated by two local maxima at 276 and 252 nm which are assigned to the two lowest energy 1ππ* states, S1 and S2, and have the associated 1La and 1Lb labels in Platt's notation.26 dTMP has a maximum at 270 nm assigned to a 1ππ* state (S2), and the 1nπ* (S1) state lies at lower excitation energies, but is optically dark to one-photon absorption.12 The absorption spectrum of d(GpT) displays two local maxima at 273 and 257 nm – we chose the two pump wavelengths used in TA and TRIR experiments to coincide with these features.Static Fourier-transform infrared (FTIR) spectra were acquired for the same solutions of the three molecules between 1540–1750 cm−1 and are displayed in Fig. 2(b). The vibrational spectrum of the dinucleotide in this range contains five main vibrational absorption bands centred at 1566, 1578, 1632, 1661, and 1682 cm−1. The vibrational frequencies were assigned based on prior investigations of the isolated nucleotides27,28 to: a pyrimidine ring breathing mode coupled to an amino stretch of the guanine moiety at 1566 cm−1, C–N ring breathing stretch on guanine at 1578 cm−1, carbon–carbon double bond of the thymine ring (1632 cm−1), carbonyl stretches on either guanine or thymine (1661 cm−1) and the C![[double bond, length as m-dash]](https://www.rsc.org/images/entities/char_e001.gif) O stretch adjacent to N–D and N–sugar groups on thymine (1690 cm−1). The two peaks at 1578 and 1632 cm−1 (labelled with arrows in Fig. 2(b)) are unique to guanine or thymine nucleobases, and exploited as localised probes for the time-dependent population of the two nucleobases (see Section 2.4).
O stretch adjacent to N–D and N–sugar groups on thymine (1690 cm−1). The two peaks at 1578 and 1632 cm−1 (labelled with arrows in Fig. 2(b)) are unique to guanine or thymine nucleobases, and exploited as localised probes for the time-dependent population of the two nucleobases (see Section 2.4).
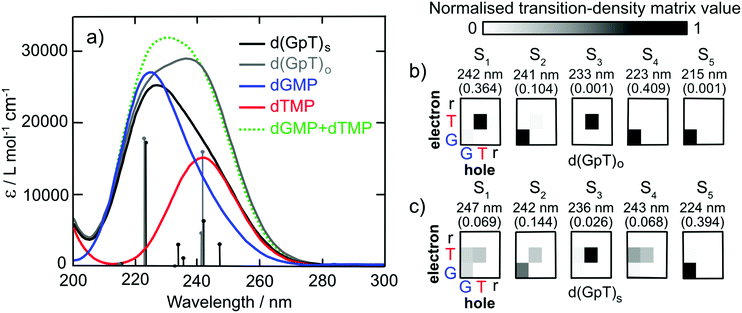
To characterise the electronic structure of the first few singlet excited states of d(GpT), linear-response time-dependent density functional theory (LR-TDDFT) calculations with the exchange–correlation functional ωB97X-D and an cc-pVTZ basis set using an integral equation formalism variant polarisable continuum solvent model (IEFPCM) were performed (see Section 5.3 and ESI§ for further details). The theoretical absorption spectra for the isolated dGMP and dTMP (see Fig. 3) reproduce the observed experimental trends; dGMP has a blue-shifted absorption maximum with a higher oscillator strength compared to dTMP. The close resemblance of the dGMP + dTMP calculated spectrum to that of d(GpT)o highlights the very weak interaction between G and T moieties in conformations lacking π-stacking, particularly at λ > 230 nm. The calculated spectrum of d(GpT)s deviates more significantly from the sum of dGMP + dTMP or d(GpT)o spectra but agrees with the overall experimentally observed trends for d(GpT).
Further insights were gained from the analysis of the lowest energy LR-TDDFT calculated electronic transitions. The transition density corresponding to each electronic state was decomposed into the location of the photogenerated hole (where the electron was in S0) and electron (the location of the electron in the excited electronic state). We partitioned d(GpT) in three components: G or T nucleobases and the remaining sugar–phosphate backbone (r). The location of the hole/electron for each transition is given in the matrices shown in Fig. 3(b and c). Concentrating on d(GpT)o initially; the first singlet excited state is localised to the thymine moiety (electron and hole are both located on T), whereas the S2 state is localised on the guanine nucleobase. The first two transitions d(GpT)o are almost degenerate, and the S1 and S2 states only contain minor contributions (<11%) from the other nucleobase. This decomposition explains the close resemblance between the dGMP + dTMP and d(GpT)o calculated transitions. π-Stacking in d(GpT)s results in far less localisation of the electron and hole to the same nucleobase (see Fig. 3(c)), which greatly alters the character of the lowest energy singlet excited states: (i) diagonal elements for both G and T are returned for S1, S2 and S4 states, which is characteristic of coupled excitation of the two nucleobases, i.e. the excitation is delocalised, and (ii) upper off-diagonal elements are observed for low oscillator strength S1, S3 and S4 states, indicating a significant charge-transfer character from guanine to thymine. The presence of low-lying excited states with different electronic characters in d(GpT) agrees with prior theoretical calculations (CASPT2/MM methods) for d(ApU).29 It is important to note that due to the close energetic proximity of these states, their ordering is expected to be very sensitive to the nuclear geometry, as exemplified by the transition-density matrices associated with vertical electronic transitions of another conformer (see Fig. S17 and ESI§).
2.3 Transient absorption spectroscopy
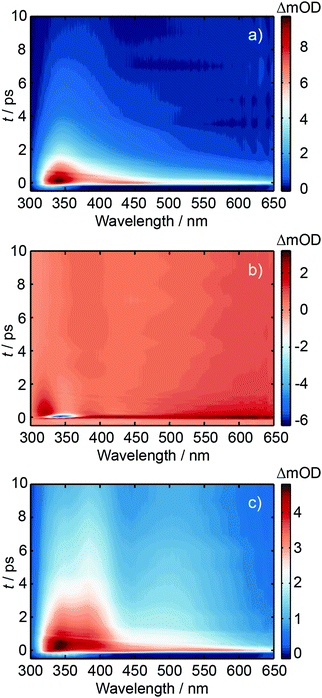
Ultrafast transient absorption spectroscopy was used to investigate the excited state dynamics of d(GpT), dGMP and dTMP using 273 and 257 nm photoexcitation. A full description of the ultrafast spectroscopic methods used in this study are detailed in Section 5.2. TA spectra obtained from 273 nm photoexcitation of three solutions at many different pump–probe time delays, t, are displayed in Fig. 4. Corresponding data for 257 nm excitation are shown in Fig. S1 (ESI§). The TA spectrum for dGMP (Fig. 4(a)) is dominated by a positive excited state absorption (ESA) transient which has two local maxima centred at ∼360 and ∼550 nm. The frequency dispersed TA data are reminiscent of studies by Stuhldreier et al., although the previous study used 260 nm excitation.21The dTMP TA spectrum contains two main features; a negative peak centred at 357 nm and an ESA that spans the entire probe window with a maximum at 610 nm. The negative feature corresponds to stimulated emission (SE) from the short-lived 1ππ* state, consistent with prior static and ultrafast spectroscopy studies.30–32 The d(GpT) TA spectrum, Fig. 4(c), is dominated by a broad ESA feature which bears little resemblance to the spectra of the constituent mononucleotides.
Kinetic traces for the peak of the ESA signals in the three datasets are displayed in Fig. 5. These data were fit to exponential decays convolved with a Gaussian instrument response function. As evident from both the frequency dispersed TA data (Fig. 4), associated time slices (Fig. 5) and the time constants returned from fitting these data (Table S1, ESI§), almost all dTMP and dGMP molecules decay rapidly to the ground state within 1–2 ps, in accord with previous studies,33–35 whereas the dinucleotide decays more slowly and an additional 11 ± 2 ps exponential decay component was required to fit the data.
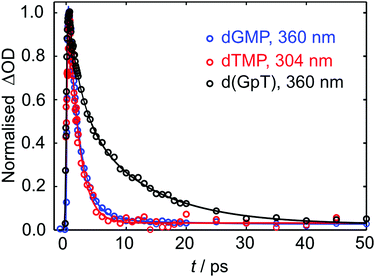 | ||
| Fig. 5 Normalised TA data (open circles) for the displayed probe wavelengths of dGMP, dTMP and d(GpT). Solid lines display the fits to experimental data (see Table S1, ESI§ for fit parameters). | ||
Similar dynamics were observed for 257 nm excitation (see Fig. S2 and Table S1, ESI§). A comparison of the ESA decay for d(GpT) using 273 and 257 nm excitation is displayed in Fig. S3 (ESI§). We note that for d(GpT) and dTMP samples, there is a nanosecond lifetime component (3% amplitude), which we attribute to long-lived triplet species, that are likely to be localised to the thymine nucleobase.36,37
What is not apparent from these data is any indication of the electronic structure of the photoexcited molecules from the diffuse excited state absorption signals. Due to size of the d(GpT) molecule, conformational complexity, and the density of electronic states that fall within the 1.8–3.8 eV white light probe window, it would be very difficult to calculate all the Sn ← Sm transition dipole moments at a high level of ab initio theory for multiple conformers, a range of excited states (Sm) and many possible product species. Such an approach has only been successful for modelling the S1 ESA spectrum of smaller UV chromophores.38 The complexity of such dinucleotide systems was also highlighted in previous theoretical studies.29 As many other groups have demonstrated, ultrafast mid-infrared probe experiments can yield additional information about the reaction dynamics of the system, such as the identities of reactive intermediates or timescales for photoproduct formation.8,10,13,39
2.4 Time-resolved infrared spectroscopy
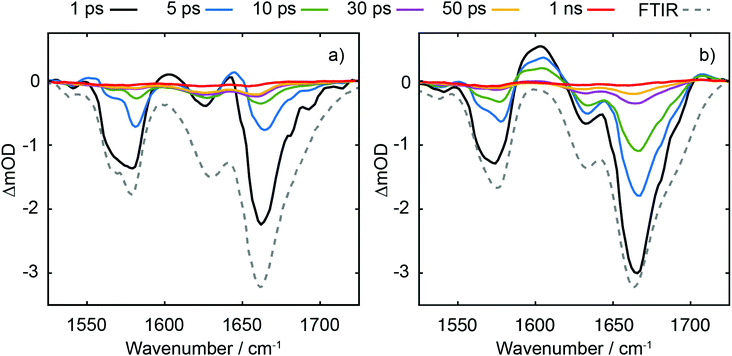
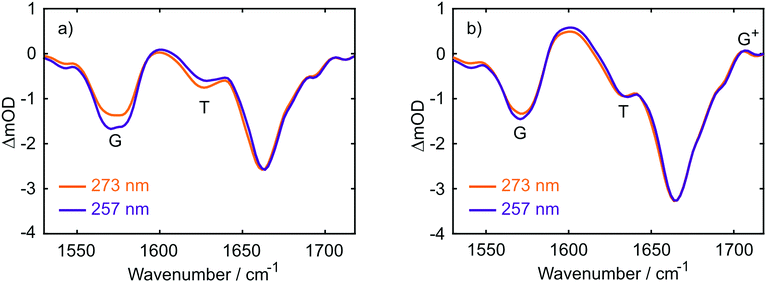
TRIR data collected using 273 nm photoexcitation is displayed in Fig. 6 for (a) an equimolar mixture of dGMP and dTMP and (b) d(GpT) solutions. The spectra are congested with overlapping positive and negative vibrational transient features. The corresponding TRIR data recorded with 257 nm pump pulses are displayed in Fig. S4 (ESI§).Both datasets are dominated by negative bands corresponding to transients that evolve on the ground state during the pump–probe time delay and appear at the same, or very similar, frequencies as the main features present in the respective linear FTIR spectra. Our analysis first focuses on the recovery of negative features centred at 1666, 1575 and 1635 cm−1. The negative band centred at 1666 cm−1 corresponds to overlapping vibrational features associated with carbonyl stretching vibrations localised on guanine and thymine moieties (see Section 2.2). The associated kinetics of this feature for the mixture of mononucleotides and dinucleotide are shown in Fig. 7. The data were fit to biexponential and triexponential functions, respectively, and the results summarised in Table 1. Fits to 257 nm data are given in Table S2 (ESI§). It is evident from the amplitudes and time constants returned from fitting, that a significant number of photoexcited d(GpT) molecules (54 and 51% for 273 and 257 nm excitation, respectively) have a longer excited state lifetime than the constituent mononucleotides.
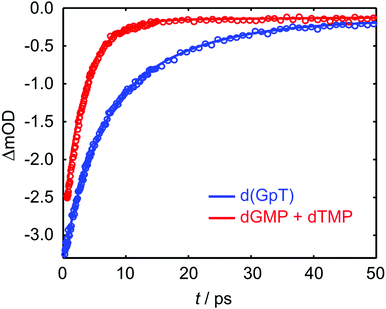 | ||
| Fig. 7 Kinetics associated with the 1666 cm−1 bleach feature for the mixture of mononucleotides (red open circles) and d(GpT) (blue open circles) upon 273 nm irradiation. Solid lines display the fits to experimental data (see Table 1 for fit parameters). | ||
| d(GpT) | dGMP + dTMP | ||
|---|---|---|---|
| A 1 = 0.41 | τ 1 = 4.1 ± 0.3 ps | A 1 = 0.94 | τ 1 = 3.22 ± 0.02 ps |
| A 2 = 0.54 | τ 2 = 13 ± 1 ps | A 2 = 0.06 | τ 2 > 1 ns |
| A 3 = 0.05 | τ 3 > 1 ns | R 2 = 0.99 | |
| R 2 = 0.99 | |||
The analysis of the negative features at 1575 and 1635 cm−1 which report on the time-dependent population of guanine and thymine chromophores, respectively, are shown in the Fig. S6 and Table S3 (ESI§). Fits to these data return similar time constants to the 1666 cm−1 feature, however the kinetics associated with each of the vibrational bands are not identical. We attribute this to contamination of overlapping adjacent features which have differing spectral shifts, and mode-dependent vibrational cooling timescales as observed in other DNA systems.40,41 Like our TA data, the TRIR data contain a small-amplitude nanosecond component, which we attribute to long-lived triplet species.36,37
Three positive features in the mixture of mononucleotides spectra are present at t < 5 ps (see Fig. 6(a)) correspond to the vibrationally hot S0 population that are formed promptly after ultrafast internal conversion to the ground state. The features at 1550, 1600 and 1655 cm−1 are red-shifted compared to the respective fundamental negative features due to the associated anharmonicity of the respective S0 vibrational potentials. The dinucleotide data has significantly more amplitude associated with the 1580–1615 cm−1 feature compared to the mixture of mononucleotides spectra. Further, the d(GpT) TRIR spectra contain an additional isolated vibrational band centred at 1708 cm−1, which is a known signature of the guanine cation (G+).8,42–44 Based on prior studies7,8,13,45 and the absence of any appreciable signature of solvated electron formation in TA spectra, we conclude that G+ will be produced in conjunction with thymine anions (T−) as part of an ion-pair exciplex. G+ is only observed for irradiation of d(GpT) solutions and not the mixture of dGMP and dTMP, and therefore it is apparent that changes in the electronic structure induced by π-stacking must be crucial to mediate exciplex formation.
Extracting the kinetics associated with the G+ feature requires careful deconvolution with an adjacent oppositely-signed large amplitude feature which in principle does not have similar kinetics. We therefore analysed the data by fitting the TRIR spectra at every pump–probe time delay to the sum of Gaussian basis functions to model the vibrational dynamics as per ref. 46 (see ESI§ for details of this procedure). Constraints were placed on negative features, enforcing the FWHM and central frequency were fixed to those of the (inverted) linear FTIR spectrum. We prefer this approach to a target analysis, which would struggle to capture the vibrational mode dependent cooling rates. The simulated spectra returned by our analysis are in excellent agreement with experimental TRIR data, exemplified by the side-by-side comparisons given in Fig. S7 (ESI§), and kinetic traces for several probe frequencies displayed in Fig. S8 (ESI§).
The kinetics associated with the G+ feature returned by Gaussian fitting for 273 nm excitation are given in Fig. 8 and were fit to an exponential decay with a 10.5 ± 0.2 ps time constant. The guanine cation is formed so rapidly that it appears within our instrument response (∼350 fs) and based on LR-TDDFT calculations we determine that this species can only be formed from π-stacked d(GpT) conformers. The experimentally determined oxidation and reduction potentials for the isolated DNA nucleobases47 allows us to predict that d(G+pT−) is the most probable ion-pair product and ∼1.3 eV more stable than d(G−pT+). This estimate is consistent with our observation of a G+ vibrational signature at 1708 cm−1. Despite observing a direct spectral signature associated with G+, we were unable to isolate the expected vibrational bands corresponding to T−, which are expected between ∼1650–1595 cm−1.45,48 In part, this is because they will overlap with transients associated with the neutral molecule, but also several other vibrational features associated with G+ are also expected in this region.8 Fig. S7 (ESI§) displays the corresponding Gaussian fitting analysis for G+ with 257 nm excitation, which was fit to a 11.1 ± 0.2 ps time constant.
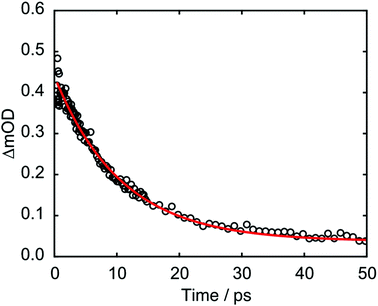 | ||
| Fig. 8 Kinetics associated with 1708 cm−1 feature from Gaussian fitting analysis of d(GpT) TRIR data. | ||
A comparison of TRIR data acquired at t = 350 fs with 273 and 257 nm excitation (see Fig. 9) allows us to explore the nature of the initial vertical Franck–Condon electronic states and the relative yield of d(G+pT−) product branching. From the different linear absorption cross-sections of the two mononucleotides at these two wavelengths we would expect preferential excitation of thymine at 273 nm, and guanine at 257 nm (recall Fig. 2(a)). Our TRIR data bear out this expectation; in the mixture of mononucleotide spectrum (Fig. 9(a)) more intense bleaching associated with vibrational bands unique to guanine is observed at 257 nm (1580 cm−1), with thymine bands enhanced for 273 nm excitation (1630 cm−1). If the electronically excited states of d(GpT) are localised to either chromophore then we would observe the relative ratio of bleaches at 1580 and 1630 cm−1 vary between pump excitation wavelengths in the dinucleotide TRIR data. As Fig. 9(b) illustrates the TRIR spectra at t = 350 fs are very similar, which implies a roughly equal number of guanine and thymine moieties are photoexcited at both excitation wavelengths. This observation is only possible if the vertical Franck–Condon states are significantly delocalised over both nucleobases. We have performed this comparative analysis for t = 350 fs data, as it is earliest time delay outside of our IRF window and prior to any excited-state equilibration. Such processes may involve localisation of population to either nucleobase16 and/or subsequent inter-nucleobase electronic energy transfer: either inevitably would lead to differential changes in the G/T bleach ratio. We do not rule out any ultrafast internal conversion to S0, as per dTMP or dGMP,33–35 that may occur on a commensurate timescale to our IRF. Our hypothesis is consistent with our theoretical studies: the transition-density matrix analysis of LR-TDDFT calculations for d(GpT)s revealed the electron/hole distribution of the vertical singlet excited states are not exclusively localised to a single nucleobase, but depending on the specific dinucleotide geometry, contain G → T charge-transfer character and significant delocalisation across both guanine and thymine moieties. Notably the lowest energy excited states with appreciable oscillator strengths, for either of the two stacked d(GpT) conformers (see Fig. 3(a) or Fig. S16, ESI§) are dominantly delocalised in character. Furthermore, prior theoretical calculations have estimated inter-nucleobase electronic coupling constants between 50 and 775 cm−1 for several dinucleotides,15,17 which is consistent with Franck–Condon delocalised adiabatic electronic states. What is more remarkable, however, is the relative intensity of the guanine cation feature appears to be very similar for the two excitation wavelengths compared to the shared G/T bleach feature at 1666 cm−1, and thus implies that the probability of d(G+pT−) formation is almost equal upon 273 and 257 nm excitation. What we are unable to determine is the absolute quantum yield for d(G+pT−) formation due to the uncertainty in the S0 d(GpT)s![[thin space (1/6-em)]](https://www.rsc.org/images/entities/char_2009.gif) :
:![[thin space (1/6-em)]](https://www.rsc.org/images/entities/char_2009.gif) d(GpT)o ratio. As such we cannot rule out competing monomer-like non-radiative pathways in photoexcited π-stacked species, wherein dynamics remain localised to either nucleobase and follow similar non-radiative decay pathways to either dGMP or dTMP. We envisage this will the dominant non-radiative decay pathway for unstacked d(GpT) molecules.
d(GpT)o ratio. As such we cannot rule out competing monomer-like non-radiative pathways in photoexcited π-stacked species, wherein dynamics remain localised to either nucleobase and follow similar non-radiative decay pathways to either dGMP or dTMP. We envisage this will the dominant non-radiative decay pathway for unstacked d(GpT) molecules.
3. General discussion
Prior TRIR studies of di- or tri-nucleotides that incorporated non-naturally abundant nucleic acids8,13 to investigate excited state charge-transfer. The incorporation of non-abundant nucleobases in these two studies increases the energy gap between the decoupled nucleobase excited states, and thus reduces inter-nucleobase dipole–dipole coupling, resulting in excited states with more localised electronic character. In the study of the dinucleotide comprised from 8-oxo-7,8-dihydroguanine (O) and adenine (d(OpA)), Zhang et al. observed a wavelength dependence to the charge-transfer product yield.13 At the longest excitation wavelength it was possible to selectively excite the O moiety in d(OpA), which initiated an inter-molecular excited state charge-transfer reaction with the adenine nucleobase yielding d(O+pA−) products. Using shorter wavelength excitation, the optically excited state was found to be delocalised across both O and A moieties, via the relative intensity of the O and A bleach features, but reacted to produce a far higher yield of d(O+pA−). The dynamics observed for the shorter wavelength excitation of d(OpA), are similar to those we have observed for d(GpT). However, the yield of d(G+pT−) products and the nature of the d(GpT) photoexcited states is seemingly independent of 273 or 257 nm excitation wavelength. Here, we have studied d(GpT), which contains naturally abundant nucleobases, and the decoupled excitation energies of the S1 G and S2 T states are very close in energy (see Fig. 2(a) and 3(a)) and thus significant electronic coupling (as evident in the transition-density matrix analyses) greatly influences the nature of the Franck–Condon excited states. We expect this will be true for di- or poly-nucleotide structures containing naturally abundant nucleobases, as the energy difference between the lowest energy excited states of all DNA bases is modest, and the dipole coupling predicted to be strong.Our combined experimental and theoretical study of a dinucleotide that contains naturally abundant occurring nucleobases supports a mechanism which is summarised by the schematic given in Fig. 10; the low-lying Franck–Condon excited states of d(GpT)s possess a mixture of charge-transfer and delocalised character that is very dependent on the precise molecular conformation. For π-stacked conformers, the lowest energy transitions with high oscillator strengths are delocalised in nature. These states mediate ultrafast (<350 fs) formation of d(G+pT−) exciplexes. In a diabatic picture, we envisage this suggests there will be a surface crossing between valence and ion-pair electronic states very close to the vertical Franck–Condon region and mediates rapid exciplex formation. The precise details of which states are involved is difficult to ascertain due to the density of near degenerate electronic states, with the energetic ordering inevitably very dependent on the precise nuclear geometry.
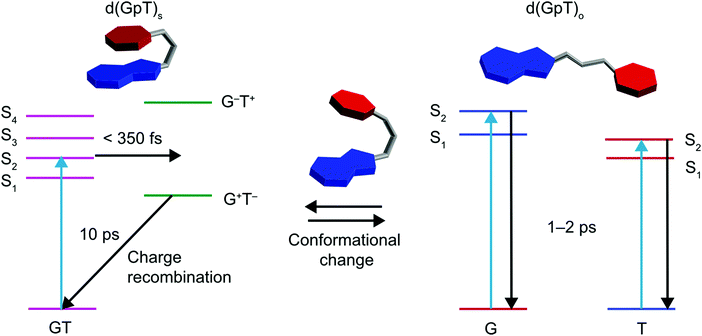 | ||
| Fig. 10 Schematic summary of photoinduced dynamics of d(GpT), where T is represented by red hexagons, G by fused blue hexagon and pentagons, and the phosphate–sugar backbone by a grey tube. | ||
Either for dinucleotides that are unstacked in S0, or even stacked d(GpT) conformers, molecules may follow a non-radiative relaxation pathway similar to the respective mononucleotides, which includes passage through conical intersections facilitating the rapid funnelling of molecules back to the ground state on a ∼1–2 ps timescale.
The studies of coupled excited state chromophores all hinge around the dynamical relationship between the so-called ‘exciton’ (adiabatic) and ‘site’ (diabatic) bases. Ideally, we would be able to follow the time-dependent coupling between different diabatic states via on-the-fly dynamical calculations, however, at the present time the computational cost for systems such as d(GpT) prohibit such simulations. From an experimental perspective, we envisage one route to address this issue is via extension of two-dimensional electronic–vibrational spectroscopy into the ultraviolet, enabling time-dependent correlations between broadband (delocalised) UV electronic excitation and (localised) vibrational emission.49–51
4. Conclusions
Ultrafast transient absorption and time resolved infrared spectroscopies, alongside theoretical calculations were used to investigate the photoinduced charge-transfer in 2′-deoxyguanosine-3′-monophosphate-5′-thymidine, d(GpT) in buffered aqueous solution. Femtosecond transient absorption spectroscopy revealed the excited state lifetime of data of d(GpT) has an additional ∼10 ps decay lifetime component of upon 273 and 257 nm photoexcitation compared to its constituent mononucleotides. Time-resolved infrared measurements (TRIR) revealed the molecular origin of this extended excited state lifetime via the presence of a vibrational signature which is univocally assigned to the guanine cation which is formed as part of d(G+pT−) exciplexes.A direct comparison of d(GpT) TRIR spectra for different excitation wavelengths indicates that the initial Franck–Condon photoexcited states of d(GpT) must be significantly delocalised across guanine and thymine moieties. Calculations show that the low-lying Franck–Condon states are comprised from a complex admixture of delocalised, charge-transfer and localised character depending on the specific nuclear configuration. These states act as a precursor to d(G+pT−) exciplexes that are formed on a <350 fs timescale, and we propose occurs via a surface-crossing between diabatic valence and ion-pair potential energy surfaces. Our study focuses on a dinucleotide structure that contains naturally abundant nucleobases, whereas prior TRIR studies8,13 have examined the dynamics of di- or tri-nucleotides incorporating non-naturally abundant nucleobases, which detunes the inter-molecular electronic coupling. Due to the very similar excitation energies of the lowest energy bright states of natural nucleobases, and the large electronic coupling dipole strengths associated between them,15,17 we expect that the dynamics we observed for d(GpT) will be representative dynamics in natural DNA sequences. The photogenerated d(G+pT−) charge-transfer products are short-lived (∼10 ps) and ground state neutral d(GpT) molecules are reformed with a high quantum yield, and may guarantee the photostability of DNA avoiding deleterious reactions (i.e. dimerisation and/or bond-cleavage) after photoexcitation.1,2
5. Methods
5.1 Sample preparation
2′-Deoxyguanosine-5′-monophosphate disodium salt (>98%) and thymidine-5′-monophosphate disodium salt (>99%) were purchased from Carbosynth and used without further purification. 2′-Deoxyguanosine 3′-monophosphate 5′-thymidine was synthesised using standard phosphoramidite coupling and deprotection procedures (see Scheme S1, ESI§).52,53 The final compound was purified by preparative HPLC. The full synthetic procedure and sample characterisation is provided in the ESI.§ For all reported spectroscopic studies, the mono- and di-nucleotides were prepared in phosphate buffered solutions (pD 7) in D2O at 10 mM concentrations. Samples were flowed continually throughout experiments in a customised flow cell. 200 μm or 50 μm path lengths for TA or TRIR experiments, respectively.5.2 Ultrafast laser spectroscopy
TA and TRIR experiments were performed using an established laser system.54 Briefly, a 1 kHz commercial ultrafast amplifier (Coherent, Legend Elite HE+) was used to pump two tuneable optical parametric amplifiers (Coherent, OPerA Solo) generating ultraviolet pump pulses (centred at 273 nm or 257 nm) and broadband mid-infrared pulses (centred at: 1625 cm−1). The white light supercontinuum employed in TA experiments was generated by focussing a very small portion of the Ti:Sapphire fundamental into a CaF2 plate (3 mm thick) which was rastered. UV pump pulses were focussed into the sample with a f = 20 cm CaF2 lens. The pump excitation power was attenuated to 500 nJ and focused to a ∼200 μm spot. Mid-infrared or white light probe pulses were overlapped with the pump beam in the sample. Signals emitted collinear to the respective probe beams were collimated and focussed into spectrographs coupled to multi-element mid-infrared mercury cadmium telluride or CCD detectors for TRIR and TA experiments, respectively. These signals were subsequently digitised and averaged for thousands of laser shots at many different pump–probe time delays. All experiments were conducted with pump and probe pulses polarised at the magic angle. The instrument response was determined to be ∼150 fs for TA and ∼350 fs for TRIR experiments via non-resonant 2-photon absorption in D2O.5.3 Computational methods
Classical molecular dynamics of d(GpT) in explicit water (2356 water molecules, one sodium cation) was performed using the Amber 14 software. Full details of this simulation are given in the ESI.§ Four representative geometries were selected and re-optimised with DFT using the ωB97X-D functional and a 6-31G* basis set. The same level of theory was used for calculations of dGMP and dTMP. Geometry optimisations were performed without enforcing any symmetry constraint. The nature of the stationary points located with DFT were verified by harmonic vibrational frequency calculations at the same level of theory. Absorption spectra of the four representative geometries were computed at the ground-state optimised geometry using LR-TDDFT within the adiabatic approximation55–57 for the first 20 singlet electronic states, with the ωB97X-D functional and a cc-pVTZ basis set. This approach was validated with resolution of the identity second-order approximate coupled-cluster benchmark calculations – full details are given in the ESI.§ Solvation effects were included in all DFT calculations using a self-consistent reaction-field (SCRF) model in which the water solvent is implicitly represented by a dielectric continuum characterised by its relative static dielectric permittivity, ε. Within the different approaches available, we employed the integral equation formalism of the polarisable continuum model (IEFPCM).58 Analysis of the LR-TDDFT results was conducted with the TheoDORE package.59 Each electronic transition displayed in the calculated spectra was generated by convolving the calculated oscillator strength with a Gaussian function of FWHM = 0.4 eV. We note that the method employed here to produce line shapes does not contain any vibronic structural information. Details of strategies to recover vibronic structure are given in ref. 60.All calculations were carried out with the Gaussian 09 package61 and molecular representations were produced with VMD62 version 1.9.2 or TheoDORE.
Conflicts of interest
There are no conflicts to declare.Acknowledgements
TAAO acknowledges financial support from the Royal Society through Royal Society University Research Fellowship (UF1402310) and Research Fellows Enhancement Award (RGF\EA\180076), and to EPSRC (EP/P010253/1). MCG thanks EPSRC for the award of an EPSRC career acceleration fellowship (EP/J002542/1) and the ERC for a consolidator grant (GLYCO-TOOLS 648239). BFEC thanks EU Horizon 2020 for the award of a Marie Skłodowska-Curie Fellowship (NAMDIA 710355). MD acknowledges EPSRC for a DTA PhD studentship, MPOH acknowledges the EPSRC Bristol Chemical Synthesis Centre for Doctoral Training for PhD funding (EP/L015366/1). The authors also thank Andrew Orr-Ewing for the use of his ultrafast laser system.References
- J. S. Taylor, Acc. Chem. Res., 1994, 27, 76–82 CrossRef CAS.
- R. P. Sinha and D.-P. Häder, Photochem. Photobiol. Sci., 2002, 1, 225–236 RSC.
- C. E. Crespo-Hernandez, B. Cohen and B. Kohler, Nature, 2005, 436, 1141–1144 CrossRef CAS PubMed.
- D. Markovitsi, T. Gustavsson and A. Banyasz, Mutat. Res., 2010, 704, 21–28 CAS.
- C. T. Middleton, K. de La Harpe, C. Su, Y. K. Law, C. E. Crespo-Hernandez and B. Kohler, Annu. Rev. Phys. Chem., 2009, 60, 217–239 CrossRef CAS PubMed.
- I. Buchvarov, Q. Wang, M. Raytchev, A. Trifonov and T. Fiebig, Proc. Natl. Acad. Sci. U. S. A., 2007, 104, 4794–4797 CrossRef CAS PubMed.
- T. Takaya, C. Su, K. de La Harpe, C. E. Crespo-Hernandez and B. Kohler, Proc. Natl. Acad. Sci. U. S. A., 2008, 105, 10285–10290 CrossRef CAS PubMed.
- D. B. Bucher, B. M. Pilles, T. Carell and W. Zinth, Proc. Natl. Acad. Sci. U. S. A., 2014, 111, 4369–4374 CrossRef CAS PubMed.
- Y. Zhang, X.-B. Li, A. M. Fleming, J. Dood, A. A. Beckstead, A. M. Orendt, C. J. Burrows and B. Kohler, J. Am. Chem. Soc., 2016, 138, 7395–7401 CrossRef CAS PubMed.
- W. J. Schreier, T. E. Schrader, F. O. Koller, P. Gilch, C. E. Crespo-Hernandez, V. N. Swaminathan, T. Carell, W. Zinth and B. Kohler, Science, 2007, 315, 625–629 CrossRef CAS PubMed.
- N. K. Schwalb and F. Temps, Science, 2008, 322, 243–245 CrossRef CAS PubMed.
- P. M. Hare, C. E. Crespo-Hernandez and B. Kohler, Proc. Natl. Acad. Sci. U. S. A., 2007, 104, 435–440 CrossRef CAS PubMed.
- Y. Zhang, J. Dood, A. A. Beckstead, X.-B. Li, K. V. Nguyen, C. J. Burrows, R. Improta and B. Kohler, Proc. Natl. Acad. Sci. U. S. A., 2014, 111, 11612–11617 CrossRef CAS PubMed.
- N. Rösch, M. Bixon, J. Jortner and A. A. Voityuk, J. Phys. Chem. B, 2000, 104, 9740–9745 Search PubMed.
- L. Blancafort and A. A. Voityuk, J. Chem. Phys., 2014, 140, 095102 CrossRef PubMed.
- R. Improta and V. Barone, Angew. Chem., 2011, 123, 12222–12225 CrossRef.
- B. Bouvier, T. Gustavsson, D. Markovitsi and P. Millie, Chem. Phys., 2002, 275, 75–92 CrossRef CAS.
- R. Improta, F. Santoro and L. Blancafort, Chem. Rev., 2016, 116, 3540–3593 CrossRef CAS PubMed.
- D. Markovitsi, D. Onidas, T. Gustavsson, F. Talbot and E. Lazzarotto, J. Am. Chem. Soc., 2005, 127, 17130–17131 CrossRef CAS PubMed.
- L. M. Nielsen, S. V. Hoffmann and S. B. Nielsen, Photochem. Photobiol. Sci., 2013, 12, 1273–1285 RSC.
- M. C. Stuhldreier and F. Temps, Faraday Discuss., 2013, 163, 173–188 RSC.
- A. L. Burin, M. E. Armbruster, M. Hariharan and F. D. Lewis, Proc. Natl. Acad. Sci. U. S. A., 2009, 106, 989–994 CrossRef CAS PubMed.
- M. C. Stuhldreier, K. Röttger and F. Temps, Ultrafast Phenomena XIX, Springer Proc. Phys., 2015, 162, 452–454 CAS.
- R. F. Brown, C. T. Andrews and A. H. Elcock, J. Chem. Theory Comput., 2015, 11, 2315–2328 CrossRef CAS PubMed.
- C. Nganou, S. D. Kennedy and D. W. McCamant, J. Phys. Chem. B, 2016, 120, 1250–1258 CrossRef CAS PubMed.
- J. R. Platt, J. Chem. Phys., 1949, 17, 484–495 CrossRef CAS.
- M. Banyay, M. Sarkar and A. Graslund, Biophys. Chem., 2003, 104, 477–488 CrossRef CAS PubMed.
- C. S. Peng, K. C. Jones and A. Tokmakoff, J. Am. Chem. Soc., 2011, 133, 15650–15660 CrossRef CAS PubMed.
- Q. Li, A. Giussani, J. Segarra-Martí, A. Nenov, I. Rivalta, A. A. Voityuk, S. Mukamel, D. Roca-Sanjuán, M. Garavelli and L. Blancafort, Chem. – Eur. J., 2016, 22, 7497–7507 CrossRef CAS PubMed.
- S. Udenfriend and P. Zaltzman, Anal. Biochem., 1962, 3, 49–59 CrossRef CAS PubMed.
- T. Gustavsson, A. Banyasz, E. Lazzarotto, D. Markovitsi, G. Scalmani, M. J. Frisch, V. Barone and R. Improta, J. Am. Chem. Soc., 2006, 128, 607–619 CrossRef CAS PubMed.
- A. E. Jailaubekov, PhD thesis, University of Southern California, 2007.
- D. Onidas, D. Markovitsi, S. Marguet, A. Sharonov and T. Gustavsson, J. Phys. Chem. B, 2002, 106, 11367–11374 CrossRef CAS.
- J. Peon and A. H. Zewail, Chem. Phys. Lett., 2001, 348, 255–262 CrossRef CAS.
- J. M. Pecourt, J. Peon and B. Kohler, J. Am. Chem. Soc., 2001, 123, 10370–10378 CrossRef CAS PubMed.
- P. M. Hare, C. E. Crespo-Hernandez and B. Kohler, J. Phys. Chem. B, 2006, 110, 18641–18650 CrossRef CAS PubMed.
- M. Etinski, T. Fleig and C. M. Marian, J. Phys. Chem., 2009, 113, 11809–11816 CrossRef CAS PubMed.
- Y. Zhang, T. A. A. Oliver, M. N. R. Ashfold and S. E. Bradforth, Faraday Discuss., 2012, 157, 141–163 RSC.
- K. Röttger, H. J. B. Marroux, M. P. Grubb, P. M. Coulter, H. Böhnke, A. S. Henderson, M. C. Galan, F. Temps, A. J. Orr-Ewing and G. M. Roberts, Angew. Chem., Int. Ed., 2015, 54, 14719–14722 CrossRef PubMed.
- J. B. Nielsen, J. Thøgersen, S. K. Jensen, S. B. Nielsen and S. R. Keiding, Phys. Chem. Chem. Phys., 2011, 13, 13821–13826 RSC.
- Y. Zhang, R. Improta and B. Kohler, Phys. Chem. Chem. Phys., 2014, 16, 1487–1499 RSC.
- M. K. Kuimova, A. J. Cowan, P. Matousek, A. W. Parker, X. Z. Sun, M. Towrie and M. W. George, Proc. Natl. Acad. Sci. U. S. A., 2006, 103, 2150–2153 CrossRef CAS PubMed.
- A. W. Parker, C. Y. Lin, M. W. George, M. Towrie and M. K. Kuimova, J. Phys. Chem. B, 2010, 114, 3660–3667 CrossRef CAS PubMed.
- M. Towrie, G. W. Doorley, M. W. George, A. W. Parker, S. J. Quinn and J. M. Kelly, Analyst, 2009, 134, 1265–1273 RSC.
- B. M. Pilles, D. B. Bucher, L. Liu, P. Gilch, W. Zinth and W. J. Schreier, Chem. Commun., 2014, 50, 15623–15626 RSC.
- G. W. Doorley, M. Wojdyla, G. W. Watson, M. Towrie, A. W. Parker, J. M. Kelly and S. J. Quinn, J. Phys. Chem. Lett., 2013, 4, 2739–2744 CrossRef CAS.
- C. A. M. Seidel, A. Schulz and M. H. M. Sauer, J. Phys. Chem., 1996, 100, 5541–5553 CrossRef CAS.
- L. Martinez-Fernandez, Y. Zhang, K. de La Harpe, A. A. Beckstead, B. Kohler and R. Improta, Phys. Chem. Chem. Phys., 2016, 18, 21241–21245 RSC.
- T. A. A. Oliver, R. Soc. Open Sci., 2018, 5, 171425 CrossRef PubMed.
- T. A. A. Oliver, N. H. C. Lewis and G. R. Fleming, Proc. Natl. Acad. Sci. U. S. A., 2014, 111, 10061–10066 CrossRef CAS PubMed.
- N. H. C. Lewis, H. Dong, T. A. A. Oliver and G. R. Fleming, J. Chem. Phys., 2015, 143, 124203 CrossRef PubMed.
- R. A. Donga, S. M. Khaliq-Uz-Zaman, T.-H. Chan and M. J. Damha, J. Org. Chem., 2006, 71, 7907–7910 CrossRef CAS PubMed.
- A. Samanta, A. Krause and A. Jaschke, Chem. Commun., 2014, 50, 1313–1316 RSC.
- K. Röttger, H. J. B. Marroux, A. F. M. Chemin, E. Elsdon, T. A. A. Oliver, S. T. G. Street, A. S. Henderson, M. C. Galan, A. J. Orr-Ewing and G. M. Roberts, J. Phys. Chem. B, 2017, 121, 4448–4455 CrossRef PubMed.
- M. E. Casida, in Recent Advances in Density Functional Methods, ed. D. P. Chong, World Scientific, Singapore, 1995, ch. 5, pp. 155–192 Search PubMed.
- E. Runge and E. K. U. Gross, Phys. Rev. Lett., 1984, 52, 997–1000 CrossRef CAS.
- M. Petersilka, U. Gossmann and E. Gross, Phys. Rev. Lett., 1996, 76, 1212–1215 CrossRef CAS PubMed.
- J. Tomasi, B. Mennucci and R. Cammi, Chem. Rev., 2005, 105, 2999–3093 CrossRef CAS PubMed.
- F. Plasser, TheoDORE 1.4: a package for theoretical density, orbital relaxation, and exciton analysis, 2016, http://Theodore-qc.sourceforge.net.
- F. Santoro and D. Jacquemin, Wiley Interdiscip. Rev.: Comput. Mol. Sci., 2016, 6, 460–486 CAS.
- M. J. Frisch, G. W. Trucks, H. B. Schlegel, G. E. Scuseria, M. A. Robb, J. R. Cheeseman, G. Scalmani, V. Barone, B. Mennucci, G. A. Petersson, H. Nakatsuji, M. Caricato, X. Li, H. P. Hratchian, A. F. Izmaylov, J. Bloino, G. Zheng, J. L. Sonnenberg, M. Hada, M. Ehara, K. Toyota, R. Fukuda, J. Hasegawa, T. Nakajima, Y. Honda, O. Kitao, H. Nakai, T. Vreven, J. J. A. Montgomery, J. E. Peralta, F. Ogliaro, M. Bearpark, J. J. Heyd, E. Brothers, K. N. Kudin, V. N. Staroverov, R. Kobayashi, J. Normand, K. Raghavachari, A. Rendell, J. C. Burant, S. S. Iyengar, J. Tomasi, M. Cossi, N. Rega, J. M. Millam, M. Klene, J. E. Knox, J. B. Cross, C. Adamo, V. Bakken, J. Jaramillo, R. Gomperts, R. E. Stratmann, O. Yazyev, A. J. Austin, R. Cammi, C. Pomelli, J. W. Ochterski, P. Y. Ayala, K. Morokuma, G. A. Voth, P. Salvador, J. J. Dannenberg, V. G. Zakrzewski, S. Dapprich, A. D. Daniels, M. C. Strain, O. Farkas, D. K. Malick, A. D. Rabuck, J. B. Foresman, J. V. Ortiz, Q. Cui, A. G. Baboul, S. Clifford, J. Cioslowski, B. B. Stefanov, G. Liu, A. Liashenko, P. Piskorz, I. Komaromi, R. L. Martin, D. J. Fox, T. Keith, M. A. Al-Laham, C. Y. Peng, A. Nanayakkara, M. Challacombe, P. M. W. Gill, B. Johnson, W. Chen, M. W. Wong, C. Gonzalez and J. A. Pople, Gaussian 09 Revision D.01, 2009 Search PubMed.
- W. Humphrey, A. Dalke and K. Schulten, J. Mol. Graphics, 1996, 14, 33–38 CrossRef CAS PubMed.
Footnotes |
| † The raw data supporting this article are archived in the University of Bristol's Research Data Storage Facility (DOI: 10.5523/bris.38purzim3u2td264im8porrguy). |
| ‡ Part of the Photodissociation and Reaction Dynamics Special Issue to coincide with the 65th Birthday of Prof. Michael N. R. Ashfold FRS. |
| § Electronic supplementary information (ESI) available. See DOI: 10.1039/c8cp07864e |
| ¶ Current address: Department of Chemistry, Imperial College London, London, SW7 2AZ, UK. |
| This journal is © the Owner Societies 2019 |

