 Open Access Article
N2+(2Σg) and Rb(2S) in a hybrid trap: modeling ion losses from radiative association paths
F. A.
Gianturco
 *a,
A. D.
Dörfler
b,
S.
Willitsch
b,
E.
Yurtsever
c,
T.
González-Lezana
 d and
P.
Villarreal
 *d
*d
aInstitut für Ionen Physik und Angewandte Physik, Leopold Franyens-Universität, Technikerstrasse 25, A-6020 Innsbruck, Austria. E-mail: francesco.gianturco@uibk.ac.at
bDepartment of Chemistry, University of Basel, Klingelbergstrasse 80, CH-4056 Basel, Switzerland
cDepartment of Chemistry, Koç University, Rumelifeneriyolu, Sariyer, TR-34450, Istanbul, Turkey
dInstituto de Física Fundamental, IFF-CSIC, Serrano 123, E-28006 Madrid, Spain. E-mail: p.villarreal@csic.es
First published on 28th March 2019
Abstract
By employing ab initio computed intermolecular potential energy surfaces we calculate the radiative association probabilities and rates for two different associative mechanisms involving trapped molecular ions N2+(2Σg) interacting either directly with ultracold Rb atoms or undergoing charge-exchange (CE) processes leading to the formation of complexes of the strongly exothermic products N2(X1Σg) plus Rb+(1S0). The two processes are expected to provide possible paths to ion losses in the trap within the timescale of experiments. The present calculations suggest that the associative rates for the ‘vibrational’ direct process are too small to be of any significant importance at the millikelvin temperatures considered in the experiments, while the ‘vibronic’ path into radiatively associating the CE products has a probability of occurring which is several orders of magnitude larger. However the reaction rate constants attributed to non-adiabatic CE [F. H. J. Hall and S. Willist, Phys. Rev. Lett., 2012, 109, 233202] are in turn several orders of magnitude larger than the radiative ones calculated here, thereby making the primary experimental process substantially unaffected by the radiative losses channel.
1 Introduction
The study of chemical processes at very low temperature, and of the detailed physics of their mechanisms at the molecular level, has strongly developed in the last decade or so. Their aims, the new scientific directions offered by their findings and the many applications associated with cold and ultracold molecules have been treated in some detail in several recent reviews and books.1–9 We shall therefore not reiterate here all the motivations and opportunities, but only note that the above analysis indicates much promise for their applications in fundamental science, precision measurements, high-resolution spectroscopy of a variety of molecular systems, quantum simulation and computing via spectroscopic interrogation of trapped molecules, and in addition provides the opportunity to explore new control aspects for chemical dynamics, made possible by the development of ultracold molecular sources.More specifically, to combine the use of radiofrequency ion traps with the additional presence of optical dipole traps and magneto-optical traps10–16 in order to achieve the simultaneous confinement of cold molecular ions and cold atoms has recently shown to yield the real possibility of studying ion–atom chemical reactions in the domain of temperatures as low as a few millikelvin. In terms of chemical processes, for example, the combination of crossed-beam experiments with three-dimensional velocity map imaging,17 has allowed the study of charge-transfer reactions between Ar+ and N2 and produced, albeit at higher collisions energies than the millikelvin regime, interesting results on the dependence of the charge-transfer on angular distribution and on its link with the chosen initial vibrational state of the neutral molecular partner. In the present work we wish to provide some additional insight via quantum calculations which deal with the low-temperature studies of charge-exchange (CE) chemical reactions that have been carried out at collision energies in the millikelvin regime and where the initial molecular partner is ionic, e.g. N2+(X+2Σ+g). The trapped molecular ion is made to interact with the Rb neutral atoms to give rise to the exothermic charge exchange process: N2+ + Rb → N2 + Rb+, which has been analyzed and discussed within the framework of a non-adiabatic, non-radiative process in ref. 15. In particular, we wish to provide with the present analysis a semi-quantitative modeling for the possible occurrence of radiative association (RA) reactions in the trap stimulated by non-zero dipolar transition moments between the states involved during the trapping process of either partners.15,17 These can either be caused by what we shall term the ‘vibrational’ RA path, i.e. the associative recombination of the initial partners: N2+(2Σg) + Rb(5s)(2S½) which produces a triatomic ion in the same electronic state, or the ‘vibronic’ RA process, whereby the associative reaction involves a transition to a different electronic state connecting asymptotically to the charge-transfer products: N2(X1Σg) + Rb+(4p6)(1S0). In other words, we want to answer, by quantum modeling of the RA paths, the following questions: can N2+ and Rb form bound states, thereby subtracting reaction partners from the trap and perhaps causing significant trap losses of the reactants? Can bound complexes be formed in a radiative transition to a charge-transfer state and therefore reduce the apparent yield of non-adiabatic charge exchange in the experiments? These questions are of relevance in the light of recent findings in atomic collision systems such Ca+/Ba+/Sr+ + Rb13,18 in which it was found that RA is the dominant reactive channel. The objective of the present paper is to theoretically assess whether RA can also be an important process in cold collision systems involving molecular ions and alkali atoms, choosing N2+ + Rb as a prototypical example.15
The processes to be analysed therefore involve the following possibilities:
the ‘vibrational’ RA process:
 | (1) |
or the ‘vibronic’ RA process:
 | (2) |
It is important to note here that a broad range of possible initial and final states are involved in the experiments, while we intend for the moment to somewhat simplify the investigation by considering only the lowest electronic state among the entrance channels, i.e. the initial state already listed above, and only the lowest electronic state among those produced by the CE reaction. In other words, the final state considered is the one just listed before and corresponding to an energy release after the CE reaction of about 11.4 eV.15
In order to analyse both of the above reactions (1) and (2), we therefore need to know the details about the atom–molecule interaction potentials which are active within the trap, generate the corresponding structure of the bound and metastable bound states of the two possible types of three-particle complexes and then model the necessary dipole-moment functions that will allow us to obtain the overall probabilities of complex formation at the relevant trap temperatures. The following Section 2 presents the computed potential energy surfaces and the relevant dipole moments, while Section 3 shows the theoretical approach for tackling the RA processes and discusses the present results. Finally, in Section 4 our present conclusions are summarized.
2 Potential energy surfaces and dipole moments
To carry out the present analysis we have focussed on the lowest electronic states involved with either the initial partners in the cold ion trap or with the final partners after the CE reaction.15 The N2+(X+2Σ+g) molecular ion and the Rb(5s)(2S½) rubidium atom are the two partners present in the specific initial channel that we shall consider. As already pointed out, more electronic states are expected to be activated in the trap by the CE process, so that several channels will be open for the final products. However, to provide an initial estimate of spontaneous/stimulated RA processes which would involve the most abundant initial electronic state of the partners, we have selected only one combination of the partners’ electronic states, i.e. the one corresponding to the energetically lowest entrance channel as discussed in ref. 15 and the one corresponding to the energetically lowest final channel after the CE reaction: the N2(1Σg) + Rb+(4p6)(1S0) product partners.15 It is also interesting to note at this point that the experimental results presented in ref. 15 indicate that the reaction involving Rb(5p)(2P![[/]](https://www.rsc.org/images/entities/char_e0ee.gif) ) as a partner of the molecular ion are considerably faster than those involving the lowest energy level of the triatomic system that we are considering here. This difference between experimental CE rates will also be discussed by us later on in relation with the magnitude of the computed RA rates of the present work.
) as a partner of the molecular ion are considerably faster than those involving the lowest energy level of the triatomic system that we are considering here. This difference between experimental CE rates will also be discussed by us later on in relation with the magnitude of the computed RA rates of the present work.
Calculations of the relevant potential energy surfaces (PES) have been performed by using the MOLPRO suite of ab initio computational programs.19 The tested basis set expansions were def2-TZVP for Rb, aug-CC-pVTZ and aug-CC-PVQZ for N, with the latter being selected for the production runs which yielded the interaction potential. The selections were done at the CASSCF level considering the complete active space for the molecular ion and an effective core potential (ECP) for the Rb atom, as defined in ref. 20. This ECP refers to 28 inner electrons, so that 9 electrons were explicitly treated and thus correlated with the nitrogen molecular species active electrons. Tests using larger basis sets for N or all electron calculations for Rb have not changed the quality of the potential energy surfaces. The wavefunctions were optimized by multi-configurational self-consistent-field (MCSCF) method employing 4 states with 6 closed shell, 9 active orbitals and 10 electrons. Starting with MCSCF wavefunctions, multi-reference configuration interaction (MRCI) calculations were carried out for the lowest 4 states. For each state, Mulliken charges on Rb atom were calculated to characterize the states as exit or entrance channel states. As expected, the lowest root always corresponded to an exit channel with Rb retaining the positive charge at medium to large distances. The entrance channel with molecular nitrogen ion was usually either the lowest 3rd or 4th root depending on the geometry of the complex. By analysing the charge on Rb, energies corresponding to both channels were selected from Davidson-rotated reference-corrected MRCI eigenvalues.21 The intramolecular distance of N2+ has been fixed at the equilibrium geometry of its |v〉 = |0〉 vibrational level (req = 1.178 Å), which is a reasonable assumption for this state since the frequency of the dimer is very high as compared with the low energy of the collisions taken into account in the RA processes and so no vibrational excitations are envisaged. Due to the sudden nature of the vibronic process, the intramolecular distance of N2 was also fixed at the same value. Then each full potential was defined on a two dimensional (2D) grid as a V(R,θ) potential. The radial distance R defines the position of either the Rb (or the Rb+) atom from the mid-point of the N2+ (or of the N2 molecule at the same geometry) bond, while the angle θ is chosen to be θ = 0° for the collinear N2+⋯Rb configuration and θ = 90° for the T-shaped geometry of the complex. The same choice of angles also apply to the final products of the CE process in the trap. The range of the angular values was considered from 0° to 90° with Δθ = 10° and the radial range extended from R = 2 Å to R = 20 Å, using about 100 points for each angular value.
In order to provide a visual assessing of the surfaces involved in the RA processes we show in Fig. 1 the corresponding contour plots. Both surfaces are smooth and present the minima at the T-shaped arrangement (upper surface dissociating into Rb and N2+) and linear geometries (lower surface dissociating into Rb+ and N2) respectively.
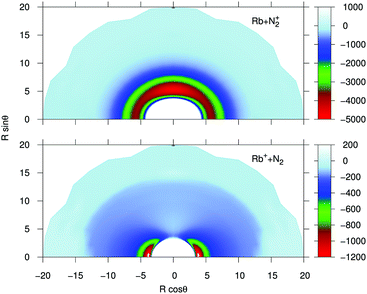 | ||
| Fig. 1 Contour plots for the computed potential energy surfaces for the processes of the present study. Distances in Å and potential values in cm−1. | ||
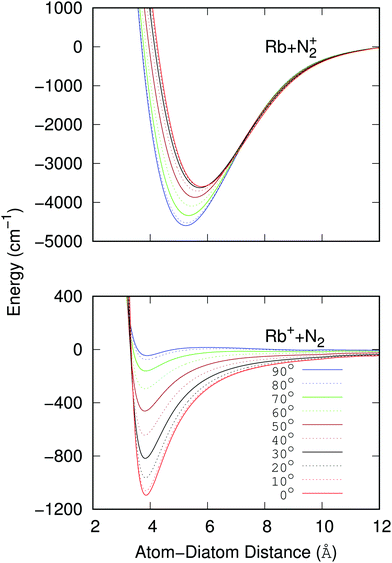
The data reported by the two panels of Fig. 2 show the radial dependence for the 0°-to-90° angular range and for ten different angular values considered for the two potentials of the present study. The radial regions of the attractive wells are shown for each ordinate and for the two sets of potential ‘cuts’. About the features reported by that figure we can make the following comments:
(i) The bound states of either of the possible triatomic complexes which would be located at the bottom of the chemical wells of the two types of potential interactions are indicating (from the range of action of the deeper well regions as well as the different equilibrium distances) that one should expect a rather diverse range of structures for the bound states of the two [N2⋯Rb]+ systems produced in processes of eqn (1) and (2) since the depths of the potential wells vary rather markedly between different orientations of the partners;
(ii) The deepest well is associated with the T-shaped complex in the case of the entrance channel given in the upper panel of the figure – although comparable with that shown at the linear configuration – while the linear structure clearly turns out to be most strongly bound in the case of the exit channel linked with the CE reaction, the former being ∼3.5 times deeper than the later. Moreover, the equilibrium distances in the entrance channel are longer (>5 Å) than those of the CE channel (∼3.75 Å). These differences in the spatial shapes of either of the electronic potentials will be playing a significant role in the calculations;
(iii) Within the radial interval 2.5 Å ≤ R ≤ 20 Å, we fitted the potential of the entrance channel at θ = 0° and θ = 90° using an expansion
 | (3) |
(iv) For the fitting of the curves of the lower panel involving the CE exit channel, we have used the following form
 | (4) |
| V upcoll | V upT | V downcoll | V downT | |
|---|---|---|---|---|
| R 0 (Å) | 5.8 | 5.25 | ||
| α (Å−1) | 0.034368 | 0.034468 | ||
| p 0 (cm−1) | −1756256.63 | −262228016.79 | ||
| p 1 (cm−1) | 12544629.15 | 1657141129.59 | ||
| p 2 (cm−1) | −30069857.17 | −4348781360.99 | ||
| p 3 (cm−1) | 26102330.12 | 6062945894.88 | ||
| p 4 (cm−1) | 3701700.96 | −4733245170.05 | ||
| p 5 (cm−1) | −17639551.38 | 1960411915.99 | ||
| p 6 (cm−1) | 7113286.78 | −336249184.65 | ||
| C 4 (cm−1 Å4) | −2437572.32 | −2869054.88 | −691768.92 | 221520.69 |
| C 5 (cm−1 Å5) | −308701429.10 | −535117.89 | ||
| C 6 (cm−1 Å6) | 5063017522.48 | −113620695.71 | 27268840.32 | −10591580.01 |
| C 8 (cm−1 Å8) | −225693428343.86 | −11575979814.12 | −800973102.58 | 215252540.69 |
| C 10 (cm−1 Å10) | 10655848942.91 | −2679823716.66 | ||
| C 12 (cm−1 Å12) | −56274742470.61 | 19810792602.71 | ||
| C 14 (cm−1 Å14) | 111187148552.10 | −56895816557.42 |
(v) Both panels in Fig. 2 show that the differences in the well depths for both systems smoothly evolve as the angular variable is moved from the collinear (C) to the 90° (T) configurations. This feature therefore indicates that we could partly simplify our treatment by taking advantage of this potential behavior by selecting its values at the two extreme orientations.
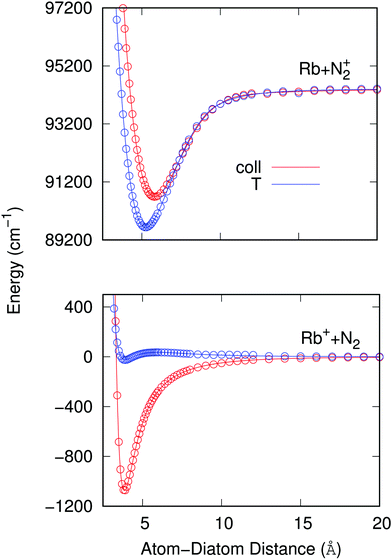
To therefore present more clearly the marked differences in the angular strengths of the two interaction potentials which we shall use in the present work, and also to stress the quality of the analytic fits performed, we show in Fig. 3 two separate panels which display only the two extreme potential energy curves for each of the two channels discussed. It will be such extreme orientations that we shall employ in our work to calculate the final cross sections. The upper panel pertains to the interaction between the partners in the entrance channel, while the lower panel shows the same extreme orientations for the interaction potential associated with the CE exit channel considered in this work. Assuming that the origin of energy corresponds to the dissociation limit Rb+ + N2, and in order to maintain the actual relative position of the two channels, the energies of the entrance channel have been shifted by an amount of 94412.79 cm−1 corresponding to the asymptotic difference between the reaction channels (11.71 eV), obtained through ECP calculations, whatever be the orientation.
It is clear from the data in that figure that the two complexes formed during the RA processes would be of very different shapes since the vibrational radiative recombination would produce bound states in both T-shaped and linear configurations, while the vibronic RA process will be dominated by bound states formed within collinear configurations. In fact, for angular momentum zero, the collinear potential supports 168 bound levels in the entrance channel and the T-shaped potential presents 172 bound levels. The situation is very different for the exit CE channel: 63 (collinear) versus 1 (T-shaped) bound levels.
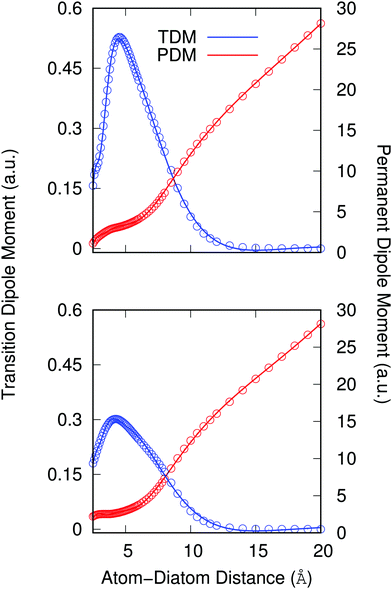
Another important element for conducting the calculations outlined in the following section is to further obtain the necessary dependence of the permanent dipole moment (PDM) function associated with the ‘vibrational’ RA process on the 2D coordinates. With the same token, we naturally need to obtain from calculations the same dependence on the chosen 2D grid of (R,θ) for the transition dipole moment (TDM) associated with the ‘vibronic’ RA process. We have carried out such calculations over the same range of variables for which the 2D PESs were computed and we present the results for the two extreme orientations in the two panels of Fig. 4. As for the interaction potentials, and in order to speed up the further dynamical calculations, we have resorted to an analytic fitting of the computed data,
 | (5) |
| μ (1,coll) | μ (1,T) | μ (2,coll) | μ (2,T) | |
|---|---|---|---|---|
| a (a.u. Å−1) | 1.9924 | 2.3506 | ||
| B 1 (a.u. Å) | −1657.0187 | −2512.4710 | −30.4821 | −12.2567 |
| B 2 (a.u. Å2) | 61845.2192 | 91540.4494 | 2392.4566 | 1064.0788 |
| B 3 (a.u. Å3) | −1036524.9314 | −1511936.2525 | −76397.9130 | −35958.5977 |
| B 4 (a.u. Å4) | 9689273.2672 | 14103040.2626 | 1312281.3620 | 634048.6655 |
| B 5 (a.u. Å5) | −55394814.5278 | −81221750.7341 | −13622697.2956 | −6616224.9115 |
| B 6 (a.u. Å6) | 201734784.634 | 299955809.2235 | 91399225.5088 | 44036454.8724 |
| B 7 (a.u. Å7) | −470485415.5217 | −712696720.3021 | −410052036.7595 | −194440568.4354 |
| B 8 (a.u. Å8) | 680834357.0876 | 1054111144.0114 | 1242108405.1710 | 577097549.5425 |
| B 9 (a.u. Å9) | −556958623.5691 | −883356826.7797 | −2507560115.7406 | −1138907266.1181 |
| B 10 (a.u. Å10) | 196915271.7597 | 320427619.5912 | 3231490357.8053 | 1433266491.7954 |
| B 11 (a.u. Å11) | −2403900607.7425 | −1040699997.5633 | ||
| B 12 (a.u. Å12) | 785190610.4123 | 331704514.4585 |
As already suggested by the angular dependence shown in the previous Fig. 3, the strength of the dipole function acting for the ‘vibronic’ process down to the exothermic CE products is the largest for the collinear approach between partners. In turn, the PDMs driving the ‘vibrational’ process in the entrance channel are almost identical for the two orientations and, except at short distances, show a linear behavior with the distance as expected.24 As already mentioned earlier, such difference of behavior will have specific effects on the results we shall present in the next section.
3 The radiative association processes
3.1 Theory
Given the rapid photon emission in the RA processes, we resort as a first attempt to apply a rotational infinite order sudden approximation as already used to treat vibrational predissociation of the van der Waals molecule HeI225 by considering fixed values of the angle θ. Moreover, because of the smooth angular dependence of the interactions, we follow a simplified approach by “freezing” the angular variable at its two extreme values of the collinear and the T-shaped interactions to proceed finally to an average of the results. Thus, we computed the RA processes as occurring for a pseudo-one dimensional (1D) problem involving two 1D potentials of V(R,0) and V(R,90) for each channel, eqn (1) and (2), extrapolated to long distances by using the expansion of eqn (3) and (4). We expect that this simple model can already provide us with valuable information on the relative importance of the two possible mechanisms mentioned earlier as dissipative paths leading to trap losses during the experimental process.15Once the relative collision energy, E, between partners is selected from the specific kinematic conditions in the trap, the RA cross section, involving a transition from a continuum initial state at angular momentum J to a discrete level (J′,v) of the upper (s = 1, vibrational process) or lower (s = 2, vibronic process) electronic state, is given, at each orientation (o = collinear or T-shaped) by:26,27
 | (6) |
 , and
, and  is the binding energy of the final complex vibrational state. Also, ps is the statistical weight of the electronic states involved in the process, k2 = 2mE with m being the reduced mass of the reactants, and c is the speed of light. Since we are dealing with radiative processes, the selection rules in the dipole approximation for Σ → Σ transitions imply the condition J′ = J ± 1 allowing only P and R branches. In turn, the necessary transition moment for the process of the interacting partners to move from the initial relative continuum energy E to a specific, final vibrational bound state is given by30
 | (7) |
The RA cross section for a given vibrational/vibronic process and orientation becomes27
 | (8) |
σ(s)(E,θ) = σ(s)0(E)P0(cos![[thin space (1/6-em)]](https://www.rsc.org/images/entities/char_2009.gif) θ) + σ(s)2(E)P2(cos θ) + σ(s)2(E)P2(cos![[thin space (1/6-em)]](https://www.rsc.org/images/entities/char_2009.gif) θ), θ), | (9) |
 | (10) |
A further step in the modeling of the present process relates to obtaining RA rates as a function of the collision temperature by convoluting the computed cross sections over a Boltzmann distribution:
 | (11) |
3.2 Results
The masses used were (amu): 86.90918 (87Rb), and 14.00674 (N), while the light speed was 137.03599 a.u. Also the following conversion factors were considered: 1 K = 0.69504 cm−1, 1 cm−1 = 4.55633 × 10⁻⁶Eh, and 1 a0 = 0.52918 Å. In order to perform reliable calculations at extremely low kinetic energies, and whatever be the orientation, we have accounted for 40![[thin space (1/6-em)]](https://www.rsc.org/images/entities/char_2009.gif) 000 points of R in the interval [2.5, 800] Å. The procedure used to solve the 1D Schrödinger equations in the discrete as well as continuum part of the spectrum, was as follows:31 the discrete energies and wave-functions were efficiently found by employing a mixed Truhlar and Numerov–Cooley procedure,32 while the continuum, energy normalized, wave-functions were calculated by using an outward Numerov propagation, assuming a sine behavior at large distances to determine the phase-shift, and by further proceeding then to an inward propagation.33
000 points of R in the interval [2.5, 800] Å. The procedure used to solve the 1D Schrödinger equations in the discrete as well as continuum part of the spectrum, was as follows:31 the discrete energies and wave-functions were efficiently found by employing a mixed Truhlar and Numerov–Cooley procedure,32 while the continuum, energy normalized, wave-functions were calculated by using an outward Numerov propagation, assuming a sine behavior at large distances to determine the phase-shift, and by further proceeding then to an inward propagation.33
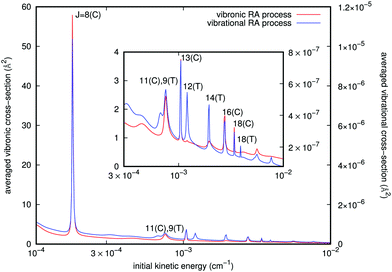
Since we have separately employed two different potential curves for each of the RA processes we are considering (e.g. see Fig. 3), we have carried out the calculations outlined above and therefore obtained two sets of cross sections for either the ‘vibrational’ or the ‘vibronic’ RA processes corresponding to the collinear and T-shaped approaches. We then obtained the averaged quantities through eqn (10). From the behavior of the potentials of Fig. 3 and of the PDM/TDM functions of Fig. 4, we have already seen that the ‘vibrational’ process can be produced in both T-shaped and linear configurations exhibiting comparable interactions, which will contribute to the corresponding cross sections. On the other hand, the ‘vibronic’ process corresponds preferentially to the linear arrangements as those yielding the strongest interactions, hence producing the largest transition cross sections for the computed RA quantities. It is therefore natural to also expect that the final vibrational distributions of the product [N2–Rb]+ complexes which are “bound” in each of the potential arrangements would also be different. An example of such contributions for both types of processes is given in Fig. 5. They were estimated from the different branches RJ and PJ. The incoming kinetic energy values which we have employed here cover a broad range of values. They actually show that in practice the largest contributions to the cross sections come in the energy range of mK. Because of the spin multiplicities of the electronic states in the processes taken into account (see ref. 15) which involve an upper state as being either singlet or triplet and a lower state to be a singlet, we have accounted for the ‘vibronic’ cross sections a weighting factor p2 = 0.25 by spin conservation, while for ‘vibrational’ ones this factor is p1 = 1. The sum over initial angular momenta went up to J = 20, numerically found to be a sufficient value for achieving convergence at the energies of interest. For both types of processes we clearly see a cluster of resonance profiles over the examined range of energies that can be associated with different trapping processes generated by the two potentials and for their specifically dominant geometries, also labelled in the figure: J = 8, 11, 13, 16, and 18 for linear orientation, and J = 9, 12, 14, and 18 at the T-shaped configuration. Furthermore, the ‘vibronic’ cross sections decrease in size from J = 8 as the relative collision energy increases while the ‘vibrational’ cross sections increase up to J = 13 and then decrease. Outside these marked resonance regions, however, the cross sections for both types of processes remain fairly slow functions of energy and maintain the large differences in size shown by the two ordinate scales. One also sees from the figure how the stronger resonances for the ‘vibronic’ processes invariably appear for the collinear geometry interaction potential, while the resonances shown by the ‘vibrational’ process cross sections come from both T-shaped and linear potential choices. In any event, the cross sections corresponding to the complex formation after the CE reaction has taken place are shown by the present model calculations to be about five to seven orders of magnitude larger than those for the ‘vibrational’ process before the occurrence of the CE reaction.
A detailed analysis of transition moments, eqn (7), is provided in Fig. 6 for one of the largest contributions, collinear R8, in the cross-sections shown in Fig. 5. There, we display the square of the corresponding vibrational and vibronic transition moments in terms of the initial kinetic energy of the colliders and of the final vibrational channel v′ (left panels), and the same multiplied by the cube of the emitted photon energy (right panels). One can clearly realize that for the vibrational process the magnitude of |M|2 is of the order of 1011 a.u., while for the vibronic one this is only of 103 a.u. In the vibrational case there is a clear peak of |M|2 near the highest vibrational level allowed, v′ = 171. In the vibronic case, in turn, |M|2 presents a maximum at low excitations, v′ = 2,3, and also there is a “tail” of several maxima towards higher vibrational levels. After including the photon energy factor (hν)3, the values of these magnitudes reverse, i.e., the vibronic process is shown to be more efficient than the vibrational one. In the vibronic process the photon energy factor is almost independent on the exiting vibrational state as the well depth of the final state is very small as compared with the difference in energy between the asymptotes of the incoming and the outgoing channels. Therefore the original structure of the couplings remains with several peaks and a maximum at v′ = 3. On the contrary, in the vibrational process there is a competition between the placing of the maximum and the energy of the exiting photon, which is lower as the vibrational exiting level is higher. So, the original structure of couplings changes by inclusion of the photon energy factor and evolves to a maximum at v′ = 130 developing some additional peaks at lower vibrational excitations.
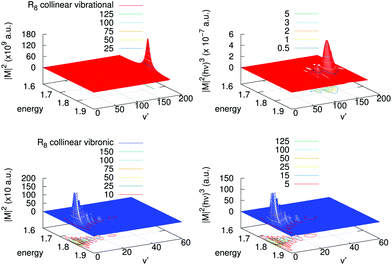 | ||
| Fig. 6 Left panels: Square of the transition moments of eqn (7) in the collinear R8 branch for the vibrational (upper) and vibronic (lower) processes. Right panels: The same multiplied by the cube of the emitted photon energy. Units of energy are 10−4 cm−1. | ||
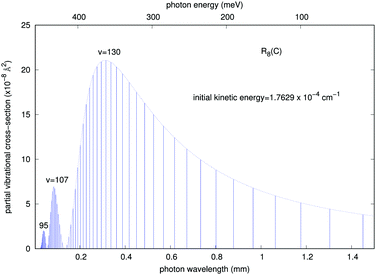
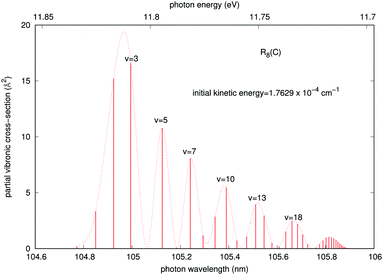
In order to gain further understanding about the physics of the involved processes, we present in Fig. 7 and 8 some additional calculations concerning the features of the outgoing photons originating from the quantum calculations for the vibrational and vibronic RA processes, respectively.
It is interesting to note that, although as mentioned earlier all partial cross sections are rather small, the calculations indicate that the emitted photon, within the range of infrared frequencies, presents a quasi-Gaussian distribution with one marked maximum appearing at a high level of v = 130, together with additional peaks at v = 107 and 95. That collinear potential curve, in fact, turns out to support about 168 vibrational levels for the bound triatomic complex in the entrance electronic channel. The smallness of the cross sections, however, already indicates that the importance of trap losses via the vibrational RA process is to be considered rather negligible.
A similar analysis regarding the general features of the emitted photons after the vibronic RA process involving the final CE product channel can be done after examining the results reported by the next Fig. 8. The behavior of the emitted photons for the ‘vibronic’ processes is clearly very different, as one should expect from the different nature of the involved potentials. The results reported in Fig. 8 correspond to calculations within the more important collinear configuration for the interacting potential, as seen from Fig. 3. The emitted photons appear in the vacuum ultraviolet region, showing strong, marked peaks at the shorter wavelengths that are associated with lower vibrational excitations (v = 2, 3) of the final complex, decreasing gradually and showing a sort of periodicity as v increases. The actual potential supports, in fact, about 61 vibrational bound states. Furthermore, we see that the partial cross sections linked to the R8 peak for the collinear approach shown earlier in Fig. 5 are now nearly eight orders of magnitude larger than those exhibited by the emitted photons for the ‘vibrational’ process in Fig. 7. We therefore expect that the association-inducing process, corresponding to RA losses after the CE reaction has occurred, should be a far more significant process than the ‘vibrational’ RA process, also discussed in the present work.
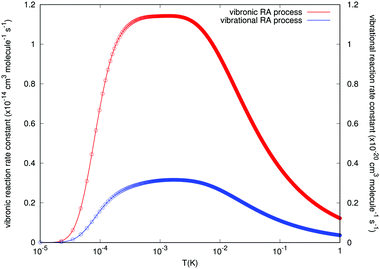
The results concerning RA rates are reported by Fig. 9, where the examined range of temperature varies from about 0.01 mK to about 1.0 K. Both types of final rates obtained from the angular-averaged cross sections discussed earlier are given in the figure. The data of the figure clearly indicate the remarkable differences in the orders of magnitude for the rates associated with the two processes we are considering in this study. We see, in fact, that the values for the ‘vibrational’ RA reaction rates remain uniformly small over the range of examined temperatures. In the region between 0.1 and 10 mK we see an increase in value, which remains almost constant, but only up to 2 × 10⁻²¹ cm3 s−1, which is a negligible rate for atom/ion losses in the trap. On the other hand, the rates for the RA ‘vibronic’ process are seen to be much larger and to show a broad distribution too in the above mentioned region around the mK region with a maximum value of 1.15 × 10⁻¹⁴ cm3 s−1. If one further considers the fact that the reactive collisions were associated in the experiments with rates which are several orders of magnitude larger, the present calculations suggest that, within the lowest temperatures achievable in the trap, the ‘vibronic’ RA process is a possibility of a greater significance than the ‘vibrational’ process, although still of fairly limited importance compared to other reactive processes such as non-adiabatic charge exchange.15
4 Conclusions
In this work we have analysed in some detail, using ab initio methods for structural and dynamics quantum calculations, the possible relevance of radiative association paths for the N2+/Rb system in a hybrid trap as discussed in recent experimental studies.15 The idea has been to assess the significance of possible processes involving the formation of bound triatomic complexes both within the initial entrance channel of the collision (which we have called the ‘vibrational’ RA path) and also after the occurrence of a CE reaction and therefore involving the product electronic configurations in forming the bound complexes (which we have called here the ‘vibronic’ RA process). Using an accurate description of the atom/ion interaction forces, we have selected a simple modeling for the RA mechanism whereby only two major paths for relative approaches between partners have been selected as the most significant for driving the RA channels: the collinear approach and the T-shaped approach perpendicular to the midbond of N2+/N2 molecular partners kept at the same molecular geometries during the fast reaction in the trap.15 Using these two 1D pictures as extreme conditions describing both types of interactions, we have obtained the RA probabilities and cross sections from a further angular averaging over a polynomial expansion of the 1D results. This physically means that the full 2D structural landscape can be efficiently described by correctly averaging the two selected major configurations. We have also noticed from the calculations that the two final PESs had different anisotropic features: T-shaped and linear orientations can contribute to the ‘vibrational’ process final states, while the ‘vibronic’ process is exclusively characterized by an interaction potential corresponding to the collinear orientation. Such differences were seen to play a significant role when calculating the transition moment matrix elements for the two dissipative paths.The final cross sections have been employed to obtain a final modeling of the RA reaction rates in the mK region of temperatures. The present calculations, albeit following a fairly simple picture of the physical processes under consideration (but employing structural data obtained from realistically accurate ab initio methods) indicate that the ‘vibrational’ RA losses of molecular ions within the trap would be a rather negligible process under the experimental conditions at which the charge-exchange collisions are studied.15 Certainly a more extended 2D modeling of the collision dynamics would improve quantitatively the reliability of the results. However, given the large difference in rates of RA processes found through the calculations shown here, one does not expect that 2D calculations would modify the present picture significantly.
Since the partner species in the entrance channel are undergoing charge-exchange reactions in the trap, we have also taken into consideration the possibility that a different RA process could occur, whereby the new partners within the formed complex would now be the N2(X1Σ+g) neutral molecule and the ionized rubidium atom Rb+(4p6)(1S0). The energetic location of the final channel is about 11.71 eV below the partners of the entrance channel for the lowest electronic state that we have considered in our model calculations. Since it would be difficult to conjecture the importance of this process without performing actual calculations, we have carried out out ab initio study of this process which would involve the ‘vibronic’ path into the lowest possible CE partners. One should notice that, although the increased energy gap in the transitions will enhance the RA cross-sections, eqn (6), the size of the overlap integrals between the initial continuum states and the final bound states, through the relevant dipole moment, may be small in this process since the final, charge-exchange potential behaves in the opposite way from the initial channel potential: now the deepest well appears for the collinear geometry of the interaction while the T-shaped approach has the shallowest well, as we have already shown in the data of Fig. 2 and of Fig. 3. In fact, for the collinear R8 branch which provides the major contribution, the squares of those overlap integrals for the vibronic RA process are nine orders of magnitude lower than the ones corresponding to the vibrational RA process, although the inclusion of the photon energy factor reverses this situation as mentioned above, see Fig. 6. At the end, we found that the cross sections and the final associative rates for the vibronic process were about six orders of magnitude larger than those pertaining to the vibrational process. Furthermore, the rate constants as a function of trap temperature (see Fig. 9) exhibit a broad maximum value around a temperature of about 1 mK, which is of the order of the temperature considered in the trap (∼20 mK) during the CE process.15 It therefore follows that this alternative process, although likely to be of limited importance when considering trap losses during the reactions discussed by the experiments15 can definitely occur with much larger probabilities than the direct process and may be about up to four orders of magnitude smaller than the primary non-adiabatic CE channel between the partners in the considered electronic state.
Another possible lower-lying state of the partner species in the trap, after the occurrence of the charge-exchange process, is the one where the neutralized nitrogen molecule is in an excited electronic state, e.g., N2(C3Πu) and still capable of interacting with the same atomic ion Rb+(4p6)(1S0). However, the different spin multiplicity of the relevant PES with respect to the initial interaction which we have discussed in this work will make the transition spin-forbidden and consequently very weak. This transition process into the RA channels would therefore be even less important than the ones we have discussed above. Generally speaking, all RA channels involving any electronically excited state of the product N2 are expected to have a considerably smaller cross section than the one involving the electronic ground state considered here because of the much smaller frequency factors in eqn (6).
From the above discussion of our exploratory calculations it therefore follows that among the possible dissipative processes involving RA mechanisms between active electronic states within the electronic potentials of the entrance channel, the one from the lowest energy configurations of reagents, which is the one used in the experimental setup of ref. 15, going into the lowest CE electronic state of the exothermic products is the most likely to play a role in an initial modelling of the RA process in the trap. Our calculations further suggest, in fact, that even if its rates are of modest size the differences are much less marked than those for the direct RA channel and should therefore be included in a fuller analysis of all processes likely to occur in the trap experiments. However, it also needs to be stressed that the reaction rate constants attributed to non-adiabatic CE in ref. 15 are several orders of magnitude larger than the radiative ones calculated here. This rationalises the experimental findings of ref. 15 in which no evidence for the formation of molecular reaction products has been found. It can thus be concluded that for the present molecular collision system nonadiabatic dynamics dominates over the radiative processes, in contrast to atomic systems investigated previously.18 Further experimental and theoretical studies are required to assess whether this is a more general feature of cold molecular ion–alkali atom collision systems.
Conflicts of interest
There are no conflicts to declare.Acknowledgements
The participating groups in Innsbruck and Basel gratefully acknowledge the Marie-Curie Initial Training Network “COMIQ: Cold Molecular Ions at the Quantum limit” for providing financial support for the present collaboration when this work was started. TGL and PV acknowledge MICINN Grants no. FIS2014-51993-P and FIS2017-83157-P. SW acknowledges support from the Swiss National Science Foundation under grant no. 200020-175533.References
- L. D. Carr, D. DeMille, R. V. Krems and J. Ye, New J. Phys., 2009, 11, 055049 CrossRef.
- D. Herschbach, Faraday Discuss., 2009, 142, 9 RSC.
- F. A. Gianturco and M. Tacconi, Faraday Discuss., 2009, 142, 463 RSC.
- Cold Molecules: Theory, experiments, applications, ed. J. R. Krems, B. Friedrich and W. C. Stwalley, CRC Press, 2009 Search PubMed.
- O. Dulieu and C. Gabbanini, Rep. Prog. Phys., 2009, 72, 086401 CrossRef.
- O. Dulieu, J. R. Krems, M. Weidemueller and S. Willitsch, Phys. Chem. Chem. Phys., 2011, 13, 1873 RSC.
- M. T. Bell and P. T. Softley, Mol. Phys., 2009, 107, 99 CrossRef CAS.
- G. Quéméner and P. S. Julienne, Chem. Rev., 2012, 112, 4949 CrossRef PubMed.
- S. Willitsch, Adv. Chem. Phys., 2017, 162, 307 CrossRef CAS.
- A. T. Grier, M. Cetina, F. Orucevic and V. Vuletic, Phys. Rev. Lett., 2009, 102, 223201 CrossRef PubMed.
- S. Schmidt, A. Härter and J. H. Denschlag, Phys. Rev. Lett., 2010, 105, 133202 CrossRef PubMed.
- W. G. Rellergert, S. T. Sullivan, S. Kotochigova, A. Petrov, K. Chen, S. J. Schowalter and E. R. Hudson, Phys. Rev. Lett., 2011, 107, 243201 CrossRef PubMed.
- F. H. J. Hall, M. Aymar, N. Bouloufa-Maafa, O. Dulieu and S. Willitsch, Phys. Rev. Lett., 2011, 107, 243202 CrossRef PubMed.
- L. Ratschebacher, C. Zipkes, C. Sias and M. Köhl, Nat. Phys., 2012, 8, 649 Search PubMed.
- F. H. J. Hall and S. Willitsch, Phys. Rev. Lett., 2012, 109, 233202 CrossRef PubMed.
- Z. Meir, T. Sikorsky, R. Benshlomi, N. Akerman, Y. Dallal and R. Ozeri, Phys. Rev. Lett., 2016, 117, 243401 CrossRef PubMed.
- S. Trippel, M. Stei, J. A. Cox and R. Wester, Phys. Rev. Lett., 2013, 110, 163201 CrossRef CAS PubMed.
- H. da Silva Jr., M. Raoult, M. Aymar and O. Dulieu, New J. Phys., 2015, 17, 045015 CrossRef.
- MOLPRO, version 2012.1, a package of ab initio programs designed by H.-J. Werner, P. J. Knowles et al., 2012.
- T. Leininger, A. Nicklass, W. Küchle, H. Stoll, M. Dolg and A. Bergner, Chem. Phys. Lett., 1996, 255, 274 CrossRef CAS.
- E. R. Davidson and D. W. Silver, Chem. Phys. Lett., 1977, 52, 403 CrossRef CAS.
- W. D. Hall and J. C. Zorn, Phys. Rev. A: At., Mol., Opt. Phys., 1974, 10, 1141 CrossRef CAS.
- C. J. Jameson and P. W. Fowler, J. Chem. Phys., 1986, 85, 3432 CrossRef CAS.
- M. Meuwly and J. M. Hudson, Mon. Not. R. Astron. Soc., 1999, 302, 790 CrossRef CAS.
- J. A. Beswick and G. Delgado-Barrio, J. Chem. Phys., 1980, 73, 3653 CrossRef CAS.
- J. F. Babb and A. Dalgarno, Phys. Rev. A: At., Mol., Opt. Phys., 1995, 51, 3021 CrossRef CAS.
- I. Iskandarov, F. A. Gianturco, F. Carelli, E. Yurtsever and R. Wester, Eur. Phys. J. D, 2016, 70, 38 CrossRef.
- A. Schadee, J. Quant. Spectrosc. Radiat. Transfer, 1978, 19, 517 CrossRef.
- F. A. Gianturco and P. Gori-Giorgi, Phys. Rev. A: At., Mol., Opt. Phys., 1996, 54, 4073 CrossRef CAS.
- K. Smith, The calculation of atomic collision processes, Wiley, New York, 1st edn, 1971 Search PubMed.
- R. Rodríguez-Cantano, T. González-Lezana, R. Prosmiti, G. Delgado-Barrio, P. Villarreal and J. Jellinek, J. Chem. Phys., 2015, 142, 164304 CrossRef PubMed.
- G. Delgado-Barrio, A. M. Cortina, A. Varadé, P. Mareca, P. Villarreal and S. Miret-Artés, J. Comput. Chem., 1986, 7, 208 CrossRef CAS PubMed.
- O. Roncero, S. Miret-Artés, G. Delgado-Barrio and P. Villarreal, J. Chem. Phys., 1986, 85, 2084 CrossRef CAS.
| This journal is © the Owner Societies 2019 |

