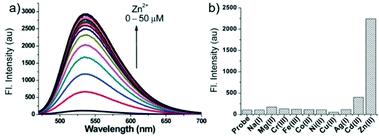
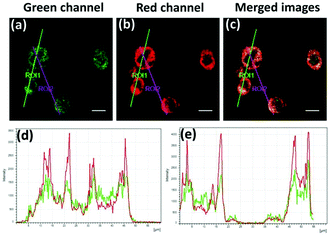
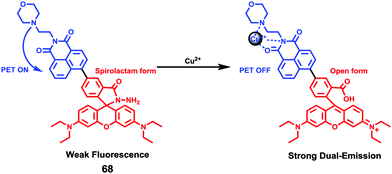
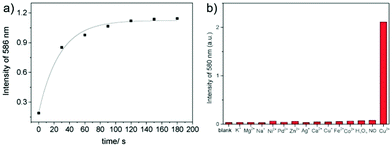
Small-molecule fluorescent probes for specific detection and imaging of chemical species inside lysosomes
Jun-Long
Zhu
a,
Zheng
Xu
b,
Yangyang
Yang
c and
Lin
Xu
 *ad
*ad
aShanghai Key Laboratory of Green Chemistry and Chemical Processes, School of Chemistry and Molecular Engineering, East China Normal University, 3663 N. Zhongshan Road, Shanghai, P. R. China. E-mail: lxu@chem.ecnu.edu.cn
bMedicinal Chemistry, Monash Institute of Pharmaceutical Sciences, Monash University, Victoria, Australia
cShanghai Key Laboratory of Chemical Biology, School of Pharmacy, East China University of Science and Technology, Shanghai, P. R. China
dState Key Laboratory of Fine Chemicals, Dalian University of Technology, Dalian 116024, China
First published on 8th May 2019
Abstract
In the past few years, the preparation of novel small-molecule fluorescent probes for specific detection and imaging of chemical species inside lysosomes has attracted considerable attention because of their wide applications in chemistry, biology, and medical science. This feature article summarizes the recent advances in the design and preparation of small-molecule fluorescent probes for specific detection of chemical species inside lysosomes. In addition, their properties and applications for the detection and imaging of pH, H2O2, HOCl, O2˙−, lipid peroxidation, H2S, HSO3−, thiols, NO, ONOO−, HNO, Zn2+, Cu2+, enzymes, etc. in lysosomes are discussed as well.
1. Introduction
Lysosomes are important cell organelles that contain more than 50 degradative enzymes, which usually have optimal activity in an acidic environment of pH 4.5–5.5.1 The acidic microenvironments in lysosomes can activate these enzyme functions to facilitate the degradation of proteins.2 For a long time, lysosomes were considered merely to be cellular waste bags as well as the stomachs of the cells. Nowadays, lysosomes are described as advanced organelles which play critical roles in cellular homeostasis and the mediation of a variety of physiological processes, such as protein degradation and plasma membrane repair.3 Pieces of evidence have shown that lysosomes are associated with the pathogenesis of diseases such as storage disorders, cancer, neurodegenerative disorders, and cardiovascular diseases.4Recent research has indicated that the chemical species (such as pH, H2O2, HOCl, O2˙−, lipid peroxidation, H2S, HSO3−, thiol, NO, ONOO−, HNO, Zn2+, Cu2+, enzyme, etc.) inside lysosomes seriously affect the status and function of these organelles.5 For example, a lysosomal proton is associated with many cellular events, including apoptosis, autophagy, and cell maturation.6 H2S inside lysosomes could cause cell death in association with the activation of calpain proteases and lysosomal destabilization.7 Excessive H2O2 in lysosomes would lead to lysosomal dysfunction or even rupture.8 HOCl could induce apoptosis of cultured cells through the rupture of lysosomes.9 Zn2+ plays an important role in lysosome dysfunction and the autophagy lysosome pathway.10 The level of Cu2+ in lysosomes is closely related to a number of neurodegenerative diseases, including Wilson's disease (WD), Menkes disease (MD) and Alzheimer's disease (AD).11 Therefore, specific detection and imaging of chemical species inside lysosomes would be very meaningful for the understanding of intracellular reaction kinetics and mechanisms, and further assisting the development of diagnostic and treatment strategies. Compared with traditional analytical techniques such as atomic absorption spectrometry, inductively coupled plasma atomic emission spectrometry, and electrochemical methods, fluorescence probes have been recognized as one of the most efficient molecular tools in biological systems due to their high sensitivity and selectivity, easiness of manipulation, real-time imaging, high spatiotemporal resolution, and nondestructive detection.12 Therefore, during the past few years, a great number of small-molecule fluorescent probes for the specific detection and imaging of chemical species inside lysosomes have been developed, which provide important concentration and distribution information of the chemical species within lysosomes. Considering the fact that significant progress has been made in this field, it is crucial and urgent to summarize the recent development of such fluorescent probes. In this feature article, we will summarize and discuss the recent advances in small-molecule fluorescent probes for specific detection of chemical species, such as pH, H2O2, HOCl, O2˙−, lipid peroxidation, H2S, HSO3−, thiol, NO, ONOO−, HNO, Zn2+, Cu2+, and enzymes, inside lysosomes.
2. General methods for delivering small-molecule fluorescent probes to lysosomes
Despite the fact that various kinds of small-molecule fluorescent probes for specific detection and imaging of chemical species inside lysosomes have been reported, there are only a few methods to deliver molecular probes to cellular lysosomes so far. The most common approach is the incorporation of weakly alkaline groups, such as morpholine, as the guiding unit to target the probe molecules into the lysosome since these acidotropic groups can help the probes selectively accumulate in acidic lysosomes through the protonation of the amine groups in a cellular acidic environment.13 Thus, usually, this kind of lysosome-specific probes contain a fluorophore as well as an amine-containing side group. For instance, LysoTracker Red is one of the commonly-used commercial lysosome probes, which has a BODIPY fluorophore and a weak basic side chain that can accumulate in acidic lysosomes.14 The other way to target the probes into lysosomes is by using a rhodamine group, which acts as not only the fluorophore but also the lysosome anchor.15 Under neutral or basic conditions, the spirolactam of rhodamine remains closed and the rhodamine derivatives are non-fluorescent. However, under acidic conditions such as within lysosomes, a proton leads to spirolactam ring-opening, which exhibits strong fluorescence emission and results in the accumulation of probes in lysosomes.Based on the above strategies, various kinds of small-molecule fluorescent probes for specific detection and imaging of chemical species such as protons, NO, H2S, H2O2, HOCl, HNO, His, Zn2+, Cu2+, and enzymes inside lysosomes have been reported. In order to make it easy to understand, in this feature article, we classified these fluorescent probes depending on the type of the guests they recognized.
3. Small-molecule fluorescent probes for the detection of lysosomal pH
As previously mentioned, lysosomes contain more than 50 degradative enzymes that play critical roles in cellular metabolism. The acidic microenvironments in lysosomes (pH 4.5–5.5) can activate these enzyme functions to facilitate the degradation of proteins. However, the minor pH fluctuation of lysosomes may induce lysosome malfunction and consequently result in lysosomal storage diseases. Therefore, it is essential to precisely monitor lysosomal pH inside living cells in order to investigate cellular functions and understand physiological and pathological processes.The spirocyclic structure of rhodamine is sensitive to the pH of the solutions.16 For example, under basic conditions, it remains in the spirocyclic form that is non-fluorescent and colorless. While in acidic solutions, the ring-open form displays strong fluorescence and pink color. More importantly, these probes based on rhodamine usually exhibit a pKa value ranging from 4 to 6, which is suitable for studying acidic lysosomes. Therefore, the rhodamine framework is popular for studying the pH of lysosomes.
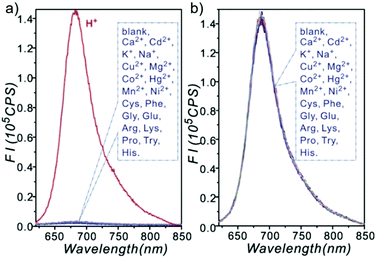
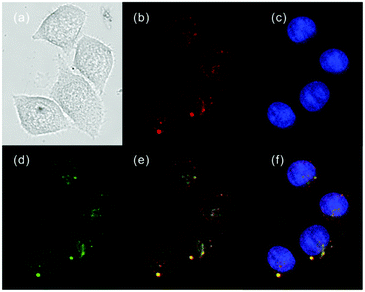
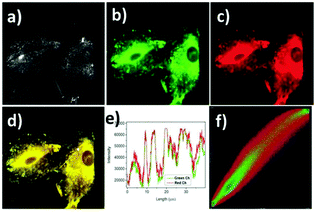
Han et al. reported a rhodamine 6G-based fluorescent probe 1 (Scheme 1).17 Analogous to commercial lysotrackers which often consist of a fluorophoric core linked to a weak base moiety, probe 1 also contains an amino group in order to preferentially accumulate in acidic organelles. The pH titration displayed that probe 1 was almost nonfluorescent at pH 7.0 or above because of its stable “ring-closed” form while the fluorescence was significantly enhanced as the pH decreased. The fluorescence intensity of probe 1 at pH 4.0 was 1500-fold brighter than that at pH 7.0, and was 100 fold brighter than that at pH 6.5, which indicated that probe 1 was a sensitive acid responsive probe capable of sensing minute pH changes in the range of pH 6.0–4.0 (Fig. 1a). The high sensitivity of probe 1 to protons and its high selectivity over interfering species that could be present inside cells such as Na+, K+, Ca2+, Co2+, Cu2+, Fe3+, Zn2+, Mg2+, HOCl, and H2O2 indicated that probe 1 was a potential selective pH sensor for applications in live cells (Fig. 1b). The double staining experiments showed that probe 1 stained the lysosomes in cells of mouse embryonic fibroblast (MEF), L929, and mouse leukaemic monocyte macrophage (Raw 264.7). Moreover, the distribution of probe 1 colocalized with lysotracker green, suggesting that probe 1 selectively stain lysosomes in live cells (Fig. 2). Further, it was found that probe 1 exhibited high stability against photo-bleaching and long retention time in lysosomes, allowing tracking of morphological alteration of lysosomes from start to finish in the process of TNF-a triggered cell death.
Zhang and Mao et al. designed a new rhodamine-morpholine fluorescent probe 2, which contains a morpholine group as the lysosome tracker (Scheme 2).18 The investigation of the fluorescence responses of probe 2 at various pH values showed that it was almost nonfluorescent at pH 7.4 because of its stable “ring-closed” form, but the fluorescence intensity of probe 2 was significantly enhanced as the H+ concentration increased to induce the opening of the spirolactam ring, which displayed a 140-fold increase in the emission intensities within the pH range of 7.4–4.5 (Fig. 3a). Moreover, probe 2 had a pKa of 5.23, which was valuable for studying lysosomal pH (Fig. 3b). The confocal fluorescence imaging experiment showed that probe 2 and LysoSensor Green displayed large overlaps, which suggested that probe 2 selectively stained lysosomes in live cells (Fig. 4). More importantly, probe 2 was successfully applied to detect the chloroquine-induced increase in lysosomal pH and monitor the lysosomal pH changes during apoptosis in live cells, which indicated that probe 2 could detect lysosomal pH changes in real time.
Zhao and Miao et al. reported a rhodamine B-based pH probe 3, which was synthesized from rhodamine B and cysteine ethyl ester (Scheme 3).19 As shown in Fig. 5a, probe 3 was nearly non-fluorescent at pH 7.51. However, significant fluorescence enhancement was observed with decreasing pH from 7.51 to 3.53 (more than 150-fold increase), which demonstrated the formation of a ring-open structure of probe 3 induced by H+ under acidic conditions. In addition, the result revealed that probe 3 with a pKa of 4.71 was suitable for studying acidic organelles (Fig. 5b). The fluorescence imaging experiments showed that the distribution of probe 3 colocalized with LysoSensor Green, which suggested that probe 3 could selectively stain lysosomes in living cells (Fig. 6). The lysosome-specificity of probe 3 might be due to N,N-diethyl groups of 3. Moreover, it was found that probe 3 could serve as a fluorescent indicator for lysosomal pH and monitor lysosomal pH changes in living cells.
After that, Zhao and Miao et al. further reported a rhodamine B-based probe 4 for detecting H+ (Scheme 4).20 The fluorescence response of probe 4 to pH was similar to that of probe 3, while probe 4 has a pKa of 5.72, which is higher than that of probe 3 (Fig. 7). The result indicated that the detection range of probe 4 could cover both normal and abnormal lysosome pH. Confocal fluorescent microscopy images displayed that the distribution of red fluorescence from probe 4 colocalized with green fluorescence from LysoSensor Green, which suggested that probe 4 selectively stained lysosomes in living cells (Fig. 8). Moreover, the fluorescence microscopy images of living HeLa cells co-incubated with bafilomycin A1 (BafA1) and probe 4 indicated that probe 4 could be used as a fluorescent indicator for lysosomal pH and to monitor lysosomal pH changes in living cells.
Zhao and Miao et al. also designed and synthesized a new rhodamine-based probe 5, which exhibited a highly selective and sensitive response to acidic pH (Scheme 5).21 The fluorescence intensity of probe 5 gradually increased about 46-fold from pH 6.7 to 4.4 with a pKa value of 5.05. Based on the 1H NMR spectra, the authors suggested that two open-ring structural forms, the amide form and the enol form, of probe 5 existed in the acidic solution simultaneously. Probe 5 could monitor intracellular pH in living HeLa as well as HUVEC cells. Moreover, it was suggested that probe 5 was valuable to measure pH changes in lysosomes as well since the fluorescence of the probe in cells weakened upon the addition of bafilomycin A1 or chloroquine that could induce a pH value increase in lysosomes.
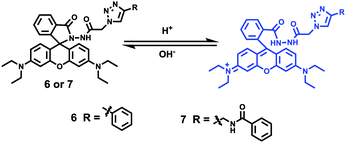
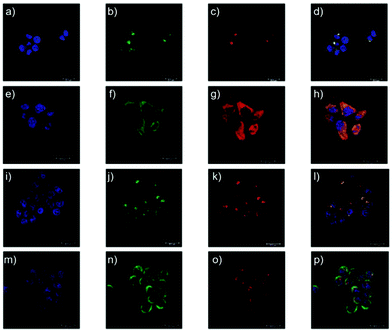
Yu and Li et al. prepared two rhodamine B-based probes 6 and 7via click reaction (Scheme 6).22 1,2,3-Triazole was introduced as an ideal bridge to improve the biocompatibility and water solubility of probes 6 and 7. The difference between probes 6 and 7 was that 7 comprised one more amide bond, which might serve as additional protonate groups under acidic conditions. The investigations of the fluorescent response of probes 6 and 7 to pH showed that the fluorescence of probe 6 increased about 35 fold from pH 7.6 to 4.0 while that of probe 7 increased about 75 fold from pH 8.0 to 4.4 (Fig. 9). Moreover, the pKa values of the two probes were calculated as 4.79 and 5.23 for probes 6 and 7, respectively. Interestingly, confocal laser scanning microscopy analysis indicated that the subcellular regions stained with probe 6 not only matched those stained with LysoTracker Green very well but also matched well with MitoTracker Green staining, while the subcellular regions stained with probe 7 only matched well with LysoTracker Green staining (Fig. 10). These results revealed that probes 6 and 7 had different locations in living cells. Moreover, compared with the two commercial dyes LysoTracker Green and MitoTracker Green, probes 6 and 7 were much less toxic, and it was suggested that probes 6 and 7 were more beneficial for biological applications in this regard.
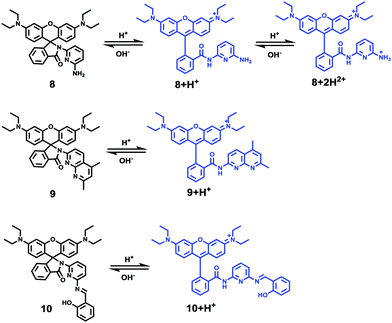
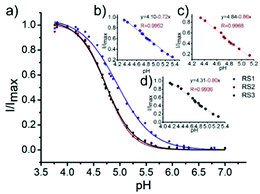
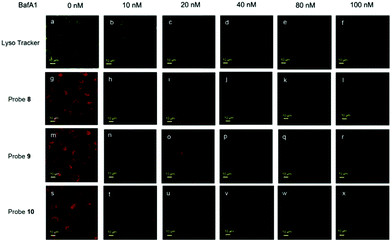
Li and Liu et al. prepared a series of rhodamine B-based probes 8, 9, and 10 (Scheme 7).23 For these probes, the functional group of 2,6-diaminopyridine was introduced and the amine side chains were protected with a flexible Schiff base or a rigid naphthyridine based on the considerations that a compound containing amine will not only have good solubility in both water and lipids but will also help the probe to accumulate selectively in an acidic environment such as a lysosome. The neutral solution of probes 8, 9, and 10 was almost colorless and non-fluorescent; however, with decreasing pH from 7 to 3.67, these probes exhibited a remarkable fluorescence emission peak at 590 nm with the solution changing from colorless to pink. It was found that the large straight line slope for probes 8, 9, and 10 was in the pH range from 4.34 to 5.35, 4.34 to 5.13, and 4.16 to 5.25, respectively (Fig. 11), which indicated that these probes have promising properties to study the pH of lysosomes in biological systems. Moreover, all of the probes could detect pH changes with high selectivity both at pH 7.0 and pH 4.2. Confocal microscopy images of living A549 cells co-stained with probes 8, 9, and 10 indicated that all of the probes could selectively stain lysosomes in living cells while probe 9 was the most promising one in terms of cell permeability and pH sensitivity in vivo. Furthermore, lysosomal pH dependent staining of A549 cells with probes 8, 9, 10, and the commercially available lysosome specific staining probe LysoTracker green DND-26 demonstrated that probes 9 and 10 could sensitively respond to lysosomal pH changes but probe 8 performed inferior to probes 9, 10, and LysoTracker (Fig. 12). The results revealed that probes 9 and 10 could be used for real-time monitoring of lysosomal pH changes sensitively. MTT assays suggested that probes 9 and 10 exhibited no obvious toxicity to the A549 cells but probe 8 was highly toxic to the cells. The authors described that the different performances including the quantum yield, cytotoxicity, cell membrane permeability and sensitivity for staining lysosomes of probes 8, 9, and 10 were attributed to the different lone pair electron distribution of the N atoms in the lactam of probes 8, 9, and 10.
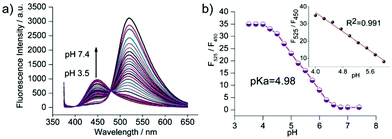
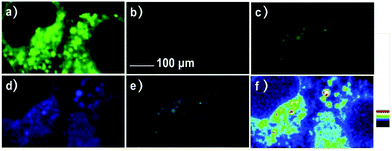
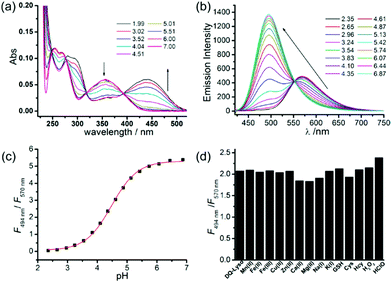
Zhang et al. designed a rhodamine B-based fluorescent probe 11 for the detection of lysosomal pH (Scheme 8).24 In probe 11, the morpholine group served as a targeting unit for lysosomes, the xanthene derivative exhibited a pH-modulated open/close reaction of the spirocycle, and the o-hydroxy benzoxazole moiety displayed a pH modulated excited-state intramolecular proton transfer (ESIPT) process. When the pH values changed from 3.5 to 7.4, the fluorescence intensity of probe 11 at 525 nm decreased significantly accompanied by a large increase in the fluorescence intensity at 450 nm (Fig. 13a), which provides the basis for achieving a ratiometric (F525/F450) detection of pH. Moreover, probe 11 exhibited an excellent F525/F450 linearity in the pH range of 4.0–6.3 with a pKa value of 4.98, which made 11 a promising ratiometric fluorescent probe for an accurate measurement of lysosomal pH (Fig. 13b). The confocal fluorescence microscopy studies showed that probe 11 could selectively stain lysosomes in living cells. Moreover, a strong fluorescence in the green channel and no obvious fluorescence in the blue channel were observed when HeLa cells were incubated with probe 11 for 30 min. However, upon the addition of chloroquine, the fluorescence intensity of the HeLa cells exhibited a time-dependent decrease in the green channel accompanied by a significant time-dependent increase in the blue channel (Fig. 14). The results proved that probe 11 could image the dynamic changes in lysosomal pH.
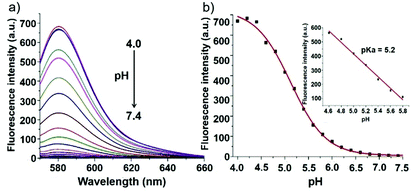
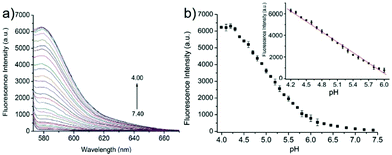
Zhao and Miao et al. reported a rhodamine B-based fluorescent probe 12, in which the positive charge was introduced to contribute to the solubility and its sensitivity to the pH environment (Scheme 9).25 At pH > 6.0, probe 12 was non-fluorescent. However, the decrease in pH gave rise to both an increase in fluorescence intensity at 580 nm and a discernible fluorescence color change concomitantly (Fig. 15a). Moreover, probe 12 exhibited a pKa value of 5.2 and displayed good linearity (R2 = 0.98905) between fluorescent intensity at 580 nm and pH ranging from 4.6 to 5.8, which implied that probe 12 could serve as a functional pH probe for weak acidic organelles like lysosomes (Fig. 15b). Confocal fluorescence imaging of living HeLa cells co-stained with probe 12 and LysosensorTM Green DND-189 suggested that probe 12 could specifically label lysosomes in cells (Fig. 16). Fluorescence microscopy imaging of living HeLa cells pretreated with chloroquine revealed that probe 12 could be used as an indicator in the monitoring of pH changes of lysosomes in living cells with a fast response.
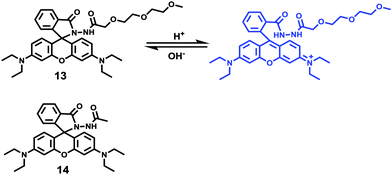
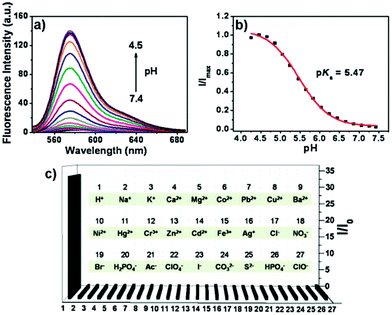
Peng and Fan et al. reported a rhodamine-based pH fluorescent sensor 13, in which a novel lysosome-locating group methylcarbitol was first introduced.26 Moreover, a contrasting molecule 14 lacking the methylcarbitol group was synthesized as well (Scheme 10). Probe 13 was almost nonfluorescent at pH 7.4 while its fluorescence was significantly enhanced as the H+ concentration increased (Fig. 17a). Within the pH range of 7.4–4.5, a 50-fold increase in the emission intensities was observed. The pH titration curve of 13 yielded a pKa of 5.47 indicating that probe 13 could detect minute pH changes in the 4.5–6.0 range, which covered both normal and abnormal lysosome pH (Fig. 17b). Moreover, no observable fluorescence enhancement of probe 13 in the presence of chemical species such as Na+, K+, Ca2+, Mg2+, Co2+, Pb2+, Ni2+, Hg2+, Cr3+, Zn2+, Cd2+, Fe3+, Ag+, Cu2+, Cl−, NO3−, Br−, H2PO4−, Ac−, ClO4−, I−, CO32−, S2−, HPO42−, and OCl− suggested that probe 13 exhibited high selectivity for H+ (Fig. 17c). Confocal fluorescence microscopy results demonstrated that probe 13 was able to stain the acidic vesicles but its contrasting molecule 14 without the methylcarbitol group could not. Confocal fluorescence imaging of living cells co-stained with probe 13 and LysoSensor™ Green DND-189 indicated that 13 selectively stained lysosomes in live cells (Fig. 18). Fluorescence images of 13 in mouse macrophages stimulated with chloroquine indicated that probe 13 was a lysosomal pH-responsive sensor in cell biology. Furthermore, probe 13 could be used to monitor changes in the acidity of lysosomes during apoptosis in live cells.
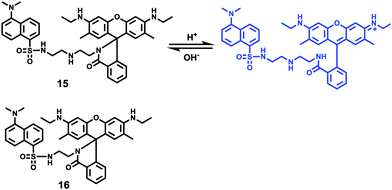
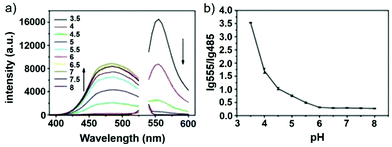
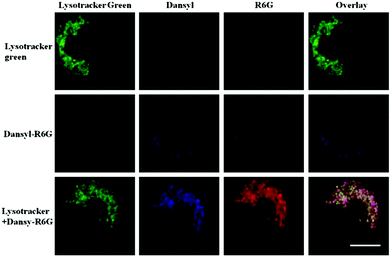
Han and Yang et al. prepared a ratiometric pH probe 15 based on a fluorescence resonance energy transfer (FRET) mechanism through the conjugation of rhodamine 6G-lactam (R6G-lactam) with dansyl chloride via diethylenetriamine (Scheme 11).27 This probe was expected to selectively accumulate in lysosomes in living cells via protonation of the amine-containing linker. The fluorescence emission centered at 555 nm, characteristic of R6G-lactam, was 800 fold brighter at pH 4.0 relative to that at pH 6.5 (Fig. 19a). In contrast to the dramatic increase of R6G-lactam fluorescence at acidic pH, the dansyl moiety exhibited decreased fluorescence emission at 485 nm. Fig. 19b revealed that subtle acidification in the range of pH 5.5–3.5 resulted in pronounced changes in the ratios of R6G-amide fluorescence intensity (I555nm) to that of the dansyl group (I485nm). It was suggested that probe 15 could be used as a molecular pH-meter for monitoring subtle acidic pH changes. Confocal microscopic analysis of L929 cells co-stained with 15 and LysoTracker Green DND-26 showed that probe 15 was exclusively confined in lysosomes (Fig. 20). The analog, 16, where R6G-lactam was linked with the dansyl moiety by ethylenendiamine, distributed both intra- and extra-lysosomally, which suggested that diethylenetriamine linker of probe 15 played a critical role in targeting lysosomes. Confocal fluorescence microscopy demonstrated that probe 15 could determine the pH of individual lysosomes and the overall lysosomal pH in living cells. Moreover, probe 15 was proved to be highly efficient in differentiating apoptosis vs. necrosis cells.
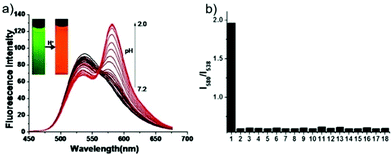
Peng et al. reported a naphthalimide–rhodamine FRET system 17 as a ratiometric and intracellular pH probe, in which 1,2,3-triazole was identified as an ideal bridge and biocompatible (Scheme 12).28 As shown in Fig. 21a, probe 17 displayed a green fluorescence colour when pH > 6.2. However, the intensity of the green fluorescence band centered at 538 nm gradually decreased and a new pink fluorescence band centered at 580 nm gradually increased when the pH changed from 7.20 to 2.00. The ratiometric calibration curve of I580nm/I538nm indicated that the pKa of 17 was 2.79. As shown in Fig. 21b, probe 17 exhibited a selective response to H+ in the presence of metal ions or amino acids. Co-localization experiments suggested that probe 17 was cell membrane permeable and localized in lysosomes (Fig. 22).
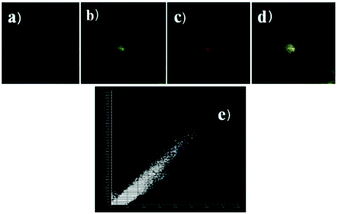
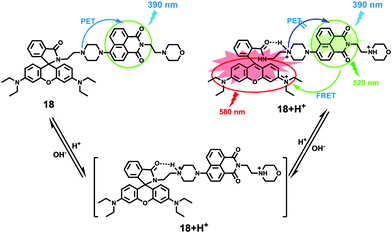
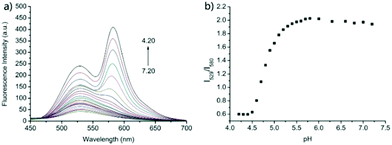
Zhao and Miao et al. prepared a ratiometric pH probe 18 comprising a naphthalimide donor and a rhodamine acceptor based on the FRET mechanism (Scheme 13).29 Probe 18 displayed very weak fluorescence at 529 nm at pH 7.20. As the pH value decreased from 7.20 to 4.20, the emission band of naphthalimide centred at 529 nm enhanced gradually accompanied by a new peak evolved at 580 nm strikingly (Fig. 23a). The interesting observation that both emission intensities of the naphthalimide (529 nm) and rhodamine (580 nm) moieties increased along with the pH decrease might be attributed to the integration of PET and FRET processes. At pH 7.20, the photo-induced electron transfer (PET) process of piperazine nitrogen quenched the fluorescence of the naphthalimide moiety. However, the addition of H+ prohibited the PET process via protonation of the nitrogen, which induced the enhancement of the fluorescence intensity of the naphthalimide. In the meantime, the H-bonding interaction between protonated piperazine N and rhodamine lactam O induced the ring-opening process of the rhodamine spirocycle, thus the FRET process from the naphthalimide donor to the rhodamine acceptor occurred accordingly. The ratio of fluorescence intensities (I529nm/I580nm) of 18 showed a significant change from pH 4.50 to 5.50 and the pKa of 18 was calculated to be 4.82 (Fig. 23b). The co-localization fluorescence imaging experiments indicated that probe 18 could detect lysosomal pH changes and selectively stain lysosomes in living cells, which was confirmed by the excellent colocalization of the red emission of 18 with the green emission of LysoSensor Green DND-189 (Fig. 24).
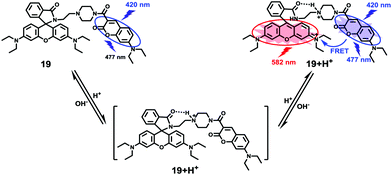
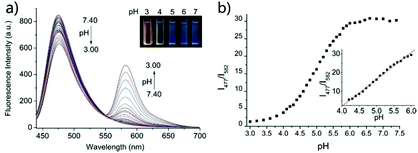
Based on a similar mechanism to the above case, Zhao and Miao et al. synthesized a FRET-based fluorescent probe 19, embracing a coumarin donor and a rhodamine acceptor, for detecting pH values (Scheme 14).30 As shown in Fig. 25a, probe 19 exhibited a strong blue emission at 477 nm at pH 7.40, which was mainly attributed to the optical properties of the coumarin moiety. As pH decreased from 7.40 to 3.00, the fluorescence intensity of the coumarin moiety decreased gradually accompanied by a new red emission peak of the rhodamine moiety appearing at 582 nm and showing an 18-fold increase. The decrease of coumarin emission (477 nm) and the concomitant increase of rhodamine emission (582 nm) along with the pH decrease were attributed to the FRET process from the coumarin moiety (donor) to the rhodamine moiety (acceptor). The pH titration of probe 19 showed that the ratios of fluorescence intensities (I477nm/I582nm) were linearly proportional to the pH value in the range of 4.20–6.00 and the pKa of the probe was calculated to be 4.98 (Fig. 25b). Moreover, fluorescence microscopy images of HeLa cells co-stained with probe 19 and LysoSensor® Green DND-189 indicated that probe 19 could selectively stain the lysosome in living cells (Fig. 26). Meanwhile, the probe exhibited desirable anti-interference ability against many analytes (metal cations, amino acids and the ATP) and displayed satisfactory photostability and low cytotoxicity in HeLa cells.
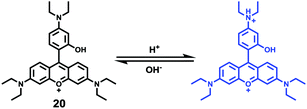
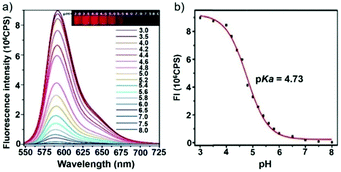
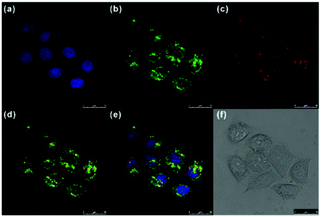
Ge and Sun et al. prepared a pH probe 20 based on rosamine, which is the decarboxylated analogue of rhodamine (Scheme 15).31 Probe 20 was non-fluorescent in neutral environments resulting from the photoinduced electron transfer (PET) by the electron donating amine-containing side chain. However, a 400-fold enhancement of the emission intensity was observed when the pH was reduced from 8.0 to 3.0 and a 13-fold increase was observed in the pH range of 4.0–6.0, indicating that probe 20 was a particularly sensitive pH probe (Fig. 27a). The pKa of probe 20 was calculated to be 4.73, which indicated that probe 20 was suitable for detecting and imaging pH in lysosomes (Fig. 27b). Confocal microscopic analysis of HeLa cells co-stained with 20 and LysoSensor Green DND-26 showed that probe 20 could be used effectively as a lysosome-specific sensor for monitoring changes in lysosomal pH during physiological and pathological processes (Fig. 28).
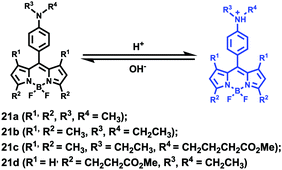
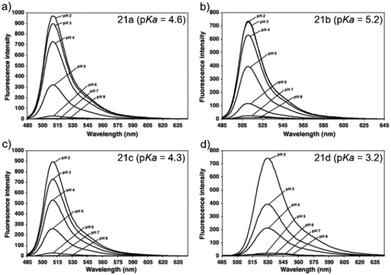
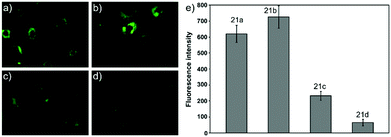
Ying et al. reported a series of BODIPY-based pH probes 21a–d (Scheme 16).32 As expected, these probes were almost non-fluorescent at neutral pH 7.0, due to photo-induced electron transfer (PET) from the aniline moiety to the BODIPY fluorophore. With pH lowering, the fluorescence intensities of these probes 21a–d increased gradually. Interestingly, these probes displayed tunable pKa values ranging from 3.2 to 5.2 because of the different substitution of the N-alkyl group on the aniline moiety and the substituent on the BODIPY fluorophore (Fig. 29). The cell images clearly showed that probes 21a–d selectively labeled the acidic organelle lysosomes. Moreover, their fluorescence intensities in the acidic lysosomes were varied based on the pKa of the pH probes, for example, probe 21b with pKa = 5.2 displayed the highest fluorescence intensity, but probe 21d with pKa = 3.2 showed the lowest fluorescence intensity. Furthermore, it was demonstrated that these probes especially probe 21b was useful for noninvasive monitoring of lysosomal pH changes during physiological and pathological processes (Fig. 30).
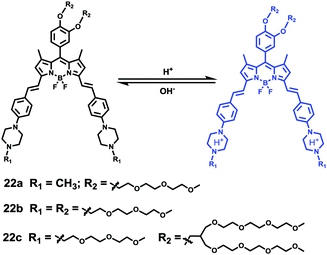
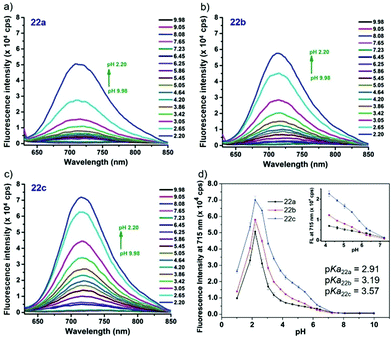
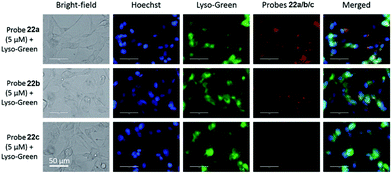
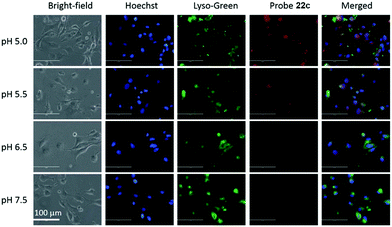
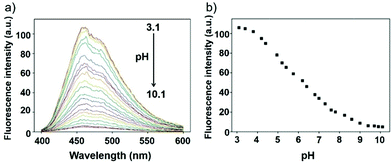
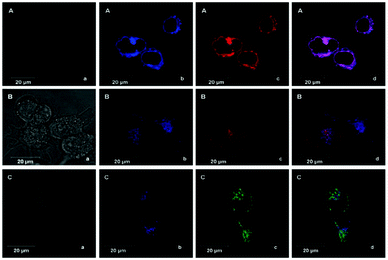
Liu, Tiwari, and Luo et al. prepared a series of BODIPY-based near-infrared fluorescent probes 22a–c for the detection of lysosomal pH (Scheme 17).33 In these probes, piperazine residues were used to manipulate the fluorescent responses to pH via the modulation of the intramolecular charge transfer (ICT) effect and potential photo-induced electron transfer (PET) of piperazine moieties at 3,5-positions to BODIPY cores at different pH values. Moreover, tri(ethylene glycol)methyl ether residues attached to piperazine moieties were used to enhance the hydrophilic properties of the probes and improve the water solubilities of the probes. Fluorescent probes 22a, 22b and 22c displayed very sensitive responses to pH. For example, a decrease of pH values from 9.98 to 2.20 caused a significant increase in fluorescence intensities at 715 nm of fluorescent probes 22a, 22b and 22c with 75-, 88- and 102-fold enhancements, respectively (Fig. 31). The pKa values of probes 22a, 22b and 22c were calculated to be 2.91, 3.19 and 3.57, respectively. Live cell imaging of probes 22a, 22b and 22c both in breast cancer cell line MDA-MB-231 and normal endothelial cell line HUVEC-C suggested that probes 22a, 22b and 22c were able to target lysosomes in a manner similar to Lyso-Sensor Green DND-189 and distinguish between different regions inside cells based on pH (Fig. 32 and 33). Probe 22a showed the highest fluorescence intensity among all three probes. However, probe 22c, the most hydrophilic compound among these three probes, displayed poor fluorescent signals. The possible reason was that probes 22a and 22b were more hydrophobic and less steric hindered than probe 22c, therefore they could more easily bind or interact with lipophilic structures such as micelles, liposomes, and membranes in lysosomes. Live cell fluorescence imaging of probes 22a–c at different intracellular pH values indicated that probe 22c was sensitive to pH not only in buffer solution but also inside the living cells. More importantly, compared with commercial probe LysoSensor, probe 22c was more sensitive to pH. For instance, probe 22c displayed very weak fluorescence in cells near physiological pH whereas its fluorescence intensity was significantly enhanced as pH decreased from 7.5 to 5.0. However, probe LysoSensor Green did not display any evident change of fluorescence at different pH values.
Li et al. reported a pH sensitive fluorescent probe 23 based on a 4-acylated naphthalimide fluorophore (Scheme 18).34 In probe 23, D-Phe–L-Phe was used to regulate the pKa and partition coefficient of the probe and N,N-dimethylethylamine was selected as the PET donor for its acidotropic property towards lysosomes. Probe 23 displayed weak fluorescence under neutral and basic conditions. However, the emission of probe 23 significantly increased as the pH decreased to acidic levels (Fig. 34). The appropriate pKa of probe 23 was 6.48, which was suitable for detecting in the pH range of 7.3–4.5. ES-2 cells were co-stained with commercial markers, including Lyso Tracker Red (LT Red), Mito Tracker Green (MT Green) and Golgi Tracker Red (GT Red), which demonstrated that probe 23 could specifically label lysosomes in ES-2 cells (Fig. 35). Moreover, the signal to noise ratio of probe 23 in lysosome imaging was much higher than that of LT Red.
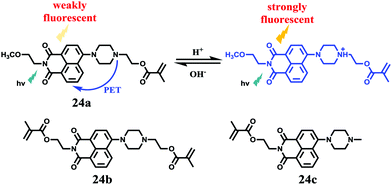
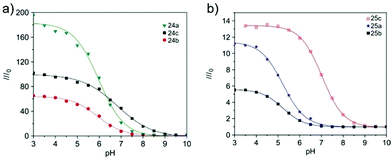
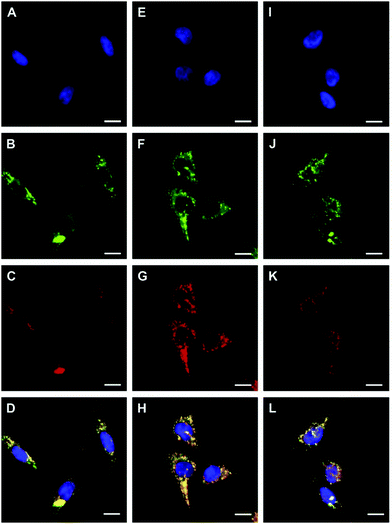
Tian et al. reported a series of pH sensitive probes 24a, 24b and 24c based on naphthalimide derivatives (Scheme 19).35 The acidity of lysosomes enabled a protonation of amino groups, and thus made probes emit brightly in lysosomes by inhibiting the photo-induced electron transfer from the amino groups to the fluorophores (Fig. 36a). Through studies in U87MG, HeLa, CP-A, and CP-D cells with confocal fluorescence microscopy, 24a, 24b and 24c were proved to be permeable and accumulated majorly in the lysosome (Fig. 37). More interestingly, these pH probes possess methacrylate moieties enabling these compounds to be used as monomers and further polymerized with other monomers for thin film preparation. Film 25 composed of the sensing moiety 24c has been successfully used as an extracellular pH sensor to monitor pH changes during the metabolism of prokaryotic Escherichia coli (E. coli). Monitoring results showed that the pH values measured with film 25 correlated well with those measured using a glass pH electrode.
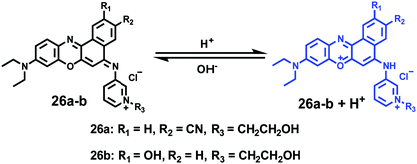
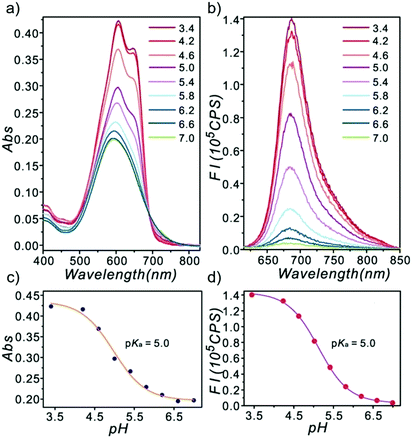
Ge and Lu et al. prepared two benzophenoxazine-based fluorescent probes 26a and 26b (Scheme 20).36 The (2-hydroxyethyl)pyridin-1-ium-3-yl group was chosen for the pH-activatable OFF–ON emission response. Moreover, electronic groups, including a cyano or a hydroxyl group, were attached to the central fused heterocycles of benzo[a]-phenoxazines to modify the pKa values for lysosome labelling. Fluorescence emission experiments revealed that they were highly sensitive and selective pH probes (Fig. 38). However, the pKa value of each was 5.0 and 5.8, which showed that the attachment of the hydroxyl group has a small effect on pKa. Moreover, probe 26a exhibited excellent selectivity to protons over other competitive species that may be present in biological systems (Fig. 39). Additionally, probe 26a with HeLa cells showed that it could be used as a lysosome-tracker both in long wavelength (633 nm) and NIR (650–790 nm) regions (Fig. 40), while probe 26b can only be used as a cytoplasm pH probe.
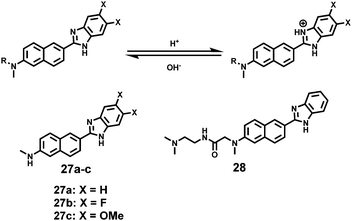
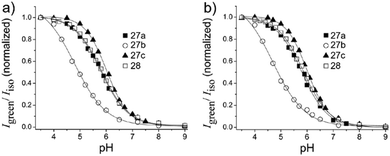
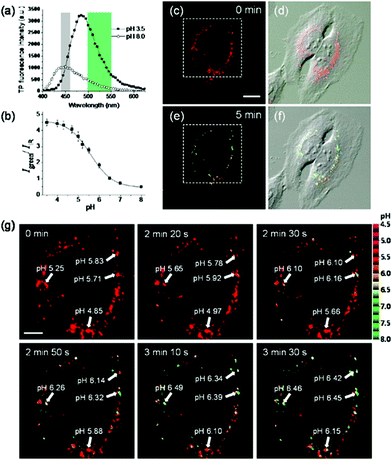
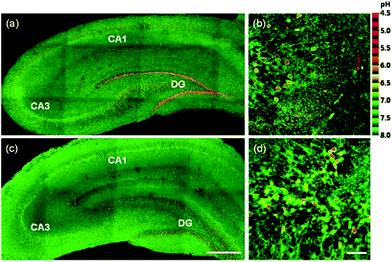
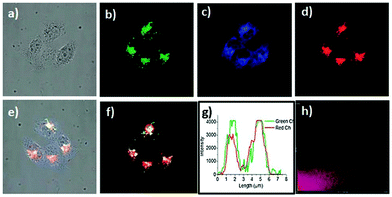
Kim et al. presented a series of ratiometric two-photon (TP) pH probes (27a–c, 28) derived from benzimidazole, which has an ideal pKa value (pKa ≈ 5.5) for acidic organelles and thus was used as a proton binding site of these probes (Scheme 21).37 These benzimidazole derivatives had pKa values ranging from 4.9 to 6.1, and their spectra showed a marked blue-to-green emission colour change in response to a pH decrease (Fig. 41). Among these derivatives, 28 was lysosomal-targeted by introducing a tertiary amine substituent to 27a (pKa ≈ 10). The pKa value of 28 was 5.82 in one-photon mode and 5.86 in two-photon mode. Probe 28 could locate in lysosomes selectively with the Pearson colocalization coefficient = 0.95 when it was co-labelled with Lysotracker Red DND-99 (LTR) in HeLa cells. The ratiometric TPM image of 28-labeled HeLa cells showed the various pH values separately and real-time pH changes inside of the lysosome compartment (Fig. 42). Moreover, 28 was capable of direct, real-time estimation of the pH values in living mouse brain tissues through use of two-photon microscopy. Fluorescence images of a fresh slice of rat hippocampus stained with 28 showed that the acidic pH was more distributed in the DG than in CA regions. Additionally, images at a higher magnification clearly showed that acidic spots stained with 28 were much clearer than those stained with 27a (Fig. 43).
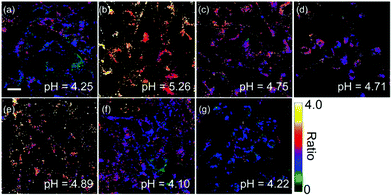
After proving the usage of quinoline derivatives as fluorophores to design fluorescent probes, Xue and Jiang et al. designed a quinoline-based fluorescent probe 29 for ratiometric detection of lysosomal pH (Scheme 22).38 A weak electron-withdrawing acetamido was introduced at the 2-position of quinolone, which could enhance the charge-transfer process and import a diverse proton receptor. In the meantime, a basic dimethylethylamino moiety was also attached to the tail of the 4-position on the quinoline fluorophore as the lysosome anchor through protonation. Probe 29 can ratiometrically and selectively respond to pH changes with an emission shift of 76 nm and calculated pKa of 4.20 ± 0.015 (Fig. 44). With 29 and LysoTracker Red DND-99 in NIH 3T3 cells, it was shown that 29 could be efficiently localized to lysosomes with a Pearson's colocalization coefficient of 0.81. Moreover, as oxidation can induce alkalization of lysosomes and acidification of cytoplasm, 29 was used to evaluate the efficiency of redox agents (Fig. 45). Probe 29 imaged and monitored lysosomal pH changes successfully after treating with H2O2 and other oxidative stress. Interestingly, the result indicated that HClO did not obviously affect lysosomal pH.
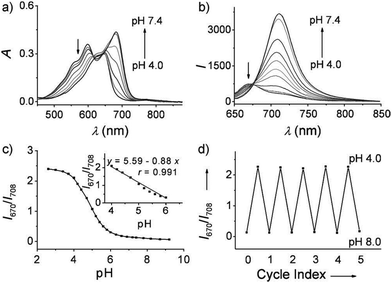
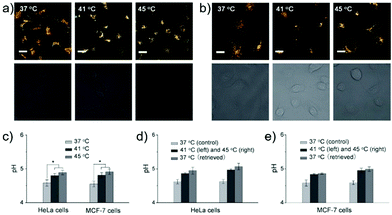
Ma et al. developed a lysosome-targeting near-infrared ratiometric fluorescent pH probe 30, by combining a typical lysosome-targeting moiety of morpholine with a hemicyanine skeleton (Scheme 23).39 This probe showed not only an excellent I670/I708 linear ratiometric response in the pH range of 4–6 in living cells, but good reversibility between pH 4.0 and pH 8.0 attributed to the protonation/deprotonation of the hydroxy group (Fig. 46). Moreover, probe 30 had stable fluorescence. It could remain almost constant after 40 minutes of continuous intensive irradiation. This reversible and stable probe 30 was used to investigate the change of lysosomal pH with temperature variation in HeLa and MCF-7 cells (Fig. 47). Notably, they revealed for the first time that the lysosomal pH value increased rather than decreased during heat shock, which meant that the pH rise process was irreversible.
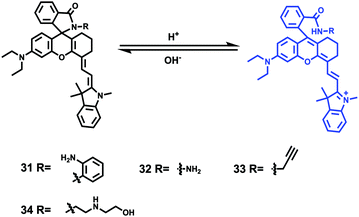
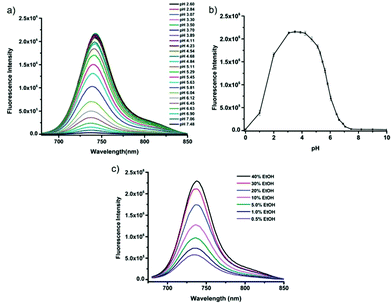
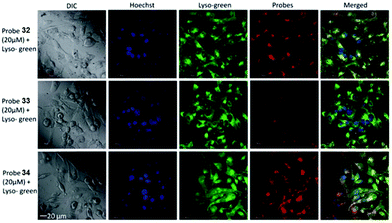
Tiwaria and Liu et al. synthesized four near-infrared fluorescent probes 31, 32, 33 and 34 containing four different residues in order to investigate the effect of hydrophobic and hydrophilic residues on the cell imaging experiments (Scheme 24).40 Probes 31, 32, 33 and 34 exhibited sensitive fluorescence responses to pH with 71-, 395-, 592- and 229-fold increases in the fluorescence intensity at 743 nm with decreasing pH from 7.4 to 4.1, respectively (Fig. 48a and b), and their pKcycl values were 5.8, 4.6, 4.9 and 5.4, respectively. It was observed that an increase of ethanol concentration in the buffer solution enhanced fluorescence intensity of the four fluorescent probes as the probe solubility had improved (Fig. 48c). All the probes except probe 31 can specially localize in lysosomes (Fig. 49). The fluorescence signal of probe 34 bearing the N-(2-hydroxyethyl) ethylene amide residue was the highest and was followed by probe 32.
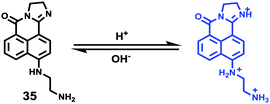
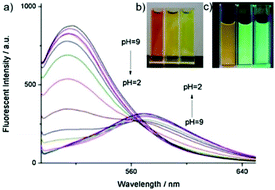
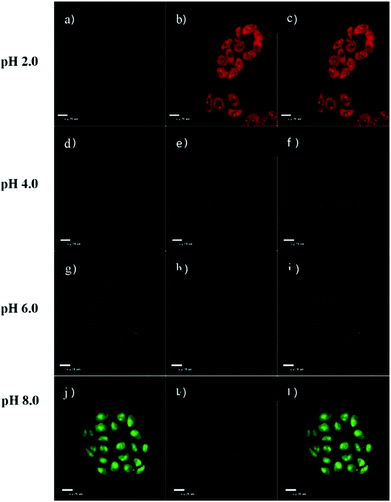
Weng and Zhou et al. reported a convenient ratiometric 1,8-naphthalimide derivative 35 with amino groups, as modification with amino groups can usually improve the solubility of molecules in both water and lipids (Scheme 25).4135 had a good fluorescence response to the pH value reversibly with a considerable Stokes shift of 45 nm because of the protonation of the imine (C![[double bond, length as m-dash]](https://www.rsc.org/images/entities/char_e001.gif) N) nitrogen (Fig. 50). It could also be used to distinguish different pH values even by the naked eye under UV excitation. With a pKa value of 5.88, 35 could measure a wide range of intracellular pH values in HeLa cells and A549 cells (Fig. 51). It showed an obvious fluorescence change from bright red to bright green with the increase of pH value. Moreover, probe 35 could also be used as a lysosome marker in living cells.
N) nitrogen (Fig. 50). It could also be used to distinguish different pH values even by the naked eye under UV excitation. With a pKa value of 5.88, 35 could measure a wide range of intracellular pH values in HeLa cells and A549 cells (Fig. 51). It showed an obvious fluorescence change from bright red to bright green with the increase of pH value. Moreover, probe 35 could also be used as a lysosome marker in living cells.
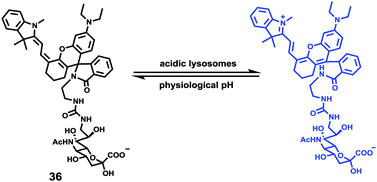
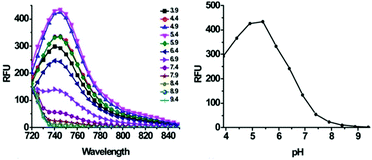
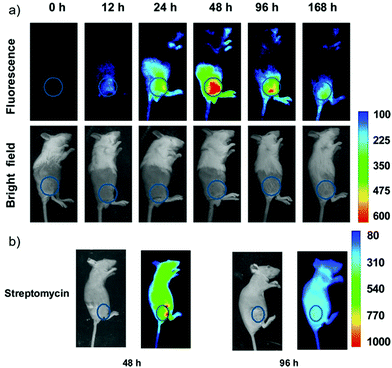
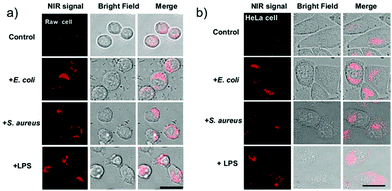
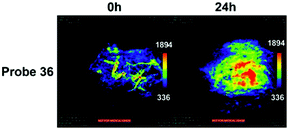
Han et al. presented an acidic-responsive near-infrared probe 36 conjugated with sialic acid (Sia) (Scheme 26).42 Probe 36 showed an optimal turn-on fluorescence response to acidic pH within pH 4.0–5.5, because of acidic pH-mediated fluorogenic opening of the intramolecular fluorophore ring (Fig. 52). Containing inflamed tissue targeting domain Sia, probe 36 was utilized for imaging inflammation in mice (Fig. 53). After injecting Escherichia coli (E. coli), Gram-positive bacteria or lipopolysaccharide (LPS) into the thigh muscle of ICR mice, intense NIR fluorescence of probe 36 was identified in the injection sites respectively, and the fluorescence would be off after immunological elimination. A similar phenomenon was observed when Raw 264.7 cells were incubated with probe 36 and natural Sia, which suggested that probe 36 could be an outstanding cellular uptake substrate even in the presence of Sia (Fig. 54). Moreover, the inflammation-associated fluorescence of nude mice was quenched after treating with antibiotics. Additionally, probe 36 also displayed turn-on optoacoustic signals under acidic settings (Fig. 55).
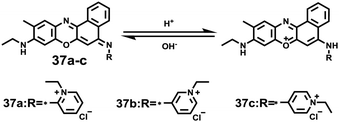
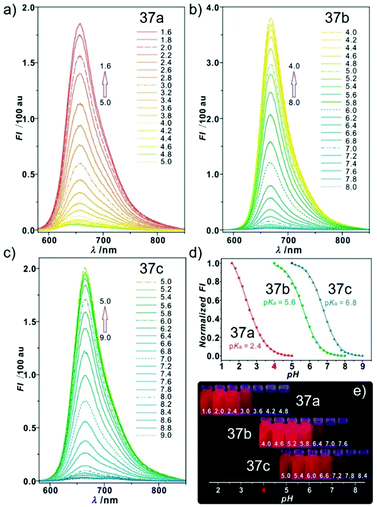
Sun and Ge et al. reported lysosome-targetable pH sensors 37a–37c which were designed aiming at selective detection of cancer cells (Scheme 27).4337a–37c were based on Darrow Red derivatives and chose a cyano group as a lysosome tracker. Because lysosome maintains an acidic environment of approximately pH 4.5–5.0 in normal cells and pH in cancer cells is lower than that in normal cells, the authors deduced that the lysosome-targetable OFF–ON type sensors for cancer cells should emit no to weak emissions at pH = 4.0. Fluorescent pH titration experiments showed that the fluorescence intensity of 37a increased 39 times from pH = 5.0 to pH = 1.6 with pKa value 2.4, fluorescence intensity of 37b was enhanced by 141-fold from pH = 8.0 to pH = 4.0 with pKa value 5.6, and fluorescence emission of probe 37c increased 91 times from pH = 9.0 to 5.0 with a pKa of 6.8 (Fig. 56). Unsurprisingly, confocal fluorescence imaging in HeLa cancer cells, V79 and KB normal cells showed that 37a entirely fitted the design aims and was found to be a lysosome tracker for cancer cells. 37b and 37c could be used as lysosome-trackers in cancer and normal cells.
Miao and Zhao et al. reported a rhodamine B-based probe 38 (Scheme 28).44 Probe 38 could measure pH values in short time (within 1.5 min at pH values of 4.60, 5.60 and 7.20), and the fluorescence intensity was linearly proportional (R = 0.99523) to pH values in the range of 4.2–6.0 (Fig. 57). Moreover, it had excellent reversibility between pH 4.60 and 7.20 (Fig. 58). In living HeLa cells, 38 could selectively stain lysosomes and the fluorescence intensity of 38 was also concentration and time dependent. More importantly, 38 could be used to quantitatively monitor the pH changes in lysosomes induced by bafilomycin A1 within HeLa cells (Fig. 59). Lysosomes have proton-pumping vacuolar ATPases and Bafilomycin A1 is a selective inhibitor of the vacuolar-type H+-ATPase (V-ATPase). Therefore, bafilomycin A1 can inhibit lysosomal acidification, thereby regulating the lysosomal pH environment. Incubating different concentrations of bafilomycin A1 for 6 h, and then 2.5 μM 38 for 1 h, gradually weakened fluorescence intensities with increased concentration of bafilomycin A1 in HeLa cells were observed.
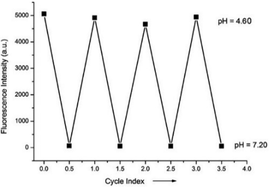 | ||
| Fig. 58 The pH reversibility of probe 38 between pH 4.60 and 7.20. Copyright 2015 Royal Society of Chemistry. | ||
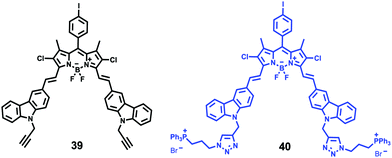
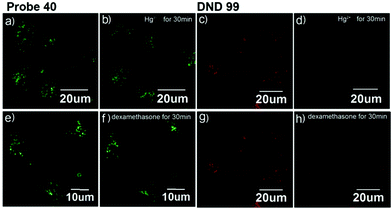
Xiao et al. introduced a near-infrared (NIR) lysosomal probe 40 based on their previously reported probe 39 (Scheme 29).45 The chemical structure of probe 40 was interestingly unusual since it was functionalized with two triphenylphosphonium (TPP) moieties from 39via click chemistry. Because the mitochondrial membrane has typically a negative potential, positively charged TPP moieties are usually used as mitochondrial delivery vehicles instead of lysosome-targeting moieties. In this case, the two TPP moieties endowed the probe with lysosome-targeting capability by mediating the probe's hydrophilic–lipophilic balance. In lysosomes, this probe showed intensive near-infrared (NIR) fluorescence and better photostability compared with commercial lysosomal tracker NR and 39 (Fig. 60). Moreover, probe 40 demonstrated stable targeting ability and stable fluorescence against lysosomal pH changes. This feature was rare but valuable because most currently used lysosomal probes will lose their fluorescence or even leave lysosomes once the pH rises. However, pH values of lysosomes in different physiological status are different. Thus, probe 40 was suitable for tracking lysosomes under different physiological status including apoptosis and poisoning.
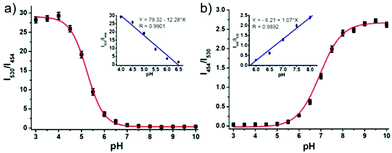
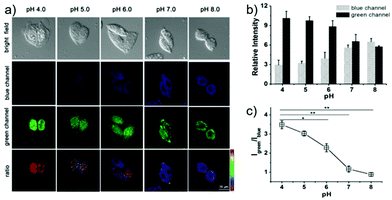
Lin et al. developed a novel dual site-controlled and lysosomal-targeted ICT-PET-FRET fluorescent probe 41 for monitoring lysosomal pH in living cells (Scheme 30).46 The probe employed coumarin and naphthalimide fluorophores as the donor and acceptor to construct the FRET platform, and adopted hydroxyl and morpholine as the two pH sensing sites to control the fluorescence of coumarin and naphthalimide by ICT and PET, respectively. With the pH changing from 3.0 to 10.0, the fluorescence changed from the green fluorescence of the naphthalimide unit to the blue fluorescence of the coumarin unit. Under the synergistic effect of ICT, PET and FRET, 41 had an excellent response and high sensitivity to pH (Fig. 61). Moreover, the fluorescence ratio of 41 was linearly related to pH over a wide range of pH 4.0 to pH 8.0. Probe 41 had no significant toxicity to living cells and had ideal lysosomal targeting properties, thus was successfully applied to fluorescence imaging of lysosomal pH (Fig. 62).
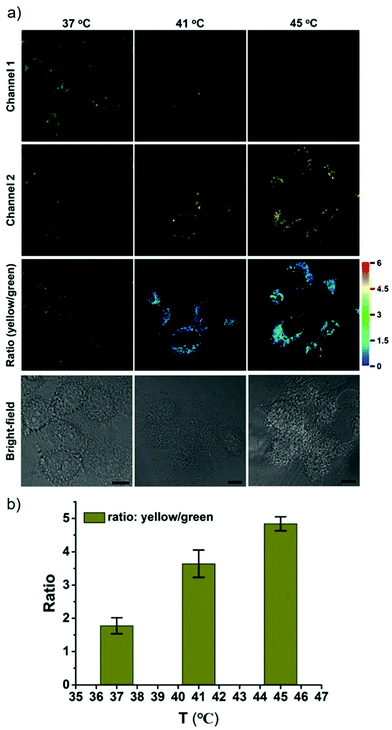
James, Jia and Huang et al. synthesized a new ratiometric fluorescent probe 42 that could be used to detect the interplay between lysosomal behaviour and heat stroke (Scheme 31).47 The maximum absorption of 42 gradually red-shifted from 430 nm to 538 nm with pH values increasing from 3 to 11. Upon excitation at 473 nm, a decrease of fluorescence emission intensity at 522 nm accompanied by an increase of fluorescence emission intensity at 557 nm was observed when the pH value of the solution increased, indicating the ratiometric fluorescence sensing of probe 42 for pH changes. Colocalization experiments indicated that probe 42 was a lysosomal specific labelling probe and could be used for the ratiometric fluorescence sensing of pH changes of lysosomes in live cells, in which the morpholine displayed the ability to improve the lysosome-targeting specificity. More importantly, probe 42 was able to sense the fluctuation of lysosomal pH ratiometrically under heat stroke in live HeLa cells, which showed a gradual decrease in green fluorescence (channel 1, 500–550 nm) and simultaneous enhancement in the yellow fluorescence (channel 2, 570–620 nm) as the temperature increased from 37 °C to 41 °C, then to 45 °C (Fig. 63). The fluorescence emission ratio values of average emission intensity for yellow images (channel 2) and green images (channel 1) were calculated to be increased from 1.78 to 4.84 under heat stress. This work provided an effective ratiometric imaging tool for mapping lysosomal pH changes in live cells under a heat shock stimulus.
4. Small-molecule fluorescent probes for the detection of reactive oxygen species (ROS) inside lysosomes
During the metabolism, the body produces different kinds of reactive oxygen species (ROS), including superoxide (O2˙−), hydroxyl radicals (˙OH), peroxy radicals (˙OOR), single oxygen (1O2), and hypochlorous acid/hypochlorite (HOCl/ClO−) and hydrogen peroxide (H2O2). It has been reported that reactive oxygen species in lysosomes play a crucial role in the pathogenesis of many serious diseases such as cancer, neurodegenerative diseases and cardiovascular diseases.48 Therefore, effective monitoring of ROS level in living cells and tissues is very important for human health.4.1 Small-molecule fluorescent probes for the detection of H2O2 inside lysosomes
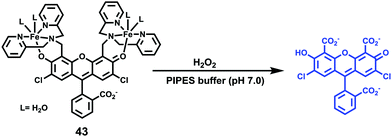
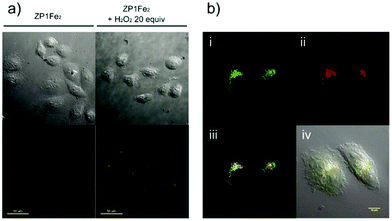
Hydrogen peroxide (H2O2) is a major member of reactive oxygen species (ROS) and has a variety of physiological functions, including respiration, host defense, intracellular signaling, and immune responses.49 Excess H2O2 in lysosomes leads to lysosomal dysfunction and even rupture due to autophagy and apoptosis. Therefore, it is important to detect lysosomal H2O2 in living cells.You and Nam et al. developed a new fluorescent probe 43 for H2O2 (Scheme 32).50 Unlike previous experiments utilizing H2O2 to oxidize Fe2+ for the fluorescence detection of H2O2, probe 43 was developed based on the cleavage of the paramagnetic Fe ionophore from the fluorophore, which afforded exceptional selectivity for H2O2 over other ROSs. The addition of an excess of H2O2 to the solution of 43 provoked a significant fluorescence turn-on with a 22-fold increase in the fluorescence quantum yield. However, the addition of O2˙−, −OCl, t-BuOOH, NO, 1O2, (NH4)2CeIV(NO3)6 (CAN), and 2,3-dichloro-5,6-dicyano-pbenzoquinone (DDQ) did not produce fluorescence turn on, and only a small increase in the fluorescence intensity was observed in the cases of t-BuO˙ and ˙OH. The limit of detection (LOD) of probe 43 for H2O2 was determined to be 29 μM. Colocalization experiments showed that the fluorescence patterns of 43 and the LysoTracker-Red signals were overlapped perfectly, which indicated unambiguously that the fluorescence response was localized at the lysosome (Fig. 64).
Zhang et al. reported a two-photon cell-permeable fluorescent probe myeloperoxidase MPO-44 through the combination of MPO with probe 44 since myeloperoxidase (MPO) has many advantages such as specific reactivity and selectivity to convert “H2O2 + Cl−” into hypochlorite, good cell-permeability, and lysosomal retention (Scheme 33).51 The probe could be used to visualize exogenous or endogenous H2O2 with high selectivity and sensitivity. In the presence of MPO, hypochlorite-sensitive ZnSalen 44 showed a selective turn-on response to H2O2 in acidic buffer pH (4.5–6.0) aqueous solution, while other bio-related ROS interference can be ignored. Subcellular localization of the probe MPO-44 assay showed that the probe MPO-44 exhibited good colocalization with that of LysoTracker Green DND-26, with a Pearson's correlation coefficient of 0.92 and an overlap coefficient of 0.94 (Fig. 65).
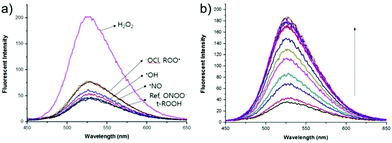
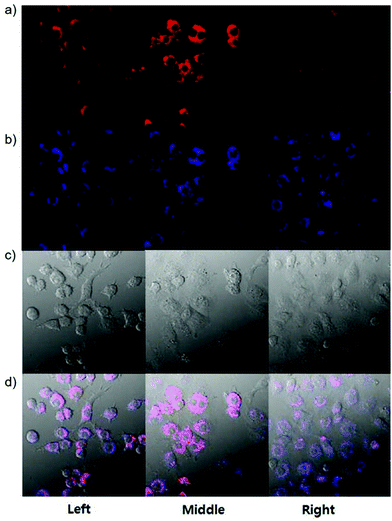
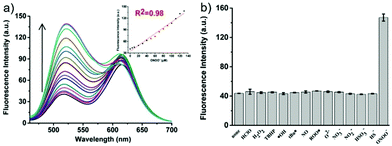
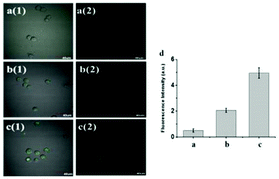
p-Dihydroxyborylbenzyloxycarbonyl has been proved to be an efficient moiety for the detection of H2O2. Recently, Yin and Yoon et al. reported a borate-based hydrogen peroxide (H2O2) probe 45 with a morpholine moiety as the lysosome-directing group (Scheme 34).52 Probe 45 exhibited high selectivity and sensitivity for H2O2. As shown in Fig. 66, the addition of H2O2 into the solution of probe 45 induced an obvious increase in the fluorescence intensity. However, under the same condition, slight changes were observed after incubation with various ROSs including ˙OH, ONOO−, ˙OOR, ˙NO, ClO−, and t-ROOH. The investigation of the fluorescence titration of probe 45 upon addition of H2O2 showed that an obvious fluorescence enhancement was observed along with increasing H2O2. More interestingly, confocal microscopy images of probe 45 indicated that probe 45 was a lysosome-targetable H2O2 indicator and could be used as an efficient tool to monitor the level of exogenous and endogenous H2O2 in the living cells. As shown in Fig. 67, owing to the existence of endogenous H2O2 released from the RAW 264.7 cells, the confocal microscopy image of probe 45 displayed a red emission. Moreover, since more endogenous H2O2 was produced by treating RAW 264.7 cells with PMA (Phorbol 12-myristate 13-acetate, 1 mg mL−1), a significant fluorescence enhancement was observed. The subsequent addition of TEMPO (2,2,6,6-tetramethylpiperidine-1-oxyl, 100 mM), a ROS scavenger to block H2O2, resulted in a significant decrease in the fluorescence intensity. Furthermore, probe 45 could be used for monitoring the level of H2O2 in the living cells over time. As shown in Fig. 68, the fluorescence image displayed a weak red emission when the HeLa cells were not treated with H2O2. However, when the HeLa cells were incubated with H2O2, an increasing red emission was observed from the confocal microscopy images and a stronger red emission was observed over time.
4.2 Small-molecule fluorescent probes for the detection of HOCl inside lysosomes
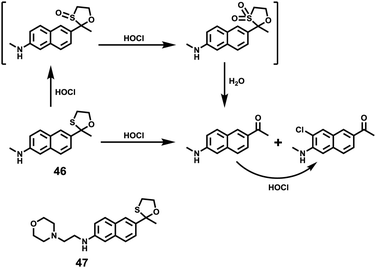
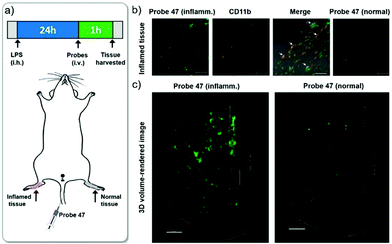
Hypochlorous acid (HOCl) is one of the important reactive oxygen species (ROS) that can be synthesized by hydrogen peroxide and chloride under myeloperoxidase (MPO) catalysis. HOCl is a weak acid (pKa = 7.6) and mainly distributed in the acidic organelle lysosome of macrophages. Although it is present in extremely low concentration, it plays a key role in the immune defense against invading bacteria and other pathogens.53 Abnormal accumulation of HOCl in phagocytes can induce various diseases such as rheumatoid arthritis, neuronal degeneration, Parkinson's disease and cerebral ischemia. Therefore, chemosensors that achieve imaging or quantification of HOCl are necessary for investigations of HOCl related biological processes. Until now, a large number of fluorescent probes for sensing of HOCl have been reported based on the HOCl-mediated oxidation reaction with recognition groups, such as special carbon–nitrogen double bonds, sulfide, selenide, rhodamine-based spirane structure, p-methoxyphenol, and pyrrole and some other methods.54 However, only a few fluorescent probes could detect HOCl inside lysosomes.Chang et al. developed the lysosomal targetable two-photon fluorescent HOCl probe 47 (Scheme 35).55 In this probe, a well-known two-photon fluorophore Acedan was chosen as the fluorescence reporting group due to its excellent photophysical properties whilst 2-mercaptoethanol was employed to be the protecting group because the thiol atom in methionine could be easily oxidized to sulfoxide by HOCl thereby changing the fluorescence of the probe. Lysosome-targetable group morpholine was introduced to ensure the probe's intracellular localization. For comparison, a two-photon fluorescent HOCl probe 46 without the morpholine group was prepared as well. Based on the oxidative deprotection mechanism, a fast response (within a few seconds) and good sensitivity (<20 nM) of these probes to HOCl were achieved with excellent selectivity over other ROS and biomolecules. Cell imaging experiments showed that probe 47 displayed good cell penetration and lysosomal localization ability in living cells and could be successfully utilized to detect HOCl in lysosomes. In particular, two-photon imaging of 47 indicated that more HOCl can be detected in the lysosome of macrophages during inflammatory conditions in a murine model. As shown in Fig. 69, strong fluorescence from 47 in LPS-stimulated macrophage cells was observed in inflammation tissues, which was conducted by subcutaneous injection of 200 μL of LPS (1 mg mL−1) into the right rear paws of mice and subcutaneous injection of 47 into the paw skin after 1 day. Therefore, these probes not only could help elucidate the distribution of subcellular HOCl, but also served as excellent tools to exploit potential functions of HOCl at subcellular and tissue levels.
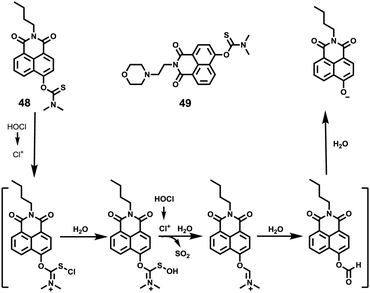
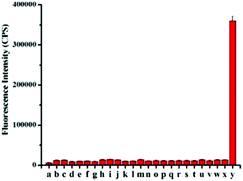
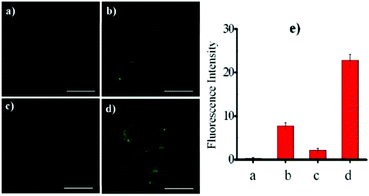
Based on the intramolecular charge transfer (ICT) mechanism, Tang et al. synthesized a two-photon fluorescence probe O-(N-butyl-1,8-naphthalimide)-4-yl-N,N-dimethylthiocarbamate (probe 48) employing N,N-dimethylthiocarbamate (DMTC) as the recognition receptor for HOCl since HOCl can oxidize sulfide-type amino acids through the initiation of an electrophilic addition of chlorinium ion (Cl+) from the decomposition of HOCl (Scheme 36).56 Probe 48 displayed excellent selectivity, which may be attributed to oxidative cleavage of the DMTC moiety by electrophilic addition of Cl+ (Fig. 70). The detection limit of 48 to HOCl was 7.6 pM, which was the first fluorescent probe that can accurately determine the picomolar level of HOCl. The lysosome-targetable fluorescent probe 49 was obtained by introducing an alkylmorpholine group into the 48 platform, and its ability to image HOCl in lysosomes was confirmed. Two-photon confocal fluorescence imaging studies suggested that 49 was capable of monitoring native and the fluctuation of endogenous HOCl levels in lysosomes of live macrophages (Fig. 71).
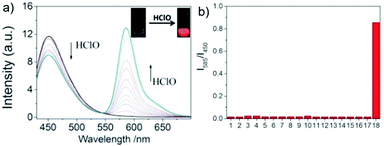
Lin et al. designed and synthesized a lysosomal-targeted ratiometric fluorescent HOCl probe 50 based on the mechanism of ESIPT and rhodol ring opening processes (Scheme 37).57 Before reacting with HOCl, probe 50 adopted its spirocyclic form and meanwhile the ESIPT process occurred between the phenolic hydroxyl group and the N atom of the benzazole ring. The sensor only displayed the characteristic emission peak of the ESIPT process at around 450 nm and showed no emission band for the rhodol moiety. However, the spirocycle of this probe opened and the ESIPT process stopped after a reaction with HOCl since there were no free protons in close proximity to benzothiazole; meanwhile, a drastic increase in the fluorescence intensity around 586 nm along with a gradual decrease in the emission peak at 450 nm was observed. As shown in Fig. 72a, the addition of 80 mM HOCl induced a 97-fold variation in the emission ratios of the fluorescence intensities at 586 and 450 nm (I586/I450). More importantly, the fluorescence ratios were linear with regard to the concentration of HOCl, which revealed that the limit of detection of 50 toward HOCl could be calculated to be 0.11 μM. Probe 50 displayed high selectivity toward HOCl over other reactive oxygen species (ROSs), reactive nitrogen species (RNSs) and various biologically relevant analytes (Fig. 72b). For example, the addition of Co2+, Cu2+, Ni2+, Br−, I−, NO2−, NO3−, OH−, S2−, Cys, GHS, Hcy, t-butylhydroperoxide, peroxide tert-butyl ether, H2O2, and NO only caused minimum perturbation in the fluorescence spectra of probe 50 while the addition of HOCl induced a large fluorescence enhancement. The determination of the intracellular location of probe 50 inside cells was conducted by the co-incubation of probe 50 and the commercial lysosomal tracker LysoTracker Green in A549 cells, which suggested that probe 50 could readily permeate the cell membrane and could image HOCl in lysosomes specifically (Fig. 73).
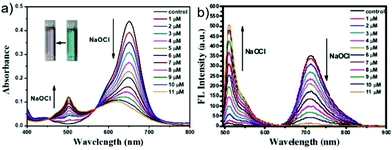
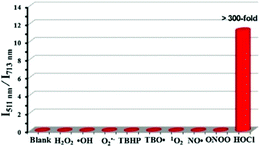
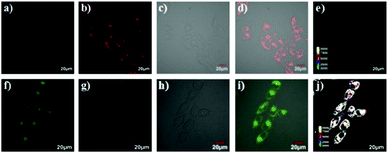
Since some olefinic C![[double bond, length as m-dash]](https://www.rsc.org/images/entities/char_e001.gif) C double bonds are susceptible to oxidative cracking by HOCl under mild conditions, recently, Fan et al. developed a BODIPY-based NIR ratiometric probe 51 that could selectively detect HOCl via oxidative cleavage of olefins (Scheme 38).58 Upon the addition of NaOCl into the solution of probe 51, the absorption intensity displayed a blue-shift from 650 nm to 501 nm, accompanied by a color change from blue to hermosa pink. Meanwhile, the fluorescence intensity at 713 nm decreased while the fluorescence intensity at 511 nm gradually enhanced with increasing NaOCl concentration (Fig. 74). The detection limit of 51 to HOCl was determined to be 10.6 nM. The probe exhibited superior selectivity toward HOCl over other ROS as witnessed by the results that the probe showed more than 300-fold enhancement of the fluorescence ratio (I511nm/I713nm) in the presence of HOCl over other ROS including H2O2, ˙OH, O2˙−, TBHP, TBO˙, 1O2, NO˙ and ONOO− (Fig. 75). The confocal fluorescence images demonstrated that the probe could penetrate through the plasma membrane and visualize exogenous and endogenous HOCl in lysosomes of living cells with low cytotoxicity (Fig. 76).
C double bonds are susceptible to oxidative cracking by HOCl under mild conditions, recently, Fan et al. developed a BODIPY-based NIR ratiometric probe 51 that could selectively detect HOCl via oxidative cleavage of olefins (Scheme 38).58 Upon the addition of NaOCl into the solution of probe 51, the absorption intensity displayed a blue-shift from 650 nm to 501 nm, accompanied by a color change from blue to hermosa pink. Meanwhile, the fluorescence intensity at 713 nm decreased while the fluorescence intensity at 511 nm gradually enhanced with increasing NaOCl concentration (Fig. 74). The detection limit of 51 to HOCl was determined to be 10.6 nM. The probe exhibited superior selectivity toward HOCl over other ROS as witnessed by the results that the probe showed more than 300-fold enhancement of the fluorescence ratio (I511nm/I713nm) in the presence of HOCl over other ROS including H2O2, ˙OH, O2˙−, TBHP, TBO˙, 1O2, NO˙ and ONOO− (Fig. 75). The confocal fluorescence images demonstrated that the probe could penetrate through the plasma membrane and visualize exogenous and endogenous HOCl in lysosomes of living cells with low cytotoxicity (Fig. 76).
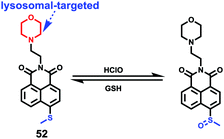
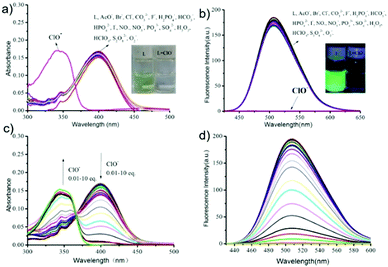
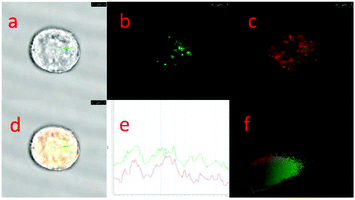
Although a few fluorescence probes for sensing of HOCl have been reported, relatively few fluorescence probes for reversible HClO/GSH redox cycle monitoring have been established. Ye et al. designed and synthesized a two-photon reversible fluorescent probe 52 based on intramolecular charge transfer (ICT) for the selective detection of HOCl (Scheme 39).59 In probe 52, methyl thioether was chosen as an ideal receptor for HOCl since it could be easily oxidized to sulfoxide by HOCl and then the sulfoxide can be reduced to thioether by reductants. As shown in Fig. 77, upon the addition of OCl− into the solution of probe 52, absorption peak at 405 nm simultaneously decreased and a new absorption peak at 350 nm increased. Moreover, an intense fluorescence quenching at 505 nm was observed with the addition of OCl−. The detection limit of probe 52 for the determination of OCl− was estimated to be 0.674 μM based on the fluorescence titration experiments. Due to the selective oxidation of thioether, 52 exhibited higher selectivity to HOCl than other ROS, RNS and anions including H2O2, HClO4, O2−, NO, S2O82−, F−, Cl−, Br−, I−, PO43−, HPO42−, H2PO4−, NO3−, CO32−, HCO3−, AcO−, and SO42−. Interestingly, the addition of GSH into the mixture solution of probe 52 and ClO− induced the restoration of the fluorescence intensity to almost the original level. However, the addition of other reductants, such as Cys, Hcy, H2S, HSO3−, Fe2+, S2O42−, and Vc, could not regenerate the probe's fluorescence. These results suggested that probe 52 could be used to monitor the redox cycles between OCl− and GSH continuously. Furthermore, co-localization experiments by co-staining the 4T1 cell with Lyso Tracker Red DND-99 and probe 52 showed that probe 52 could image OCl− in lysosomes very well (Fig. 78).
4.3 Small-molecule fluorescent probes for the detection of superoxide inside lysosomes
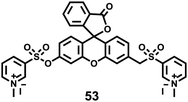
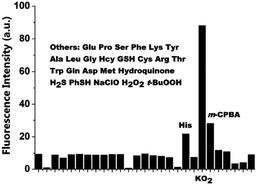
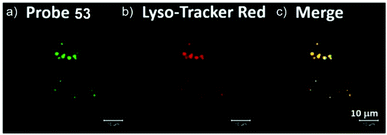
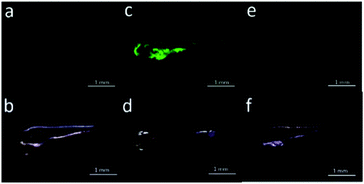
As the product of the one-electron reduction of dioxygen O2, O2˙− is associated with the pathogenesis of many diseases such as cardiovascular diseases, diabetes, cancer and immune system decline.60 Moreover, O2˙− is an important marker for early ROS generation and a parent species of other ROS. Thus, it is crucial to detect superoxide with high selectivity and sensitivity in biological systems.Chen, Dong and Zhao et al. developed a fluorescein-based water-soluble fluorescent probe 53 for detecting superoxide (Scheme 40).61 This probe contained a (N-methylpyridinium-3-yl)sulfonate moiety as a novel superoxide trapper. Probe 53 was fairly stable under neutral and acidic conditions and responded selectively to superoxide with a detection limit of 2.2 μM (Fig. 79). Cell imaging experiments suggested that the probe possessed good cell penetration and could detect O2˙− in the lysosome of PMA-stimulated HepG2 cells (Fig. 80). Moreover, it should be noted that probe 53 could also image O2˙− in the mitochondria of cells due to the presence of the N-methylpyridinium unit, which is a well-known mitochondria-targeted functional group. In addition, this probe was successfully applied to detect O2˙− in living zebrafish embryos under PMA-stimulated conditions (Fig. 81). This study presented the first successful example on the detection of O2˙− both in lysosome and mitochondria in living cells.
4.4 Small-molecule fluorescent probes for the detection of lipid peroxynitrite inside lysosomes
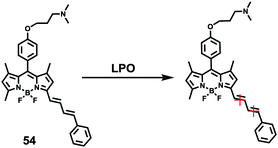
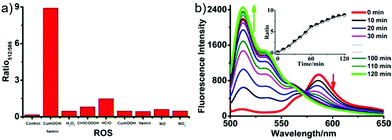
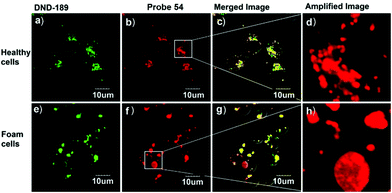
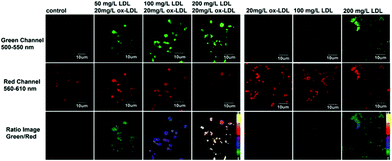
Lipid peroxidation (LPO) in lysosomes is closely related to the pathogenesis of many diseases.62 For example, in the initial stage of atherosclerosis, lysosomes swell by accumulating a lot of lipoproteins, which promotes the free-radical chain propagation of LPO. Although several fluorescent LPO probes have been previously reported,63 they were unable to detect LPO in lysosomes owing to their unspecific intracellular localizations. Therefore, precise and quantitative assessment of dynamic LPO levels in lysosomes is of great interest for the early diagnosis of atherosclerosis and related pathological or pharmacological studies.Xiao et al. developed a lysosome targetable fluorescent probe 54 for LPO (Scheme 41).64 This probe had a basic tertiary amino unit to target acidic lysosomes and a diene group to respond to LPO. Because of the extended conjugation with the diene and phenyl moieties, this BODIPY probe displayed bright red fluorescence with an emission maximum at 586 nm. As expected, probe 54 demonstrated a sensitive and selective response to the LPO (Fig. 82). In the presence of hemin and cumene hydroperoxide (CumOOH), which is a similar situation as lipid peroxidation in living cells, a continuous increase in fluorescence intensity at 512 nm and a decrease at 586 nm was observed until equilibrium was reached as time went on. The hypsochromic shift of the emission of the probe was attributed to the cleavage of the π-structure. Cell imaging experiments showed that 54 was able to dynamically visualize morphological changes of lysosomes during the evolution of foam cells as well as to relatively quantify local LPO in a single lysosome through ratiometric imaging (Fig. 83). More importantly, 54 provided a new opportunity to distinguish and clarify the different roles played by low-density lipoprotein (LDL) and its oxidized form (ox-LDL) for the LPO processes of foam cells, which was beneficial for understanding the initiation and control factors of atherosclerosis (Fig. 84).
5. Small-molecule fluorescent probes for the detection of reactive sulfur species (RSS) inside lysosomes
Active sulfur species (RSS) include H2S, SO2, cysteine (Cys), homocysteine (Hcy), glutathione (GSH) and so on. RSS play important roles in physiological and pathological processes, such as regulating oxidative stress and controlling signal transduction.65 Therefore, the establishment of convenient detection methods for RSS is on demand.5.1 Small-molecule fluorescent probes for the detection of hydrogen sulfide inside lysosomes
Hydrogen sulfide (H2S), which is produced endogenously in mammalian systems from L-cysteine in reactions catalysed mainly by two pyridoxal-50-phosphate-dependent enzymes, cystathionine β-synthase (CBS) and cystathionine γ-lyase (CSE), has been considered the third most important gasotransmitter for regulating cardiovascular, neuronal, immune, endocrine, and gastrointestinal systems. The endogenous level of H2S has been found to be related to some diseases such as Alzheimer's disease, Down's syndrome, diabetes, and liver cirrhosis.66 Recently, research revealed that H2S also functioned in lysosome organelles, and it could induce cell death in association with the activation of calpain proteases and lysosomal destabilization along with the release of lysosomal proteases.67 For example, H2S induced lysosomal membrane destabilization leads to an autophagic event of precipitation apoptosis coupled with calpain activation, thus ensuring cellular demise. Therefore, detecting and imaging lysosomal H2S is meaningful and provides a potential powerful tool for probing the relationship between H2S and disease states.Xu, Spring and Cui et al. developed a lysosome-targetable fluorescent probe 55 based on naphthalimide for imaging H2S in living cells (Scheme 42).68 In probe 55, the dinitrophenyl ether group was introduced into the 4-position of 1,8-naphthalimide acting as the H2S reactive site, and 4-(2-aminoethyl)morpholine was introduced as the lysosome-targetable group. The fluorescence at 555 nm of 55 remained unaffected at pH 8.2–4.2 and then gradually increased from pH 4.2 to 2.03 which indicated that probe 55 could be used in lysosomes. Probe 55 displayed high sensitivity and selectivity to H2S in aqueous solution (Fig. 85). The addition of H2S into the solution of 55 induced a 42-fold enhancement of the emission band centered at 555 nm due to the thiolysis of the dinitrophenyl ether by H2S. However, the addition of 100 equiv. of Na+, Ca2+, K+, Mg2+, HCO3−, F−, Cl−, Br−, I−, NO3−, S2O32−, S2O42−, S2O52−, SO3−, N3−, CO32−, CH3COO−, OH−, SO42−, H2O2, HSO4−, homocysteine, and ascorbic acid produced a nominal change in the fluorescence spectra of 55. The detection limit of H2S with probe 55 was calculated to be 0.48 μM. The fluorescence localization experiments indicated that the probe was applicable to H2S detection in live cell imaging and had the ability to detect intracellular H2S in lysosomes. As shown in Fig. 86, the fluorescence patterns of 55 and the commercially available lysosome-specific dye Neutral Red (NR) signals overlapped perfectly, indicating that the fluorescence response of 55 to H2S was localized at the lysosome.
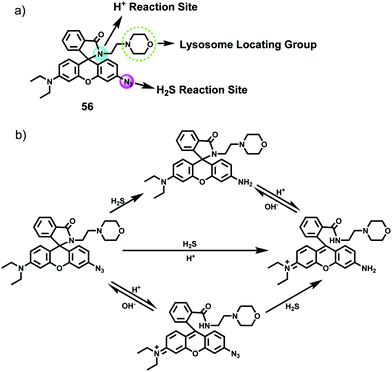
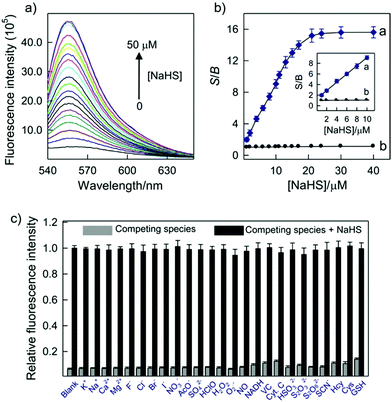
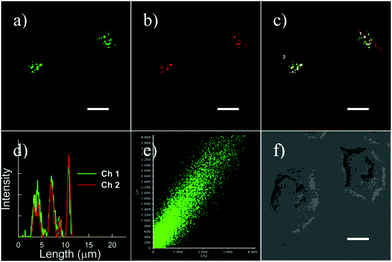
Yang et al. developed a simultaneous H2S and proton-activatable probe 56 for selective recognition of H2S in a lysosomal pH environment by utilizing the spironolactam moiety of 56 to bind hydrogen protons and an azide group to react with H2S (Scheme 43).69 Probe 56 displayed highly sensitive and selective fluorescence response to H2S in a lysosomal pH environment. As shown in Fig. 87, the addition of NaHS to the aqueous solution of 56 at pH 4.5 elicited a dramatic enhancement of the emission spectra and the detection limit was calculated to be 0.5 μM. However, the addition of other potentially competing species did not induce observable fluorescence enhancement. Cell imaging experiments showed that 56 was membrane permeable and enabled visualization of exogenous and endogenous H2S in lysosomes of living cells (Fig. 88 and 89). It should be noted that this simultaneous target and location-activatable approach showed in this study would ensure that fluorescence can only be lighted up by the analyte present in a specific location, which provides advantages of elimination of false signals and improvement of spatial resolution and sensitivity.
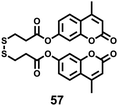
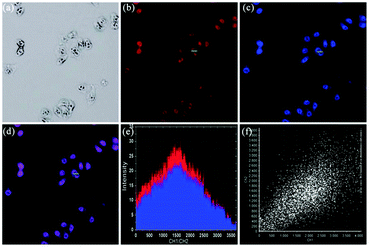
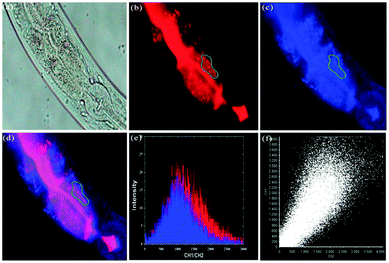
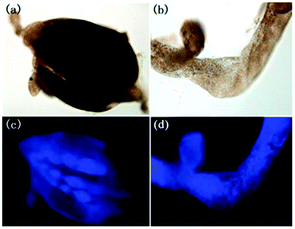
Zhou and Zhang et al. synthesized a H2S fluorescent probe 57 based on a coumarin derivative containing disulfide bonds (Scheme 44).70 The probe chose a special selective reaction instead of a lysosomal targeting group as a lysosomal-targeted tool to track lysosomal location and disruption in cells. Probe 57 exhibited excellent selectivity towards H2S with a detection limit of 7.9 × 10⁻⁷ M. Colocalization imaging experiments indicated that probe 57 could be applied to monitor endogenous and exogenous H2S in HeLa cells (Fig. 90), C. elegans (Fig. 91), and D. melanogaster (Fig. 92). This work provided the first example on the disulfide bond-containing coumarin derivative to trace the accumulation of lysosomes in D. melanogaster and endogenous lysosomal injury in mutated C. elegans (SRP-6nulls) with a high resolution.
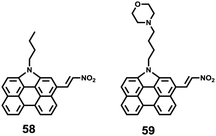
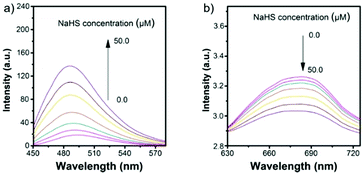
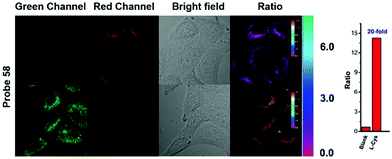
Hua et al. designed and synthesized a series of N-annulated perylene-based colorimetric and ratiometric NIR fluorescent probes 58 and 59 for the sensitive and selective detection of H2S (Scheme 45).71 In the absence of H2S, probe 58 and its lysosomal targetable derivative 59 showed near-infrared fluorescence at 681 nm due to the strong electron-withdrawing ability of the nitro group. With the addition of only a small amount of H2S in a few minutes, the dramatic decrease of the NIR fluorescence accompanied by the sharp increase of a new fluorescence peak at 481 nm was observed (Fig. 93). The probe possessed high selectivity to H2S and the detection limit was determined to be 139 nM. Probe 59 was successfully employed to quantify endogenous H2S in lysosomes of live cells (Fig. 94) and in fetal bovine serum.
5.2 Small-molecule fluorescent probes for the detection of sulfur dioxide inside lysosomes
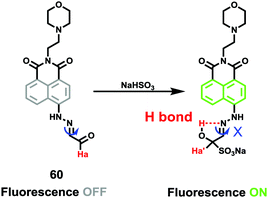
Sulfur dioxide (SO2) is one of the harmful atmospheric pollutants and exists in the forms of sulfite (SO32−) and bisulfite (HSO3−) in organisms. As a gaseous signalling molecule, SO2 can modulate a wide range of physiological processes, such as anti-atherosclerosis, regulating cardiovascular structure and function, and increasing antioxidant capacity.72 Excessive intake of sulfur dioxide or its derivatives may bring about respiratory diseases, neurological diseases, vascular diseases and even lung cancer. However, the lack of methods for detecting SO2 in lysosomes has brought obstacles to the research of related physiological processes and pathological mechanisms. Therefore, the development of methods for detecting SO2 and its derivatives in lysosomes is of great significance.Lin et al. developed a lysosomal-targeted two-photon fluorescent probe 60 for the detection of SO2 derivatives (Scheme 46).73 Probe 60 was designed based on a unique C![[double bond, length as m-dash]](https://www.rsc.org/images/entities/char_e001.gif) N isomerization mechanism, in which bisulfite reacted with aldehydes and formed intramolecular hydrogen bonds to inhibit C
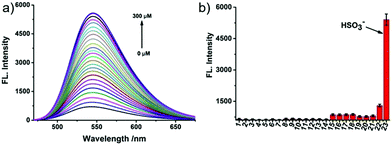
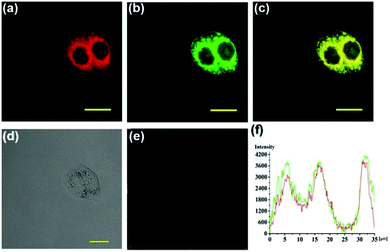
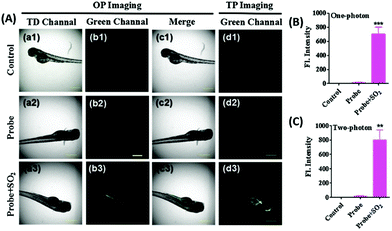
N isomerization mechanism, in which bisulfite reacted with aldehydes and formed intramolecular hydrogen bonds to inhibit C![[double bond, length as m-dash]](https://www.rsc.org/images/entities/char_e001.gif) N isomerization. Probe 60 possessed remarkable selectivity and sensitivity since it was only responsive to HSO3−. As shown in Fig. 95, the addition of NaHSO3 into the solution of probe 60 triggered a dramatic increase in the fluorescence intensity. However, almost no marked fluorescence enhancement was observed by treating probe 60 with Ca2+,Co2+, Cu2+, Fe3+, Fe2+, I−, Mg2+, Cl−, SO32−, NO3−, F−, NO2−, Sn2+, Zn2+, TBHP, DTBP, H2O2, ClO−, Hcy, GSH, Cys, and NaHS. Importantly, fluorescence co-localization studies showed that 60 could be effectively used to image of SO2 in lysosomes of living cells (Fig. 96) for the first time and to detect SO2 derivatives in living zebrafish (Fig. 97).
N isomerization. Probe 60 possessed remarkable selectivity and sensitivity since it was only responsive to HSO3−. As shown in Fig. 95, the addition of NaHSO3 into the solution of probe 60 triggered a dramatic increase in the fluorescence intensity. However, almost no marked fluorescence enhancement was observed by treating probe 60 with Ca2+,Co2+, Cu2+, Fe3+, Fe2+, I−, Mg2+, Cl−, SO32−, NO3−, F−, NO2−, Sn2+, Zn2+, TBHP, DTBP, H2O2, ClO−, Hcy, GSH, Cys, and NaHS. Importantly, fluorescence co-localization studies showed that 60 could be effectively used to image of SO2 in lysosomes of living cells (Fig. 96) for the first time and to detect SO2 derivatives in living zebrafish (Fig. 97).
5.3 Small-molecule fluorescent probes for the detection of thiols inside lysosomes
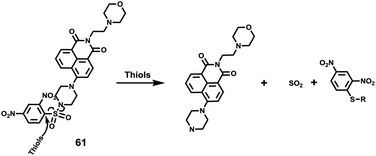
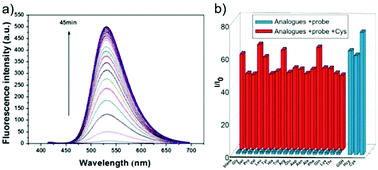
Low molecular weight biothiols, such as cysteine (Cys), homocysteine (Hcy) and glutathione (GSH), are important components of many peptides that play key roles in many physiological processes, including cellular growth, redox hemeostasis, and signal transduction.74 Once the levels of biothiols are abnormal, they will lead to many serious diseases. For example, low level of Cys can cause symptoms such as liver damage, edema, skin lesions, slow growth in children, and discoloration of hair.75 More importantly, many reports have been indicated that cystine-containing proteins have their disulphide bonds reduced during proteolysis in lysosomes.75b High level of Hcy is closely related to neural tube defects, cardiovascular diseases, and Alzheimer's disease.76 Abnormal level of GSH, the most abundant intracellular non-protein thiol, is directly related to aging, heart disease, and cancer.77 Furthermore, thiols were closely associated with proteolysis in the lysosome which reduced disulphide bonds.77b Therefore, the development of methods for detecting levels of thiols in living cells and tissues is of great significance, providing more basic information for further exploration of the pathogenesis of related diseases.Fan et al. developed a two-photon fluorescent probe 61 based on 1,8-naphthalimide, in which morpholine acted as a lysosomal directing group and piperazine acted as a linker to introduce 2,4-dinitrobenzenesulfonyl (DNBS) into the 4-position of naphthalimide (Scheme 47).78 The fluorescence was essentially quenched due to the photo-induced electron transfer (PET) between DNBS and naphthalimide. Once the thiol reacted with DNBS, the PET process was inhibited bringing about a dramatic increase in fluorescence emission at 540 nm. This probe possessed superior selectivity to Cys, GSH and Hcy compared to other amino acids (Fig. 98). More importantly, the probe was successfully applied to imaging of thiols in lysosomes of living cells and tissues (Fig. 99).
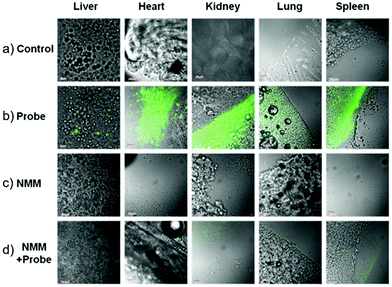
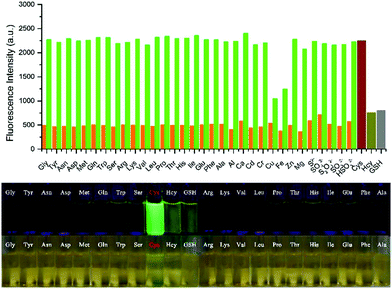
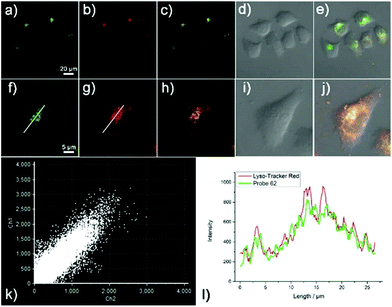
Liu et al. designed and synthesized a coumarin-based fluorescent probe 62 for the detection of cysteine (Cys) in lysosomes (Scheme 48).79 A fast conjugate addition–cyclization reaction between 62 and Cys was achieved for detection of Cys in the micromolar range in aqueous buffer. Probe 62 possessed remarkably higher selectivity for Cys over cysteine (Hcy), glutathione (GSH) and various other natural amino acids under physiological conditions (Fig. 100). The probe was nearly non-fluorescent under excitation at 445 nm due to the influence of the PET effect resulting from the acryloyl group. After the addition of Cys, a significant increase in fluorescence emission at 520 nm was observed. The detection limit of 62 for Cys was calculated to be 0.411 μM. Two-photon fluorescence experiments and co-localization experiments demonstrated the good biocompatibility and the ability to target lysosomes of 62 (Fig. 101). In addition, this probe was then successfully applied to fluorescence imaging of Cys in HeLa cells and mice tissues, indicating that 62 has the potential to detect Cys in living cells and tissues.
6. Small-molecule fluorescent probes for the detection of reactive nitrogen species (RNS) inside lysosomes
Reactive nitrogen species (RNS), including nitric oxide (NO), peroxynitrite (ONOO−), and nitric acid (HNO), play important roles in physiological and pathological processes.80 Abnormal level of RNS may lead to severe diseases such as inflammation, neurodegenerative diseases, cardiovascular diseases and cancer. Therefore, there is an urgent demand to develop a suitable method for in vivo detection of RNS to elucidate their roles in physiological and pathological processes further.6.1 Small-molecule fluorescent probes for the detection of nitric oxide inside lysosomes
Nitric oxide (NO), a cellular messenger molecule prevalent in the cardiovascular, nervous, and immune systems, is involved in a variety of physiological processes, including inflammation, blood pressure regulation, neurotransmission, and immune regulation.81 Abnormal levels of intracellular NO may result in a variety of diseases such as Gaucher's disease, Danon and lysosomal storage disorders. It has been reported that NO could react with several related proteins outside lysosomes to drive the autolysosome process.82 However, on account of the reaction characteristics and high diffusion of NO, the effects of NO on lysosomes are not yet fully understood. Therefore, it is essential to develop effective means for monitoring the level of NO in lysosomes of living cells to further explore the pathological mechanisms of related diseases.Xiao and Jin et al. designed and synthesized a naphthalimide-based lysosomal-targeted two-photon fluorescent probe 63 (Scheme 49).83 Probe 63 showed higher selectivity and sensitivity for NO over other ROS/RNS and the limit of detection was determined to be 5 nM. As shown in Fig. 102, the addition of NO caused a remarkable enhancement of the emission spectrum of 63 at 530 nm, and a significant increase of the fluorescence quantum yield from 0.02 to 0.3. However, the addition of various reactive oxygen and reactive nitrogen species, such as H2O2, NO2−, NO3−, 1O2, ˙OH, and ONOO−, didn’t induce an observable spectral change. Compared to commercial lysosomal probes, 63 possessed lower cytotoxicity and perfect lysosomal localization. Co-localization experiments showed that 63 was a lysosome-specific probe for NO and the byproduct of NO in lysosomes did not interfere with its photo-properties (Fig. 103). Probe 63 could monitor the releasing process of NO from NOC13 in lysosomes of MCF-7 cells (Fig. 104). More importantly, due to the high selectivity and sensitivity of 63, the first capture of NO within lysosomes of macrophage cells has been achieved using both two-photon fluorescence microscopy and flow cytometry.
6.2 Small-molecule fluorescent probes for the detection of peroxynitrite inside lysosomes
Peroxynitrite (ONOO−) is the reaction product of nitric oxide (NO) and superoxide (O2˙−) under diffusion control without enzymatic catalysis. As a strong oxidant and nitrating agent, it plays a vital role in many physiological and pathological processes.84 Besides, ONOO− is associated with many diseases such as neurodegenerative diseases, nitrification stress, cardiovascular diseases, inflammatory disorders and cancer. Lysosomes were attractive pharmacological targets for selective killing of cancer cells via the lysosomal cell death pathway that was closely associated with reactive oxygen species (ROS).84c Therefore, it is necessary to achieve rapid detection of ONOO− in living cell lysosomes due to its remarkably short half-life (<20 ms) under physiological conditions.Yang and Zhang et al. successfully developed a versatile fluorescent probe 64 based on naphthalimide-hemicyanine, which was specifically localized in lysosomes for the detection of peroxynitrite (ONOO−) (Scheme 50).85 When excited at 440 nm, the fluorescence of 64 at 510 nm increased by about 3.5-fold with the increase of ONOO−. Probe 64 was more selective for ONOO− than other ROS and RNS due to the selective cleavage of the double bond between the naphthalimide moiety and the indolium ring by peroxynitrite (Fig. 105). Cell imaging experiments showed that 64 possessed low cytotoxicity and good cell permeability, which was successfully applied to detect peroxynitrite in lysosomes of living cells (Fig. 106).
6.3 Small-molecule fluorescent probes for the detection of nitroxyl inside lysosomes
Nitroxyl (HNO) is one of the least studied RNS. HNO is reported to display unique potential bio-pharmacological effects.86 On the one hand, HNO can act as an electrophile to resist superoxide infraction in mammalian vascular systems. On the other hand, it can also function as a nucleophile to coordinate and reduce metal ions. More importantly, numerous research studies indicate that HNO is beneficial for heart failure cure. Although it has been reported that HNO can be formed directly from NO and H2S by a redox reaction, rapid dimerization and dehydration to nitrous oxide (N2O) resulting from high chemical reactivity of HNO in biological systems always impede the accurate detection of HNO in cells and in vivo. Therefore, the development of suitable methods for the detection of HNO in cells and in vivo remains a challenging task.Chen et al. presented a NIR fluorescent probe 65 for the detection of nitroxyl groups (HNO) in cells and in vivo (Scheme 51).87 In probe 65, the diphenylphosphinobenzoyl group was used as the HNO recognition unit since it could react with HNO to form aza-ylide, which will nucleophilically attack the carbonyl of the ester, thereby releasing Lyso-1. 65 exhibited good sensitivity with a detection limit of 60 nM and excellent selectivity in the presence of various biologically relevant species (Fig. 107 and 108). Colocalization experiments demonstrated that 65 could be lysosome targetable and suitable for the detection of HNO in living cells. More importantly, fluorescence/X-ray imaging studies showed that 65 achieved noninvasive visualization of HNO in living mice (Fig. 109).
7. Small-molecule fluorescent probes for the detection of metal ions inside lysosomes
7.1 Small-molecule fluorescent probes for the detection of Zn2+ inside lysosomes
A zinc ion (Zn2+) is not only an essential element that plays a key role in various basic biological processes, but also a cofactor for structuring and functioning of different proteins expressed in the cytoplasm.88 Although lysosomes contain Zn2+, the homeostasis of zinc in lysosomes is still not well established. Therefore, in order to obtain high-precision information from complex lysosomes, molecular fluorescence imaging is a promising method on account of its high sensitivity and high spatial resolution and real-time monitoring capability.Jiang et al. designed and synthesized a lysosomal-targeted ratiometric fluorescent probe 66, composed of a quinoline scaffold as the ratiometric signaling unit for Zn2+ (Scheme 52).89 In acidic aqueous solution (pH = 5.2), 66 displayed a fluorescence emission maximum at 542 nm. The titration of Zn2+ into the solution of probe 66 resulted in quenching of emission around 543–700 nm and a new blue-shifted emission peak at 495 nm with a hypsochromic shift of 47 nm (Fig. 110a). 66 possessed higher selectivity toward Zn2+ over other metal ions and good sensitivity with a detection limit of 16 nM (Fig. 110b). Probe 66 showed low cytotoxicity and good cell permeability. Confocal imaging experiments indicated that 66 was able to localize to lysosomes and could be applied to ratiometric detection of lysosomal Zn2+ changes in the presence of exogenous or endogenous Zn2+ (Fig. 111).
Cho and Ahn et al. developed a novel two-photon fluorescent probe 67 for selective detection of Zn2+ in lysosomes over those in the cytosol (Scheme 53).90 The probe was a naphthalimide-based dye consisting of an N,N-di-(2-picolyl)ethylenediamine (DPEN) ligand, which was known to bind Zn(II). The probe emitted negligible fluorescence at various pH values. Upon addition of Zn2+, the probe emitted strong fluorescence in the lysosomal pH range (pH = 4.5–5.5) due to the inhibition of PET processes from the coordination of Zn2+ with DPEN and the protonated morpholine unit. It should be noted that, being different from some reported lysosomal Zn(II) probes that show strong fluorescence after binding with Zn(II) even at the cytosolic pH (pH = 7.2–7.4), probe 67 displayed a low fluorescence intensity at cytosolic pH (7.4) even after binding with Zn(II) ions. Strong fluorescence could only be observed when probe 67 bound with Zn(II) ions inside lysosomes (pH 4.5–5.5). The probe exhibited high selectivity to Zn2+ over other metal ions and high sensitivity with a detection limit of 0.18 μM (Fig. 112). Co-localization experiments indicated that probe 67 was capable of detecting intracellular lysosomal Zn(II) ions with high fidelity (Fig. 113). Moreover, two-photon microscopic imaging experiments demonstrated that probe 67 had potential applicability in the imaging of endogenous Zn(II) ions in tissues.
7.2 Small-molecule fluorescent probes for the detection of Cu2+ inside lysosomes
Copper, as the indispensable trace element, plays an important role in various physiological processes, such as pigmentation, cellular respiration, neurotransmitter synthesis and metabolism, iron homeostasis, connective tissue formation, and peptide biogenesis.91 Most of the copper in the cytoplasm binds to metallothionein, but excess copper is mainly excreted into the bile through the lysosome-to-bile pathway. The disorder of copper homeostasis in cells is closely associated with many serious diseases, including Alzheimer's disease, Menkes disease, Wilson's disease and familial amyotrophic lateral sclerosis. Copper usually accumulates in lysosomes of patients with later stage Wilson's disease. In addition, human copper transporter 2 (hCTR2) localizes in lysosomes and promotes cellular uptake of Cu2+. Therefore, it is highly desirable to develop a reliable method for detecting Cu2+ in lysosomes.Lin et al. developed the fluorescence-enhanced and lysosomal-targeted Cu2+ probe 68 with unique dual-channel emission (Scheme 54).92 With excitation at 360 nm, 68 displayed a weak fluorescence emission band at around 440 nm on account of a quenching photoinduced electron-transfer (PET) process from the amino group to the 1,8-naphthalimide fluorophore and rhodamine B in the ring-closed form. Upon addition of Cu2+, not only was the fluorescence at 440 nm dramatically enhanced due to the inhibition of the quenched PET channel, but also a significant fluorescence enhancement was observed at about 580 nm owing to the triggering of rhodamine B ring-opened form formation. 68 possessed a fast response and high selectivity to Cu2+. For example, as shown in Fig. 114, the addition of K+, Mg2+, Na+, Ni2+, Pd2+, Zn2+, Ag+, Ca2+, Cu+, Fe2+, Co2+, H2O2, and NO into the solution of probe 68 caused a negligible fluorescence enhancement of probe 68. However, a significant fluorescence enhancement was observed upon the addition of Cu2+ to probe 68. Co-localization experiments indicated that 68 was membrane-permeable and suitable for visualization of Cu2+ in lysosomes of living cells by dual-channel imaging (Fig. 115).
8. Small-molecule fluorescent probes for the detection of enzymes inside lysosomes
8.1 Small-molecule fluorescent probes for the detection of nitroreductase inside lysosomes
Nitroreductase (NTR) is one of the enzymes containing flavin. Nitroaromatic derivatives can be reduced to the corresponding amines by NTR with electrons donated from nicotinamide adenine dinucleotide (NADH).93 At present, the function and distribution of NTR in lysosomes are poorly understood. Therefore, it is essential to establish a suitable method to detect the change and distribution of NTR in lysosomes.Ma et al. developed a new naphthalimide-based fluorescent probe 69 for the detection of NTR in lysosomes (Scheme 55).94 The detection mechanism of 69 for NTR was based on the nitroreductase-catalyzed reduction of the probe to 4-amino-1,8-naphthalimide. Before reacting with NTR, 69 was nearly non-fluorescent due to the strong fluorescence quenching of the nitro group. However, the introduction of NTR into the solution of probe 69 gave rise to a large fluorescence enhancement. 69 exhibited superior selectivity to NTR compared to other biologically relevant species (Fig. 116). 69 also possessed high sensitivity with a detection limit of 2.2 ng mL−1. Co-localization experiments demonstrated that 69 was capable of specifically targeting the lysosomes of living cells with good cell-membrane permeability and could detect lysosomal NTR (Fig. 117).
8.2 Small-molecule fluorescent probes for the detection of β-galactosidase inside lysosomes
β-Galactosidase (β-gal) is a glycosidehydrolase enzyme which is encoded by the lacZ gene. β-gal can catalyze the hydrolysis of β-galactosides into monosaccharides through the breaking of a glycosidic bond. It is a vital reporter biomarker for primary ovarian cancers and cell senescence.95 In addition, cells can generate acid lysosomal β-galactosidase localized in lysosomes. However, fluorescent probes for monitoring endogenous β-gal in ovarian tumor cells especially in lysosomes were rarely reported.Gu and Wang et al. designed and synthesized a lysosome-targeted two-photon fluorescent probe 70 for detecting β-galactosidase in living ovarian cancer cells (Scheme 56).96 Probe 70 consisted of a 1,8-naphthalimide fluorophore as the fluorescence reporter, a morpholine ring as the lysosome-targeted group, and a β-gal cleavable unit as the enzyme-active trigger, respectively. Probe 70 exhibited remarkable response to β-gal in vitro with a distinct fluorescence change from blue to green. As shown in Fig. 118, in the absence of β-gal, probe 70 exhibited weak fluorescence under the excitation at 460 nm because of its weak ICT. However, after the addition of β-gal, drastically increased fluorescence intensity at 560 nm was observed since the glucosidic bond of the probe could be hydrolyzed by β-gal and transformed into the phenolate group. Probe 70 possessed high sensitivity to β-gal with the detection limit of 4 × 10⁻⁵ U mL−1. Furthermore, co-localization experiments indicated that probe 70 could be located in lysosomes specifically, imaging endogenous β-gal in living cells as well as monitoring endogenous β-galactosidase in living ovarian cancer cells using two-photon fluorescence microscopy (Fig. 119).
9. Conclusions
Over the past few years, we have focused our research interest on the design and preparation of novel fluorescent probes97 and construction of supramolecular fluorescent functional materials via self-assembly.98 In this feature article, the recent development of small-molecule fluorescent probes for the selective detection of chemical species inside lysosomes has been systematically summarized. This feature article focuses on the design principle, the recognition mechanism, the properties, and the applications of various kinds of small-molecule fluorescent probes for the detection of pH, reactive oxygen species (ROS), reactive sulfur species (RSS), reactive nitrogen species (RNS), metal ions, and enzymes in lysosomes. Considering their wide applications in chemistry, biology, and medical science, there is no doubt that these kinds of fluorescent probes for detecting chemical species inside lysosomes will attract more attention in the next few decades.Although a great number of achievements have been made in this research field, many problems are still far from being fully resolved. For example, despite there are general methods, such as the incorporation of weakly alkaline groups and the introduction of rhodamine group, to deliver small-molecule probes to cellular lysosomes, the challenge of developing a selective lysosomal fluorescent probe is still a hard work since the lysosome and cellular environment are highly complex. Moreover, these fluorescent probes still didn’t clearly elucidate the relationship between the diseases and the chemical species in lysosomes. In our opinion, three aspects should be considered in further development of small-molecule fluorescent probes for the detection of chemical species inside lysosome. First, in order to develop and expand their biological applications, biocompatible and water-soluble fluorescent probes need to be designed and prepared. Second, near-infrared fluorescent probes for the detection of chemical species inside lysosomes should be constructed. Third, more attention should be paid to the preparation of lysosomal-targeted fluorescent probes for the diagnosis and treatment of related diseases caused by chemical species in lysosomes.
Conflicts of interest
There are no conflicts to declare.Acknowledgements
Thanks to all excellent authors whose names appear in the references. We acknowledge the financial support of the National Natural Science Foundation of China (No. 21871092 and 21672070), Shanghai Pujiang Program (18PJD015), and the State Key Laboratory of Fine Chemicals (KF 1801).References
- (a) P. Saftig and A. Haas, Nat. Cell Biol., 2016, 18, 1025 CrossRef CAS PubMed; (b) R. E. Lawrence and R. Zoncu, Nat. Cell Biol., 2018, 21, 133 CrossRef PubMed.
- (a) A. Ciechanover, Cell Death Differ., 2005, 12, 1178 CrossRef CAS PubMed; (b) M. P. Jackson and E. W. Hewitt, Essays Biochem., 2016, 60, 173 CrossRef PubMed.
- (a) D. W. Lamming and L. Bar-Peled, Traffic, 2019, 20, 27 CrossRef CAS PubMed; (b) A. M. Thelen and R. Zoncu, Trends Cell Biol., 2017, 27, 833 CrossRef CAS PubMed; (c) C.-Y. Lim and R. Zoncu, J. Cell Biol., 2016, 214, 653 CrossRef CAS.
- (a) H. Appelqvist, P. Wäster, K. Kågedal and K. Öllinger, J. Mol. Cell Biol., 2013, 5, 214 CrossRef CAS PubMed; (b) R.-M. N. Boustany, Nat. Rev. Neurol., 2013, 9, 583 CrossRef CAS PubMed; (c) R. A. Nixon, Nat. Med., 2013, 19, 983 CrossRef CAS PubMed.
- (a) C. Yang and X. Wang, Traffic, 2017, 18, 348 CrossRef CAS; (b) B. Carroll and E. A. Dunlop, Biochem. J., 2017, 474, 1453 CrossRef CAS PubMed; (c) S. M. Davidson and M. G. V. Heiden, Annu. Rev. Pharmacol., 2017, 57, 481 CrossRef CAS PubMed; (d) C. E. Blaby-Haas and S. S. Merchant, J. Biol. Chem., 2014, 289, 28129 CrossRef CAS PubMed.
- D. Dahal, L. McDonald, X. Bi, C. Abeywickrama, F. Gombedza, M. Konopka, S. Paruchuri and Y. Pang, Chem. Commun., 2017, 53, 3697 RSC.
- (a) G. Li, S. Ma, J. Tang and Y. Ye, New J. Chem., 2019, 43, 1267 RSC; (b) H. Zhang, L. Xu, W. Chen, J. Huang, C. Huang, J. Sheng and X. Song, ACS Sens., 2018, 3, 2513 CrossRef CAS PubMed.
- J. Liu, S. Zhou, J. Ren, C. Wu and Y. Zhao, Analyst, 2017, 142, 4522 RSC.
- Y. Hong, H. Wang, M. Xue, P. Zhang, W. Liu, S. Chen, R. Zeng, J. Cui, Y. Gao and J. Chen, Mater. Chem. Front., 2019, 3, 203 RSC.
- H. Duan, Y. Ding, C. Huang, W. Zhu, R. Wang and Y. Xu, Chin. Chem. Lett., 2019, 30, 55 CrossRef CAS.
- Y. Li, Y. Zhao, W. Chan, Y. Wang, Q. You, C. Liu, J. Zheng, J. Li, S. Yang and R. Yang, Anal. Chem., 2015, 87, 584 CrossRef CAS PubMed.
- (a) B. Daly, J. Ling and A. P. de Silva, Chem. Soc. Rev., 2015, 44, 4203 RSC; (b) H. S. Jung, P. Verwilst, W. Y. Kim and J. S. Kim, Chem. Soc. Rev., 2016, 45, 1242 RSC; (c) H.-W. Liu, L. Chen, C. Xu, Z. Li, H. Zhang, X.-B. Zhang and W. Tan, Chem. Soc. Rev., 2018, 47, 7140 RSC; (d) J. Zhu, P. Jia, N. Li, S. Tan, J. Huang and L. Xu, Chin. Chem. Lett., 2018, 29, 1445 CrossRef CAS; (e) X. Qian and Z. Xu, Chem. Soc. Rev., 2015, 44, 4487 RSC; (f) A. T. Aron, K. M. Ramos-Torres, J. A. Cotruvo Jr. and C. J. Chang, Acc. Chem. Res., 2015, 48, 2434 CrossRef CAS PubMed; (g) H. Zhu, J. Fan, J. Du and X. Peng, Acc. Chem. Res., 2016, 49, 2115 CrossRef CAS PubMed; (h) L.-Y. Niu, Y.-Z. Chen, H.-R. Zheng, L.-Z. Wu, C.-H. Tung and Q.-Z. Yang, Chem. Soc. Rev., 2015, 44, 6143 RSC; (i) M. Kaur and D. H. Choi, Chem. Soc. Rev., 2015, 44, 58 RSC; (j) S. T. Manjare, Y. Kim and D. G. Churchill, Acc. Chem. Res., 2014, 47, 2985 CrossRef CAS PubMed; (k) K. P. Carter, A. M. Young and A. E. Palmer, Chem. Rev., 2014, 114, 4564 CrossRef CAS PubMed; (l) H. Xu, Q. Li, L. Wang, Y. He, J. Shi, B. Tang and C. Fan, Chem. Soc. Rev., 2014, 43, 2650 RSC; (m) L. Pu, Acc. Chem. Res., 2012, 45, 150 CrossRef CAS PubMed; (n) H. N. Kim, Z. Guo, W. Zhu, J. Yoon and H. Tian, Chem. Soc. Rev., 2011, 40, 79 RSC; (o) E. M. Nolan and S. J. Lippard, Acc. Chem. Res., 2009, 42, 193 CrossRef CAS PubMed; (p) X. Chen, G. Zhou, X. Peng and J. Yoon, Chem. Soc. Rev., 2012, 41, 4610 RSC; (q) Y. V. Suseela, N. Narayanaswamy, S. Pratihar and T. Govindaraju, Chem. Soc. Rev., 2018, 47, 1098 RSC; (r) P. Ning, W. Wang, M. Chen, Y. Feng and X. Meng, Chin. Chem. Lett., 2017, 28, 1943 CrossRef CAS; (s) D. Su, C. L. Teoh, L. Wang, X. Liu and Y.-T. Chang, Chem. Soc. Rev., 2017, 46, 4833 RSC; (t) Y. Xia, R. Zhang, Z. Wang, J. Tian and X. Chen, Chem. Soc. Rev., 2017, 46, 2824 RSC; (u) M. Gao, F. Yu, C. Lv, J. Choo and L. Chen, Chem. Soc. Rev., 2017, 46, 2237 RSC; (v) A. Kaur, J. L. Kolanowski and E. J. New, Angew. Chem., Int. Ed., 2016, 55, 1602 CrossRef CAS PubMed; (w) Z. Lou, P. Li and K. Han, Acc. Chem. Res., 2015, 48, 1358 CrossRef CAS PubMed; (x) Y. Ding, Y. Tang, W. Zhu and Y. Xie, Chem. Soc. Rev., 2015, 44, 1101 RSC.
- (a) H.-Y. Tan, Y.-T. Qiu, H. Sun, J.-W. Yan and L. Zhang, Chem. Commun., 2019, 55, 2688 RSC; (b) P. Sharma, N. Gupta, S. Kaur, S. Kaur, P. Ohri, R. D. Parihar, V. Bhalla and M. Kumar, Sens. Actuators, B, 2019, 286, 451 CrossRef CAS; (c) P. Ning, L. Hou, Y. Feng, G. Xu, Y. Bai, H. Yu and X. Meng, Chem. Commun., 2019, 55, 1782 RSC; (d) S.-H. Park, J. Young and I. Shin, Chem. Sci., 2019, 10, 56 RSC; (e) X.-J. Chao, Z.-Y. Pan, L.-L. Sun, M. Tang, K.-N. Wang and Z.-W. Mao, Sens. Actuators, B, 2019, 285, 156 CrossRef CAS; (f) S.-L. Shen, X.-Q. Huang, X.-H. Lin and X.-Q. Cao, Anal. Chim. Acta, 2019, 1052, 124 CrossRef CAS PubMed; (g) G.-J. Mao, Z.-Z. Liang, J. Bi, H. Zhang, H.-M. Meng, L. Su, Y.-J. Gong, S. Feng and G. Zhang, Anal. Chim. Acta, 2019, 1048, 143 CrossRef CAS PubMed; (h) X.-Q. Hong, X.-H. Yu, K. Zhang and W.-H. Chen, Org. Biomol. Chem., 2018, 16, 8025 RSC; (i) K. A. Bertman, C. S. Abeywickrama, H. J. Baumann, N. Alexander, L. McDonald, L. P. Shriver, M. Konopka and Y. Pang, J. Mater. Chem. B, 2018, 6, 5050 RSC; (j) Y. Ren, L. Zhang, Z. Zhou, Y. Luo, S. Wang, S. Yuan, Y. Gu, Y. Xu and X. Zha, Anal. Chim. Acta, 2019, 1056, 117 CrossRef CAS; (k) C. Benitez-Martin, J. A. Guadix, J. R. Pearson, F. Najera, J. M. Perez-Pomares and E. Perez-Inestrosa, Sens. Actuators, B, 2019, 284, 744 CrossRef CAS; (l) C. Li, Y. Wang, S. Huang, X. Zhang, X. Kang, Y. Sun, Z. Hu, L. Han, L. Du and Y. Liu, Talanta, 2018, 188, 316 CrossRef CAS PubMed; (m) M. Zhu, P. Xing, Y. Zhou, L. Gong, J. Zhang, D. Qi, Y. Bian, H. Du and J. Jiang, J. Mater. Chem. B, 2018, 6, 4422 RSC; (n) F. Wang, S. Yu, Z. Xu, L. Li, Y. Dang, X. Xu, Y. Luo, Z. Cheng, H. Yu, W. Zhang, A. Zhang and C. Ding, Anal. Chem., 2018, 90, 7953 CrossRef CAS PubMed; (o) Z. Hu, G. Yang, J. Hu, H. Wang, P. Eriksson, R. Zhang, Z. Zhang and K. Uvdal, Sens. Actuators, B, 2018, 264, 419 CrossRef CAS.
- E. C. Freundt, M. Czapiga and M. J. Lenardo, Cell Res., 2007, 17, 956 CrossRef CAS PubMed.
- (a) Y. W. Jun, T. Wang, S. Hwang, D. Kim, D. Ma, K. H. Kim, S. Kim, J. Jung and K. H. Ahn, Angew. Chem., Int. Ed., 2018, 57, 10142 CrossRef CAS; (b) D. Lee, K. M. K. Swamy, J. Hong, S. Lee and J. Yoon, Sens. Actuators, B, 2018, 266, 416 CrossRef CAS; (c) H. Zhang, J. Liu, C. Liu, P. Yu, M. Sun, X. Yan, J.-P. Guo and W. Guo, Biomaterials, 2017, 133, 60 CrossRef CAS PubMed; (d) W. Feng and G. Feng, Dyes Pigm., 2019, 164, 174 CrossRef CAS; (e) A. Podder, S. Senapati, P. Maiti, D. Kamalraj, S. S. Jaffer, S. Khatun and S. Bhuniya, J. Mater. Chem. B, 2018, 6, 4514 RSC; (f) M.-Y. Wu, Y. Wang, Y.-H. Liu and X.-Q. Yu, J. Mater. Chem. B, 2018, 6, 4232 RSC.
- (a) X. Chen, T. Pradhan, F. Wang, J. S. Kim and J. Yoon, Chem. Rev., 2012, 112, 1910 CrossRef CAS PubMed; (b) L. Xu, Y. Xu, W. Zhu, B. Zeng, C. Yang, B. Wu and X. Qian, Org. Biomol. Chem., 2011, 9, 8284 RSC.
- Z. Li, S. Wu, J. Han and S. Han, Analyst, 2011, 136, 3698 RSC.
- X.-L. Shi, G.-J. Mao, X.-B. Zhang, H.-W. Liu, Y.-J. Gong, Y.-X. Wu, L.-Y. Zhou, J. Zhang and W. Tan, Talanta, 2014, 130, 356 CrossRef CAS PubMed.
- H.-S. Lv, S.-Y. Huang, B.-X. Zhao and J.-Y. Miao, Anal. Chim. Acta, 2013, 788, 177 CrossRef CAS PubMed.
- H.-S. Lv, S.-Y. Huang, Y. Xu, X. Dai, J.-Y. Miao and B.-X. Zhao, Bioorg. Med. Chem. Lett., 2014, 24, 535 CrossRef CAS PubMed.
- H.-S. Lv, J. Liu, J. Zhao, B.-X. Zhao and J.-Y. Miao, Sens. Actuators, B, 2013, 177, 956 CrossRef CAS.
- K.-K. Yu, K. Li, J.-T. Hou, H.-H. Qin, Y.-M. Xie, C.-H. Qian and X.-Q. Yu, RSC Adv., 2014, 4, 33975 RSC.
- H. Li, C. Wang, M. She, Y. Zhu, J. Zhang, Z. Yang, P. Liu, Y. Wang and J. Li, Anal. Chim. Acta, 2015, 900, 97 CrossRef CAS PubMed.
- Q. Wang, L. Zhou, L. Qiu, D. Lu, Y. Wu and X.-B. Zhang, Analyst, 2015, 140, 5563 RSC.
- X.-X. Zhao, D. Ge, X. Dai, W.-L. Wu, J.-Y. Miao and B.-X. Zhao, Spectrochim. Acta, Part A, 2015, 151, 218 CrossRef CAS PubMed.
- H. Zhu, J. Fan, Q. Xu, H. Li, J. Wang, P. Gao and X. Peng, Chem. Commun., 2012, 48, 11766 RSC.
- Z. Li, S. Wu, J. Han, L. Yang and S. Han, Talanta, 2013, 114, 254 CrossRef CAS PubMed.
- J. Fan, C. Lin, H. Li, P. Zhan, J. Wang, S. Cui, M. Hu, G. Cheng and X. Peng, Dyes Pigm., 2013, 99, 620 CrossRef CAS.
- X.-F. Zhang, T. Zhang, S.-L. Shen, J.-Y. Miao and B.-X. Zhao, J. Mater. Chem. B, 2015, 3, 3260 RSC.
- X.-F. Zhang, T. Zhang, S.-L. Shen, J.-Y. Miao and B.-X. Zhao, RSC Adv., 2015, 5, 49115 RSC.
- R. Sun, X.-D. Liu, Z. Xun, J.-M. Lu, Y.-J. Xu and J.-F. Ge, Sens. Actuators, B, 2014, 201, 426 CrossRef CAS.
- L.-Q. Ying and B. P. Branchaud, Bioorg. Med. Chem. Lett., 2011, 21, 3546 CrossRef CAS PubMed.
- J. Zhang, M. Yang, C. Li, N. Dorh, F. Xie, F.-T. Luo, A. Tiwari and H. Liu, J. Mater. Chem. B, 2015, 3, 2173 RSC.
- L. Chen, J. Li, Z. Liu, Z. Ma, W. Zhang, L. Du, W. Xu, H. Fang and M. Li, RSC Adv., 2013, 3, 13412 RSC.
- Y. Tian, F. Su, W. Weber, V. Nandakumar, B. R. Shumway, Y. Jin, X. Zhou, M. R. Holl, R. H. Johnson and D. R. Meldrum, Biomaterials, 2010, 31, 7411 CrossRef CAS PubMed.
- R. Sun, W. Liu, Y.-J. Xu, J.-M. Lu, J.-F. Ge and M. Ihara, Chem. Commun., 2013, 49, 10709 RSC.
- H. J. Kim, C. H. Heo and H. M. Kim, J. Am. Chem. Soc., 2013, 135, 17969 CrossRef CAS PubMed.
- G. Li, D. Zhu, L. Xue and H. Jiang, Org. Lett., 2013, 15, 5020 CrossRef CAS PubMed.
- Q. Wan, S. Chen, W. Shi, L. Li and H. Ma, Angew. Chem., Int. Ed., 2014, 53, 10916 CrossRef CAS PubMed.
- G. K. Vegesna, J. Janjanam, J. Bi, F.-T. Luo, J. Zhang, C. Olds, A. Tiwari and H. Liu, J. Mater. Chem. B, 2014, 2, 4500 RSC.
- J. Hua, F. Wu, S. Feng, J. Xu, Z. Xu, Y. Chen, T. Tang, X. Weng and X. Zhou, Sens. Actuators, B, 2014, 196, 194 CrossRef.
- M. Yu, X. Wu, B. Lin, J. Han, L. Yang and S. Han, Anal. Chem., 2015, 87, 6688 CrossRef CAS PubMed.
- D.-D. He, W. Liu, R. Sun, C. Fan, Y.-J. Xu and J.-F. Ge, Anal. Chem., 2015, 87, 1499 CrossRef CAS PubMed.
- S.-L. Shen, X.-P. Chen, X.-F. Zhang, J.-Y. Miao and B.-X. Zhao, J. Mater. Chem. B, 2015, 3, 919 RSC.
- X. Zhang, C. Wang, Z. Han and Y. Xiao, ACS Appl. Mater. Interfaces, 2014, 6, 21669 CrossRef CAS PubMed.
- B. Dong, X. Song, C. Wang, X. Kong, Y. Tang and W. Lin, Anal. Chem., 2016, 88, 4085 CrossRef CAS PubMed.
- L. Wu, Y. Wang, T. D. James, N. Jia and C. Huang, Chem. Commun., 2018, 54, 5518 RSC.
- (a) A. Dreyer and K.-J. Dietz, Antioxidants, 2018, 7, 169 CrossRef PubMed; (b) N. T. Moldogazieva, S. V. Lutsenko and A. A. Terentiev, Cancer Res., 2018, 78, 6040 CrossRef CAS PubMed; (c) M. H. Hoffmann and H. R. Griffiths, Free Radical Biol. Med., 2018, 125, 62 CrossRef CAS PubMed.
- (a) L. Fialkow, Y. Wang and G. P. Downey, Free Radical Biol. Med., 2007, 42, 153 CrossRef CAS PubMed; (b) S. G. Rhee, Exp. Mol. Med., 1999, 31, 53 CrossRef CAS PubMed; (c) A. van der Vliet and Y. M. W. Janssen-Heininger, J. Cell. Biochem., 2014, 115, 427 CrossRef CAS PubMed.
- D. Song, J. M. Lim, S. Cho, S.-J. Park, J. Cho, D. Kang, S. G. Rhee, Y. You and W. Nam, Chem. Commun., 2012, 48, 5449 RSC.
- J. Jing and J.-L. Zhang, Chem. Sci., 2013, 4, 2947 RSC.
- D. Kim, G. Kim, S.-J. Nam, J. Yin and J. Yoon, Sci. Rep., 2015, 5, 8488 CrossRef CAS PubMed.
- (a) C.-H. Sam and H.-K. Lu, J. Dent. Sci., 2009, 4, 45 CrossRef; (b) D. Lapenna and F. Cuccurullo, Gen. Pharmacol., 1996, 27, 1145 CrossRef CAS PubMed.
- (a) M. Ren, K. Zhou, L. He and W. Lin, J. Mater. Chem. B, 1716, 2018, 6 Search PubMed; (b) H. Li, J. Fan and X. Peng, Prog. Chem., 2017, 29, 17 Search PubMed; (c) Y. Yue, F. Huo, C. Yin, J. O. Escobedoc and R. M. Strongin, Analyst, 2016, 141, 1859 RSC.
- L. Yuan, L. Wang, B. K. Agrawalla, S.-J. Park, H. Zhu, B. Sivaraman, J. Peng, Q.-H. Xu and Y.-T. Chang, J. Am. Chem. Soc., 2015, 137, 5930 CrossRef CAS PubMed.
- B. Zhu, P. Li, W. Shu, X. Wang, C. Liu, Y. Wang, Z. Wang, Y. Wang and B. Tang, Anal. Chem., 2016, 88, 12532 CrossRef CAS PubMed.
- M. Ren, B. Deng, K. Zhou, X. Kong, J.-Y. Wang, G. Xu and W. Lin, J. Mater. Chem. B, 2016, 4, 4739 RSC.
- Z. Zhang, J. Fan, G. Cheng, S. Ghazali, J. Du and X. Peng, Sens. Actuators, B, 2017, 246, 293 CrossRef CAS.
- B. Zhang, X. Yang, R. Zhang, Y. Liu, X. Ren, M. Xian, Y. Ye and Y. Zhao, Anal. Chem., 2017, 89, 10384 CrossRef CAS PubMed.
- (a) N. Taniguchi, Adv. Clin. Chem., 1992, 29, 1 CAS; (b) L. A. Pham-Huy, H. He and C. Pham-Huy, Int. J. Biomed. Sci., 2008, 4, 89 CAS.
- X. Lu, Z. Chen, X. Dong and W. Zhao, ACS Sens., 2018, 3, 59 CrossRef CAS PubMed.
- (a) M. Maiorino, M. Conrad and F. Ursini, Antioxid. Redox Signaling, 2018, 29, 61 CrossRef CAS PubMed; (b) A. Romano, G. Serviddio, S. Calcagnini, R. Villani, A. M. Giudetti, T. Cassano and S. Gaetani, Free Radical Biol. Med., 2017, 111, 281 CrossRef CAS PubMed; (c) A. Marjani, Bioscience Res., 2016, 13, 21 Search PubMed.
- (a) G. P. C. Drummen, L. C. M. Liebergen, J. A. F. O. den Kamp and J. A. Post, Free Radical Biol. Med., 2002, 33, 473 CrossRef CAS; (b) M. Takahashi, M. Shibata and E. Nikia, Free Radical Biol. Med., 2001, 31, 164 CrossRef CAS.
- X. Zhang, B. Wang, C. Wang, L. Chen and Y. Xiao, Anal. Chem., 2015, 87, 8292 CrossRef CAS PubMed.
- (a) T. Takata, H. Ihara, N. Hatano, Y. Tsuchiya, T. Akaike and Y. Watanabe, Biochem. J., 2017, 474, 2547 CrossRef CAS PubMed; (b) X. Jiao, Y. Li, J. Niu, X. Xie, X. Wang and B. Tang, Anal. Chem., 2018, 90, 533 CrossRef CAS PubMed.
- (a) P. Kamoun, M.-C. Belardinelli, A. Chabli, K. Lallouchi and B. Chadefaux-Vekemans, Am. J. Med. Genet., 2003, 116A, 31 CrossRef PubMed; (b) A. R. Lippert, E. J. New and C. J. Chang, J. Am. Chem. Soc., 2011, 133, 10078 CrossRef CAS PubMed.
- (a) N. S. Cheung, Z. F. Peng, M. J. Chen, P. K. Moore and M. Whiteman, Neuropharmacology, 2007, 53, 505 CrossRef CAS PubMed; (b) L.-F. Hu, M. Lu, P. T. H. Wong and J.-S. Bian, Antioxid. Redox Signaling, 2011, 15, 405 CrossRef CAS PubMed.
- T. Liu, Z. Xu, D. R. Spring and J. Cui, Org. Lett., 2013, 15, 2310 CrossRef CAS PubMed.
- S. Yang, Y. Qi, C. Liu, Y. Wang, Y. Zhao, L. Wang, J. Li, W. Tan and R. Yang, Anal. Chem., 2014, 86, 7508 CrossRef CAS PubMed.
- X. J. Zou, Y. C. Ma, L. E. Guo, W. X. Liu, M. J. Liu, C. G. Zou, Y. Zhou and J. F. Zhang, Chem. Commun., 2014, 50, 13833 RSC.
- X. Zhang, H. Tan, Y. Yan, Y. Hang, F. Yu, X. Qu and J. Hua, J. Mater. Chem. B, 2017, 5, 2172 RSC.
- (a) X.-B. Wang, H. Cui, X.-H. Liu and J.-B. Du, Histol. Histopathol., 2017, 32, 1231 CAS; (b) X.-B. Wang, J.-B. Du and H. Cui, Life Sci., 2014, 98, 63 CrossRef CAS PubMed; (c) D. Liu, H. Jin, C. Tang and J. Du, Mini-Rev. Med. Chem., 2010, 10, 1039 CrossRef CAS PubMed.
- Y. Zhao, Y. Ma and W. Lin, Sens. Actuators, B, 2018, 268, 157 CrossRef CAS.
- (a) G.-J. Kim, K. Lee, H. Kwon and H.-J. Kim, Org. Lett., 2011, 13, 2799 CrossRef CAS PubMed; (b) C. S. Lim, G. Masanta, H. J. Kim, J. H. Han, H. M. Kim and B. R. Cho, J. Am. Chem. Soc., 2011, 133, 11132 CrossRef CAS PubMed.
- (a) C.-X. Yin, K.-M. Xiong, F.-J. Huo, J. C. Salamanca and R. M. Strongin, Angew. Chem., Int. Ed., 2017, 56, 13188 CrossRef CAS PubMed; (b) J. B. Lloyd, Biochem. J., 1986, 237, 271 CrossRef CAS PubMed.
- (a) Z. Lu, Y. Lu, C. Fan, X. Sun, M. Zhang and Y. Lu, J. Mater. Chem. B, 2018, 6, 8221 RSC; (b) Z. Zhou, G. Duan, Y. Wang, S. Yang, X. Liu, L. Zhang, R. Sun, Y. Xu, Y. Gu and X. Zha, New J. Chem., 2018, 42, 18172 RSC.
- (a) S. Lee, J. Li, X. Zhou, J. Yin and J. Yoon, Coord. Chem. Rev., 2018, 366, 29 CrossRef CAS; (b) J. Fan, Z. Han, Y. Kang and X. Peng, Sci. Rep., 2016, 6, 19562 CrossRef CAS PubMed.
- J. Fan, Z. Han, Y. Kang and X. Peng, Sci. Rep., 2016, 6, 19562 CrossRef CAS PubMed.
- C. Chen, L. Zhou, W. Liu and W. Liu, Anal. Chem., 2018, 90, 6138 CrossRef CAS PubMed.
- (a) Y. Ishimoto, T. Tanaka, Y. Yoshida and R. Inagi, Clin. Exp. Pharmacol. Physiol., 2018, 45, 1097 CrossRef CAS PubMed; (b) R. Nemes, E. Koltai, A. W. Taylor, K. Suzuki, F. Gyori and Z. Radak, Antioxidants, 2018, 7, 85 CrossRef PubMed.
- (a) P. Narne, V. Pandey and P. B. Phanithi, Mol. Neurobiol., 2019, 56, 1749 CrossRef CAS PubMed; (b) H. C. Saternos and W. A. AbouAlaiwi, Nitric Oxide, 2018, 80, 108 CrossRef CAS PubMed.
- T. R. M. da Silva, J. R. de Freitas, Q. C. Silva, C. P. Figueira, E. Roxo, S. C. Leão, L. A. R. de Freitas and P. S. T. Veras, Infect. Immun., 2002, 70, 5628 CrossRef CAS PubMed.
- H. Yu, Y. Xiao and L. Jin, J. Am. Chem. Soc., 2012, 134, 17486 CrossRef CAS PubMed.
- (a) C. Prolo, N. Rios, L. Piacenza, M. N. Álvarez and R. Radi, Free Radical Biol. Med., 2018, 128, 59 CrossRef CAS PubMed; (b) G. Ferrer-Sueta, N. Campolo, M. Trujillo, S. Bartesaghi, S. Carballal, N. Romero, B. Alvarez and R. Radi, Chem. Rev., 2018, 118, 1338 CrossRef CAS PubMed; (c) H. Zhang, J. Liu, C. Liu, P. Yu, M. Sun, X. Yan, J.-P. Guo and W. Guo, Biomaterials, 2017, 133, 60 CrossRef CAS PubMed.
- B. Guo, J. Jing, L. Nie, F. Xin, C. Gao, W. Yang and X. Zhang, J. Mater. Chem. B, 2018, 6, 580 RSC.
- (a) J. M. Fukuto, Br. J. Pharmacol., 2019, 176, 135 CrossRef CAS PubMed; (b) R. Smulik-Izydorczyk, K. Dębowska, J. Pięta, R. Michalski, A. Marcinek and A. Sikora, Free Radical Biol. Med., 2018, 128, 69 CrossRef CAS PubMed.
- X. Jing, F. Yu and L. Chen, Chem. Commun., 2014, 50, 14253 RSC.
- (a) E. M. Nolan and S. J. Lippard, Acc. Chem. Res., 2009, 42, 193 CrossRef CAS PubMed; (b) P. Jiang and Z. Guo, Coord. Chem. Rev., 2004, 248, 205 CrossRef CAS.
- L. Xue, G. Li, D. Zhu, Q. Liu and H. Jiang, Inorg. Chem., 2012, 51, 10842 CrossRef CAS PubMed.
- H.-J. Lee, C.-W. Cho, H. Seo, S. Singha, Y. W. Jun, K.-H. Lee, Y. Jung, K.-T. Kim, S. Park, S. C. Bae and K. H. Ahn, Chem. Commun., 2016, 52, 124 RSC.
- (a) G. Sivaraman, M. Iniya, T. Anand, N. G. Kotla, O. Sunnapu, S. Singaravadivel, A. Gulyani and D. Chellappa, Coord. Chem. Rev., 2018, 357, 50 CrossRef CAS; (b) J. A. Cotruvo Jr, A. T. Aron, K. M. Ramos-Torres and C. J. Chang, Chem. Soc. Rev., 2015, 44, 4400 RSC; (c) C. Shen and E. J. New, Metallomics, 2015, 7, 56 RSC.
- M. Ren, B. Deng, J.-Y. Wang, Z.-R. Liu and W. Lin, J. Mater. Chem. B, 2015, 3, 6746 RSC.
- (a) E. M. Williams, R. F. Little, A. M. Mowday, M. H. Rich, J. V. E. Chan-Hyams, J. N. Copp, J. B. Smaill, A. V. Patterson and D. F. Ackerley, Biochem. J., 2015, 471, 131 CrossRef CAS PubMed; (b) W. Qin, C. Xu, Y. Zhao, C. Yu, S. Shen, L. Li and W. Huang, Chin. Chem. Lett., 2018, 29, 1451 CrossRef CAS.
- J. Zhou, W. Shi, L.-H. Li, Q.-Y. Gong, X.-F. Wu, X.-H. Li and H.-M. Ma, Chem. – Asian J., 2016, 11, 2719 CrossRef CAS PubMed.
- (a) J. R. Xavier, K. V. Ramana and R. K. Sharma, J. Food Biochem., 2018, 42, e12564 CrossRef; (b) B. Y. Lee, J. A. Han, J. S. Im, A. Morrone, K. Johung, E. C. Goodwin, W. J. Kleijer, D. DiMaio and E. S. Hwang, Aging Cell, 2006, 5, 187 CrossRef CAS PubMed; (c) J. J. Going, R. C. Stuart, M. Downie, A. J. Fletcher-Monaghan and W. N. Keith, J. Pathol., 2002, 196, 394 CrossRef CAS PubMed.
- J. Huang, N. Li, Q. Wang, Y. Gu and P. Wang, Sens. Actuators, B, 2017, 246, 833 CrossRef CAS.
- (a) Z. Xu and L. Xu, Chem. Commun., 2016, 52, 1094 RSC; (b) H.-I. Un, S. Wu, C.-B. Huang, Z. Xu and L. Xu, Chem. Commun., 2015, 51, 3143 RSC; (c) H.-I. Un, C.-B. Huang, C. Huang, T. Jia, X.-L. Zhao, C.-H. Wang, L. Xu and H.-B. Yang, Org. Chem. Front., 2014, 1, 1083 RSC; (d) H.-I. Un, C.-B. Huang, J. Huang, C. Huang, T. Jia and L. Xu, Chem. – Asian J., 2014, 9, 3397 CrossRef CAS PubMed; (e) Z. Xu, G. Li, Y.-Y. Ren, H. Huang, X. Wen, Q. Xu, X. Fan, Z. Huang, J. Huang and L. Xu, Dalton Trans., 2016, 45, 12087 RSC; (f) Z. Xu, Y.-Y. Ren, X. Fan, S. Cheng, Q. Xu and L. Xu, Tetrahedron, 2015, 71, 5055 CrossRef CAS.
- (a) C.-B. Huang, L. Xu, J.-L. Zhu, Y.-X. Wang, B. Sun, X. Li and H.-B. Yang, J. Am. Chem. Soc., 2017, 139, 9459 CrossRef CAS PubMed; (b) L.-J. Chen, S. Chen, Y. Qin, L. Xu, G.-Q. Yin, J.-L. Zhu, F.-F. Zhu, W. Zheng, X. Li and H.-B. Yang, J. Am. Chem. Soc., 2018, 140, 5049 CrossRef CAS PubMed; (c) C.-W. Zhang, B. Ou, S.-T. Jiang, G.-Q. Yin, L.-J. Chen, L. Xu, X. Li and H.-B. Yang, Polym. Chem., 2018, 9, 2021 RSC; (d) Y.-Y. Ren, N.-W. Wu, J. Huang, Z. Xu, D.-D. Sun, C.-H. Wang and L. Xu, Chem. Commun., 2015, 51, 15153 RSC; (e) W.-J. Fan, B. Sun, J. Ma, X. Li, H. Tan and L. Xu, Chem. – Eur. J., 2015, 21, 12947 CrossRef CAS PubMed.
| This journal is © The Royal Society of Chemistry 2019 |


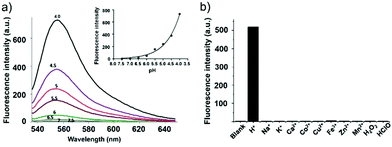
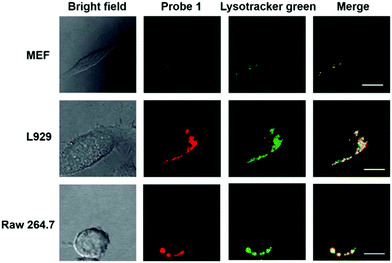

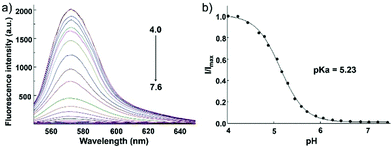


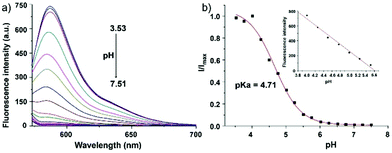


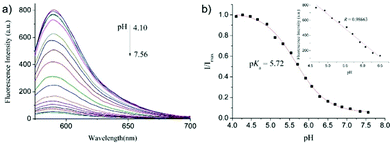
![[thin space (1/6-em)]](https://www.rsc.org/images/entities/char_2009.gif) :
:

