 Open Access Article
Capillary photoionization: interface for low flow rate liquid chromatography-mass spectrometry†
Päivi
Pöhö
 ,
Anu
Vaikkinen
 ,
Markus
Haapala
 ,
Petri
Kylli
and
Risto
Kostiainen
 *
*
Drug Research Program, Division of Pharmaceutical Chemistry and Technology, Faculty of Pharmacy, University of Helsinki, 00014 Finland. E-mail: risto.kostiainen@helsinki.fi
First published on 13th March 2019
Abstract
This is the first report on capillary photoionization (CPI) interfacing a liquid chromatograph (LC) and mass spectrometer (MS). A new heated CPI ion source was developed, including a heated transfer capillary, a wide oval-shaped and low-depth ionization chamber with a vacuum ultraviolet (VUV) transparent magnesium fluoride (MgF2) window to increase the photoionization efficiency and thus the sensitivity. As both analytes and eluent are first vaporized and then photoionized inside the CPI ion source between the atmosphere and the vacuum of MS, the ion transfer efficiency into the MS and thus the sensitivity is improved. The effect of the most important operation parameters, the eluent flow rate and temperature of the CPI source, on the signal intensity was studied with selected steroids. The feasibility of LC-CPI-MS/MS for the quantitative analysis of steroids was also studied in terms of linearity, repeatability, and limits of detection. The method showed good quantitative performance and sensitivity down to the low femto-mole level.
Introduction
Atmospheric pressure photoionization (APPI) has become an important alternative ionization technique to electrospray ionization (ESI) and atmospheric pressure chemical ionization (APCI).1 APPI provides more efficient ionization than ESI and APCI for non-polar compounds, such as many lipids and steroids.1 In all three techniques, APPI, ESI, and APCI, the compounds are commonly ionized in a free space at atmospheric pressure and transferred into the vacuum of MS using an atmospheric pressure ion (API) source. However, a significant number of ions are lost in the ion transfer.2 The ion loss at the inlet is partly because the expanding gas jet in the ion source disperses the sample to a much larger area than the diameter of the sampling orifice of the mass spectrometer.3 In order to increase the ion transfer efficiency, ion funnels are used, which efficiently capture ions in the expanding gas jet of the ESI, APCI, or APPI source and radially focus them for efficient transfer through a conductance limiting orifice.4 However, the construction of ion funnels is relatively complex and other approaches have been considered.We recently presented capillary photoionization (CPI), which provides high sensitivity for non-polar and polar compounds.5 CPI connected to the capillary extension of a mass spectrometer consisted of a heated capillary and an MgF2 window passing VUV light (10 eV photons) into the capillary. As the compounds were consecutively introduced, vaporized, and photoionized inside the CPI capillary between the atmosphere and the vacuum of MS, ion transfer efficiency and thus sensitivity is improved. Kersten et al.6 previously described a similar type of ion source called “capillary APPI” (cAPPI) consisting of a custom miniaturized spark discharge VUV lamp embedded in a non-heated transfer capillary with a windowless aperture. Later they developed a heated conical capillary APPI ion source with a MgF2 window.7 The capillary photoionization systems have been applied as an interface in gas chromatography-MS (GC-MS)5,7,8 or direct introduction MS (DI-MS)5,6,9 for the analysis of volatile or semi-volatile compounds. The characteristic feature of all of these methods is high sensitivity, and limits of detection down to the atto-mole level have been achieved for nonpolar compounds such as steroids and polyaromatic hydrocarbons.5,7,9 Although capillary photoionization has been proven to be a potential and sensitive method for the analysis of volatile and semi-volatile compounds by GC-MS or DI-MS, its use as an interface in LC-MS has not been presented. In this study, we present the first report on CPI as an interface in LC-MS. The effect of the flow rate and temperature of the CPI on the signal intensity of selected steroids is studied. Furthermore, the feasibility of LC-CPI-MS/MS for the quantitative analysis of steroids was studied in terms of linearity, repeatability, and limits of detection.
Experimental
The standard compounds progesterone (PROG), testosterone (T), dehydroepiandrosterone (DHEA), and estradiol (E2) (Fig. S1†) were from Sigma Aldrich (Steinheim, Germany). Standard stock solutions (1 mg mL−1) of the steroids and their dilutions were prepared in methanol. Methanol (LC-MS chromasolv®) and toluene (HPLC chromasolv® plus) were from Honeywell (Steinheim, Germany). Water was purified by using a MilliQ water purifying system (Merck Millipore, Molsheim, France).The liquid chromatographs used in the study were Acquity UPLC (Waters, Milford, MA, USA) and the 1100 Capillary LC system (Agilent Technologies, Waldbronn, Germany). In UPLC-MS experiments the column was a Waters BEH C18 (2.1 mm × 100 mm, 1.8 μm). The eluents were: (A) water, and (B) methanol. The gradient was: B 10–100%, 0–5 min; B 100%, 5–10 min; B 100–10%, 10–10.1 min; and B 10%, 10.1–15 min. The flow rate was 200 μL min−1 and the flow was split after the column with a split ratio of 1![[thin space (1/6-em)]](https://www.rsc.org/images/entities/char_2009.gif) :
:![[thin space (1/6-em)]](https://www.rsc.org/images/entities/char_2009.gif) 20 using an in-house made splitter. The injection volume was 10 μL (0.5 μL to mass spectrometer). In capillary LC-MS experiments, the column was a Waters Symmetry RP18 (0.3 mm × 100 mm, 3.5 μm). The eluents were: (A) water, and (B) methanol. The gradient was: B 10–100%, 0–10 min; B 100%, 10–15 min; B 100–10%, 15–20 min; and B 10%, 20–60 min. The flow rate was 10 μL min−1 and the injection volume was 1 μL.
20 using an in-house made splitter. The injection volume was 10 μL (0.5 μL to mass spectrometer). In capillary LC-MS experiments, the column was a Waters Symmetry RP18 (0.3 mm × 100 mm, 3.5 μm). The eluents were: (A) water, and (B) methanol. The gradient was: B 10–100%, 0–10 min; B 100%, 10–15 min; B 100–10%, 15–20 min; and B 10%, 20–60 min. The flow rate was 10 μL min−1 and the injection volume was 1 μL.
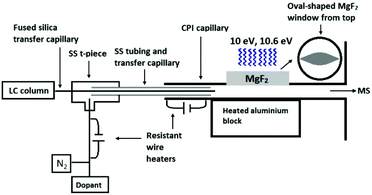
The developed CPI device connected to the glass inlet capillary of the mass spectrometer contained a stainless steel (SS) CPI capillary (i.d. 1.5 mm) with an oval-shaped opening (17 mm long, 8 mm at the widest point, 3 mm height), that was covered with a 3 mm thick MgF2 window from Thorlabs Sweden AB (Gothenburg, Sweden) (Fig. 1). An SS top plate, with an 18 mm circular opening and graphite rings as seals, was used to hold the MgF2 window in place. An rf excited 10 eV krypton VUV lamp (Heraeus Noblelight Analytics Ltd, Cambridge, U.K.) was placed on top of the MgF2 window. The CPI inlet capillary was heated (5 W) with a resistance wire heater driven by a DC power supply (ISO-TECH IPS603, RS Components, Northants, UK). The main body of the CPI device was heated (225–350 °C) with a 100 W cylindrical heater (diameter 6.5 mm, length 50 mm; Oy Meyer vastus Ab, Askola, Finland) that was controlled by using a PID500 temperature controller (Tempatron, Essex, UK). The heater was embedded in a cylindrical aluminum block (diameter 35 mm, height 55 mm), which was attached to the bottom of the CPI device.
The eluent from the LC column was directed to the CPI device through the fused-silica transfer capillary (0.15 mm i.d.) passing through an SS t-piece and SS tubing. The end of the transfer capillary was positioned inside the CPI capillary in front of the photoionization region. The dopant (toluene) was pumped with a capillary LC pump at a flow rate of 5 μL min−1 and mixed through a t-piece with nitrogen used as an auxiliary gas (400 mL min−1). The nitrogen-dopant gas mixture was heated with a resistant wire heater (approximately 110–120 °C), led into the SS t-piece, and passed coaxially between the fused silica transfer capillary and the SS tubing inside the CPI device.
An Agilent 6410 triple-quadrupole mass spectrometer (Agilent Technologies, Santa Clara, CA) was used in all experiments. Data acquisition was performed with a MassHunter Workstation Data Acquisition for Triple Quadrupole software (version B.03.01) from Agilent. Data processing was performed with MassHunter Workstation Qualitative Analysis software (version B.06.00) and Agilent Quantitative Analysis software (version B.05.00). Fragmentor voltages and collision energies were optimized for each single reaction monitoring (SRM) transition. The following mass transitions were used: DHEA: m/z 271 ([M + H − H2O]+) > 213, E2: m/z 255 ([M + H − H2O]+) > 159, PROG: m/z 315 ([M + H]+) > 97, and T: m/z 289 ([M + H]+) > 97.
Results and discussion
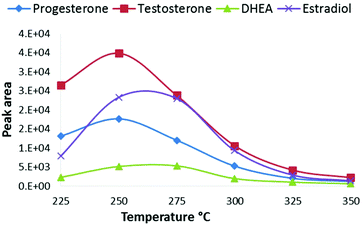
The advantage of CPI compared to common free-space atmospheric-pressure ion sources is that all eluent and analyte molecules are directed into the CPI device connected to the glass inlet capillary of the mass spectrometer. As the vaporization and ionization of analytes take place inside the heated CPI capillary, the ion transfer into the vacuum of the MS is improved. The wide light path to the ionization chamber via the MgF2 window was also designed in order to maximize the ionization efficiency with a commercially available rf-excited Kr photoionization lamp. Since the diameter of the rf VUV lamp was 13 mm, a wide ion chamber with a wide opening provides high photon flux into the source resulting in improved ionization efficiency. The low depth (3 mm) and oval shape of the ion chamber minimized dead angles, and the dead volume of the ionization chamber is negligible compared to the auxiliary gas (nitrogen) flow rate through the chamber (400 mL min−1), thus minimizing peak broadening. The low depth of the ionization chamber also ensures that a large fraction of the molecules directed to the ion source is exposed to the ionizing VUV radiation. Due to the high VUV photoabsorption cross-section of methanol, the intensity of 10 eV photons decreases along with the depth of the ionization chamber (Fig. S2†). Therefore, the low depth of the ion source improves the ionization efficiency of the dopant and thus the reactions between the dopant radical cation and the analytes result in improved sensitivity. Furthermore, the positioning of the end of the transfer capillary between the LC column and CPI device is less critical than the positioning of an APPI sprayer in relation to the inlet orifice of a mass spectrometer.Next, the main operational parameters of the CPI device were optimized using a UPLC with a splitter. The effect of the temperature of the CPI on the signal intensity was tested between 225–350 °C using an eluent flow rate of 10 μL min−1 to the CPI (Fig. 2). The signal intensity increased when the temperature was raised from 225 °C to 250–275 °C, and decreased when the temperature was raised over 275 °C. The vaporization of the eluent and the desolvation of analyte ions become more efficient at increased temperatures resulting in increased signal intensity. Inefficient vaporization, and thus low signal intensity at lower temperatures (below 250 °C), is partly due to inefficient heat transfer to the eluent moving with a high linear velocity in the ion source. The signal decrease at the CPI temperatures above 275 °C may be partly due to increased loss of ions on the wall of the CPI capillary after the ionization zone, similar to that described previously by Smith et al.3 At higher temperatures, the size of cluster ions inside the CPI capillary (after the ionization zone) is smaller than that at lower temperatures. It follows that smaller cluster ions have larger mobility than larger clusters and collisions to the CPI capillary wall increase, resulting in charge neutralization and decreased sensitivity. At higher temperatures, precursor ions of analytes may also thermally dissociate, resulting in decreased sensitivity in MS/MS analysis.
 | ||
| Fig. 2 Effect of the CPI temperature on SRM peak areas of steroids from a standard solution 100 ng mL−1. | ||
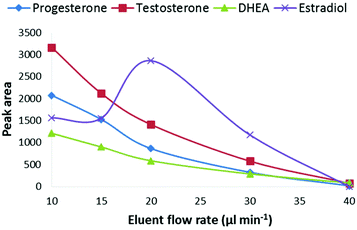
The effect of the LC-eluent flow rate on the signal intensity was studied at flow rates between 10–40 μL min−1 at a CPI temperature of 275 °C (Fig. 3). The optimal flow rate was 10 μL min−1 and at the higher flow rates, the signal intensity decreased close to the limit of detection (S/N = 3) level when the flow rate was raised to 40 μL min−1. However, estradiol behaved differentially as its signal increased, for unknown reasons, at the flow rate of 20 μL min−1 and then decreased similar to the other steroids. One possible explanation for the decreased signal at higher flow rates is that under the experimental conditions used in this work, the heat transfer to the eluent was not efficient enough for complete vaporization of the eluent before the ionization chamber. As photoionization occurs in the gas phase, incomplete vaporization of the eluent can decrease the ionization efficiency of the analytes. The size of eluent cluster ions also increases in the CPI source as the flow rate is increased. Since the proton affinity of solvent clusters increases with increasing cluster size, it is possible that the protonation of the analytes becomes less favorable. One possible explanation for the decreased ionization efficiency at higher flow rates is the photoionization efficiency of the dopant. Due to high VUV photoabsorption cross-sections of methanol and water at 10 eV, the photons are absorbed by the eluent in the ion source. According to Lambert–Beer's law, the absorption depends on the molecular density and thus the flow rate of the eluent as shown in Fig. S2.† This also means that the ionization efficiency of the dopant decreases at a constant dopant flow rate, resulting in decreasing ionization efficiency of the analytes. The reason for the decreased signal intensity at higher flow rates is most obviously a combination of several factors. Overall, these results clearly show that the described CPI ion source is feasible for low flow rate LC-MS systems such as micro or nano LC-MS. However, further optimization of the ion source geometry and ion source/MS interface may allow the use of higher flow rates.
The feasibility of UPLC-CPI-MS/MS for quantitative analysis was studied in terms of linearity, repeatability, and limit of detection (LOD) with standard samples including four steroids (Table 1). The flow rate in UPLC was 200 μL min−1 and the injection volume was 10 μL. The flow was split after the column with a ratio of 1![[thin space (1/6-em)]](https://www.rsc.org/images/entities/char_2009.gif) :
:![[thin space (1/6-em)]](https://www.rsc.org/images/entities/char_2009.gif) 20 so that the flow rate and the sample volume to the CPI were 10 μL min−1 and 0.5 μL, respectively. The linearity was tested with the sample concentration range of 5–400 ng mL−1 (2.5–200 pg to the CPI). The linearity was good, the correlation coefficients (R) being 0.990–0.998. The repeatability of injection was determined with samples having a concentration of 10 ng mL−1 (5 pg to the CPI). Relative standard deviations (RSD%) were 3–20% (n = 6) indicating acceptable repeatability. The LODs (S/N > 3) were 0.5–2.5 pg injected to CPI (1–5 ng mL−1 in a sample) showing good sensitivity of the method for the analysis of steroids. We also compared the sensitivities between standard UPLC-APPI-MS (flow rate: 200 μL min−1) under optimized conditions and UPLC-CPI-MS (flow rate to CPI: 10 μL min−1) by injecting 10 μL of the standard sample including the four test steroids at the concentration of 10 ng mL−1. As the splitter (1
20 so that the flow rate and the sample volume to the CPI were 10 μL min−1 and 0.5 μL, respectively. The linearity was tested with the sample concentration range of 5–400 ng mL−1 (2.5–200 pg to the CPI). The linearity was good, the correlation coefficients (R) being 0.990–0.998. The repeatability of injection was determined with samples having a concentration of 10 ng mL−1 (5 pg to the CPI). Relative standard deviations (RSD%) were 3–20% (n = 6) indicating acceptable repeatability. The LODs (S/N > 3) were 0.5–2.5 pg injected to CPI (1–5 ng mL−1 in a sample) showing good sensitivity of the method for the analysis of steroids. We also compared the sensitivities between standard UPLC-APPI-MS (flow rate: 200 μL min−1) under optimized conditions and UPLC-CPI-MS (flow rate to CPI: 10 μL min−1) by injecting 10 μL of the standard sample including the four test steroids at the concentration of 10 ng mL−1. As the splitter (1![[thin space (1/6-em)]](https://www.rsc.org/images/entities/char_2009.gif) :
:![[thin space (1/6-em)]](https://www.rsc.org/images/entities/char_2009.gif) 20) was used in UPLC-CPI-MS but not in UPLC-APPI-MS, the sample amount eluting to the APPI source was 100 pg and to the CPI source, 5 pg. Thus, 20 times more intense signals could be expected with standard APPI. The peak areas were, however, only 7.4–15.6 times higher with standard UPLC-APPI-MS than with UPLC-CPI-MS. This shows that the sensitivity with the CPI is at least at the same level as that with standard APPI.
20) was used in UPLC-CPI-MS but not in UPLC-APPI-MS, the sample amount eluting to the APPI source was 100 pg and to the CPI source, 5 pg. Thus, 20 times more intense signals could be expected with standard APPI. The peak areas were, however, only 7.4–15.6 times higher with standard UPLC-APPI-MS than with UPLC-CPI-MS. This shows that the sensitivity with the CPI is at least at the same level as that with standard APPI.
| Compound | LOD (pg) | Linearity (R) | Repeatability RSD% (10 ng mL−1, n = 6) |
|---|---|---|---|
| Estradiol | 0.5 | 0.997 | 3.2 |
| Testosterone | 1.25 | 0.994 | 12.7 |
| DHEA | 2.5 | 0.998 | 20.1 |
| Progesterone | 2.5 | 0.990 | 13.2 |
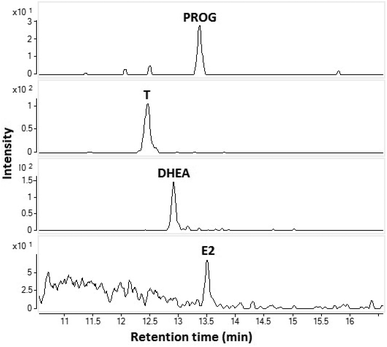
The feasibility of the CPI in the coupling of capillary LC to MS was demonstrated by analyzing a standard sample (10 ng mL−1) (Fig. 4). The flow rate was 10 μL min−1 (no splitter was used) and the injection volume was 1 μL corresponding to an amount of approximately 30 fmol (10 pg) injected to the column. All four steroids were clearly detected. This experiment clearly shows that the CPI is a potential method for coupling of low flow rate LC to MS and is especially suitable for the analysis of low volume samples.
 | ||
| Fig. 4 SRM-chromatograms of E2, T, DHEA, and PROG from a standard mixture 10 ng mL−1 using capillary LC-CPI-MS/MS. | ||
Conclusions
In this work we have presented for the first time capillary photoionization in coupling LC to MS. A new type of CPI was developed, and its feasibility was tentatively studied for the analysis of steroids. The results showed that CPI provides high sensitivity and good quantitative performance at low flow rates (10 μL min−1), encouraging the further development of the CPI set-up for LC-MS. Thus far, electrospray ionization (ESI) has nearly exclusively been used in micro or nano LC-MS. However, the ionization efficiency with ESI may be poor for non-polar compounds and therefore some attempts have been made in order to develop APPI methods for low flow rate LC-MS.10–13 However, all of the earlier methods have been based on free space APPI sources, in which the ion transfer from atmosphere to the vacuum of MS is sub-optimal. As analytes are vaporized and sequentially ionized inside the CPI capillary connected between the atmosphere and the vacuum of MS, the ion transfer efficiency with CPI is improved resulting in high sensitivity.Conflicts of interest
There are no conflicts to declare.Acknowledgements
The authors acknowledge the financial support provided by Business Finland Large Strategic Opening Project (40395/13).Notes and references
- T. J. Kauppila, J. A. Syage and T. Benter, Mass Spectrom. Rev., 2017, 36, 423–449 CrossRef CAS PubMed.
- T. R. Covey, B. A. Thomson and B. B. Schneider, Mass Spectrom. Rev., 2009, 28, 870–897 CrossRef CAS PubMed.
- J. S. Page, R. T. Kelly, K. Tang and R. D. Smith, J. Am. Soc. Mass Spectrom., 2007, 18, 1582–1590 CrossRef CAS PubMed.
- R. T. Kelly, A. V. Tolmachev, J. S. Page, K. Tang and R. D. Smith, Mass Spectrom. Rev., 2010, 29, 294–312 Search PubMed.
- M. Haapala, T. Suominen and R. Kostiainen, Anal. Chem., 2013, 85, 5715–5719 CrossRef CAS PubMed.
- H. Kersten, V. Derpmann, I. Barnes, K. J. Brockmann, R. O'Brien and T. Benter, J. Am. Soc. Mass Spectrom., 2011, 22, 2070–2081 CrossRef CAS PubMed.
- H. Kersten, K. Kroll, K. Haberer, K. J. Brockmann, T. Benter, A. Peterson and A. Makarov, J. Am. Soc. Mass Spectrom., 2016, 27, 607–614 CrossRef CAS PubMed.
- T. J. Kauppila, H. Kersten and T. Benter, J. Am. Soc. Mass Spectrom., 2015, 26, 1036–1045 CrossRef CAS PubMed.
- M. F. Mirabelli and R. Zenobi, Anal. Chem., 2018, 90, 5015–5022 CrossRef CAS PubMed.
- V. Vrkoslav, B. Rumlová, T. Strmeň, P. Nekvasilova, M. Šulc and J. Cvačka, Rapid Commun. Mass Spectrom., 2018, 32, 639–648 CrossRef CAS PubMed.
- T. J. Kauppila, P. Östman, S. Marttila, R. A. Ketola, T. Kotiaho, S. Franssila and R. Kostiainen, Anal. Chem., 2004, 76, 6797–6801 CrossRef CAS PubMed.
- A. Kruve, M. Haapala, V. Saarela, S. Franssila, R. Kostiainen, T. Kotiaho and R. A. Ketola, Anal. Chim. Acta, 2011, 696, 77–83 CrossRef CAS PubMed.
- L. L. Ahonen, M. Haapala, V. Saarela, S. Franssila, T. Kotiaho and R. Kostiainen, Rapid Commun. Mass Spectrom., 2010, 24, 958–964 CrossRef CAS PubMed.
Footnote |
| † Electronic supplementary information (ESI) available: Steroid structures and VUV light transmittance in the CPI ion source at different MeOH flow rates. See DOI: 10.1039/c9an00258h |
| This journal is © The Royal Society of Chemistry 2019 |


