 Open Access Article
Creative Commons Attribution 3.0 Unported Licence
Screening of two-photon activated photodynamic therapy sensitizers using a 3D osteosarcoma model†
Agnes
Dobos
ab,
Wolfgang
Steiger
ab,
Dominik
Theiner
a,
Peter
Gruber
ab,
Markus
Lunzer
 abc,
Jasper
Van Hoorick
 de,
Sandra
Van Vlierberghe
 de and
Aleksandr
Ovsianikov
 *ab
*ab
aTU Wien, Institute of Materials Science and Technology, Getreidemarkt 9, 1060 Vienna, Austria. E-mail: Aleksandr.Ovsianikov@tuwien.ac.at
bAustrian Cluster for Tissue Regeneration, Austria Web: http://www.tissue-regeneration.at
cTU Wien, Institute of Applied Synthetic Chemistry, Getreidemarkt 9, 1060 Vienna, Austria
dGhent University, Polymer Chemistry and Biomaterials Group, Centre of Macromolecular Chemistry, Krijgslaan 281, S4, 9000 Ghent, Belgium
eBrussels Photonics, Department of Applied Physics and Photonics, Vrije Universiteit Brussel and Flanders Make, Pleinlaan 2, 1000 Brussels, Belgium
First published on 27th March 2019
Abstract
Photodynamic therapy (PDT) involves a photosensitizing agent activated with light to induce cell death. Two-photon excited PDT (TPE-PDT) offers numerous benefits compared to traditional one-photon induced PDT, including an increased penetration depth and precision. However, the in vitro profiling and comparison of two-photon photosensitizers (PS) are still troublesome. Herein, we report the development of an in vitro screening platform of TPE-PS using a 3D osteosarcoma cell culture. The platform was tested using three different two-photon (2P) active compounds – a 2P sensitizer P2CK, a fluorescent dye Eosin Y, and a porphyrin derivative (TPP). Their 2P absorption cross-sections (σ2PA) were characterised using a fully automated z-scan setup. TPP exhibited a remarkably high σ2PA at 720 nm (8865 GM) and P2CK presented a high absorption at 850 nm (405 GM), while Eosin Y had the lowest 2P absorption at the studied wavelengths (<100 GM). The cellular uptake of PS visualized using confocal laser scanning microscopy showed that both TPP and P2CK were internalized by the cells, while Eosin Y stayed mainly in the surrounding media. The efficiency of the former two TPE-PS was quantified using the PrestoBlue metabolic assay, showing a significant reduction in cell viability after two-photon irradiation. The possibility of damage localization was demonstrated using a co-culture of adipose derived stem cells together with osteosarcoma spheroids showing no signs of damage to the surrounding healthy cells after TPE-PDT.
Introduction
Photodynamic therapy (PDT) typically comprises three individually harmless components: a photosensitizing agent (PS), light and oxygen to induce cell damage. PDT has been extensively researched for multiple clinical applications such as the treatment of cancer and several other diseases, including a therapy for posterior capsule opacification and age-related macular degeneration.1,2 PDT could also provide possible alternatives to eliminate pathogenic microorganisms, such as viruses, fungi, yeast and antibiotic resistant bacteria.3In PDT, energy is transferred from light to oxygen by the PS to generate reactive oxygen species (ROS).4 The PS absorbs photons of a certain wavelength and is thereby transformed into an excited state, which can dissipate its excitation energy by emission of heat or light, or by intersystem crossing to a triplet-state. There are two types of reactions that can take place once the PS is excited which can also occur simultaneously. The Type I pathway involves a hydrogen atom (or electron) transfer from the excited PS to a substrate such as a molecule or the cell membrane to form radicals, which in turn react with molecular oxygen species to produce ROS such as superoxide or hydroxyl radicals. In the Type II pathway, singlet oxygen is produced directly after the PS transfers energy to molecular oxygen.5 There are several different processes that could be initiated by PDT and are involved in tumour destruction. First, ROS can cause apoptosis or necrosis of tumour cells. In another mechanism, singlet oxygen can damage the vasculature of tumours.5 Finally, PDT can activate the immune response by membrane dysregulation of surface integrin-associated protein CD47 and damage-associated molecular patterns.6
There are several factors that have an effect on PDT efficacy such as PS localization, the administration interval, the local oxygen concentration and the light exposure time.5 The localization of the PS is crucial due to the short half-life (<50 ns) and radius of action (<40 nm) of singlet oxygen.7,8 As a consequence, sensitizers which are not internalized by cells usually show poor performance in PDT even if they produce large amounts of radicals.5 The wavelength and the type of light delivery also have a large effect on the efficacy of PDT.9 The applied wavelength influences not only the PS absorption efficiency, but also the penetration depth. Due to the wavelength-dependent scattering and absorption of skin, red light penetrates the skin and human tissues deeper than blue light, about 5 mm vs. 1 mm, respectively.10
In this respect, two-photon excited photodynamic therapy (TPE-PDT) offers several benefits when compared to traditional one-photon excited PDT, such as deeper penetration of tissue. Due to the non-linear absorption, the PDT damage can be confined to a small excitation volume reducing collateral damage to the surrounding healthy tissue. In TPE-PDT, the PS is promoted to its excited state by absorbing two photons of a longer wavelength simultaneously during irradiation. Relaxation occurs via the Type I or Type II reaction with molecular oxygen as described previously.11 Due to the nonlinear behaviour of the absorption process, high peak power lasers such as mode-locked Ti:sapphire lasers with femtosecond pulse durations are required to achieve efficient two-photon absorption.12 Different photosensitizers have been developed for TPE-PDT applications, including porphyrin derivatives, ruthenium complexes, conjugated polymers, and nanoparticles.11,13–23 The main considerations when choosing an optimal two-photon excitation photosensitizer (TPE-PS) are low dark toxicity, high two-photon absorption cross-section at a certain wavelength and a substantial triplet state quantum yield.24
Pre-clinical testing of TPE-PS presents some challenges. TPE-PDT has been tested in vivo using animal models to induce cancer regression in mice.25 The in vitro evaluation of treatment efficacy usually relies on 2D monolayer cell systems. However, there is increasing evidence that this setting does not provide sufficient comparison with in vivo conditions as the cellular microenvironment has a pronounced effect on the response to treatment.26,27 Microfluidic 3D cell cultures have been proposed previously to study the classical one-photon PDT efficacy but most of these systems rely on the qualitative assessment of cell viability using live–dead staining.28,29 However, an in vitro platform for quantifying the TPE-PDT efficiency using a hydrogel-based multicellular 3D cell culture has not been reported to date.
The aim of this study is to introduce a pre-screening platform of TPE-PS using a 3D osteosarcoma model together with adipose tissue-derived stem cells (ASC/TERT). Three different TPE-PS were used for testing the system, a two-photon photoinitiator P2CK, a fluorescent dye Eosin Y, and a porphyrin (TPP) (Fig. 1). The most extensively studied photosensitizers are in fact porphyrins, which contain four pyrrole rings with side chains with an absorption maximum usually centred around 400 nm.30 Eosin Y absorbs in the visible light region (490–650 nm) and has been proposed as a photosensitizer to inactivate bacterial biofilms using PDT.31 It has also been employed as a sensitizer for two-photon polymerization processes together with a co-initiator and an acrylate-based resin and for localized two-photon induced thiol–ene click reactions.32,33 P2CK, a water soluble benzylidene cycloketone-based two-photon photoinitiator, has been used for two-photon polymerization of hydrogels. However, its use together with cells leads to poor cell survival and considerable phototoxicity in the concentration range (>1 mM) required for the formation of stable hydrogel structures.34,35 On the other hand, when used as a two-photon sensitizer for cleavage of photolabile hydrogels, a much lower concentration is necessary (<0.5 mM) that does not significantly harm cells outside of the focal volume.36 In order to optimize a working window for the proposed TPE-PS, the irradiation wavelengths should match the two-photon absorption maximum of the used PS. The z-scan technique, introduced in 1990, has become a standard method to characterize higher order nonlinearities such as two-photon absorption (2PA) cross-sections.37 Using a motorized stage, a thin sample (the sample length smaller than the Rayleigh length of the focused laser beam) is moved in and out of the focal plane of a laser beam along the z-axis.37,38 First, the 2PA cross-sections of the compounds in the 720–1000 nm spectral range were established using an in-house developed automated z-scan setup. Afterwards, the cellular uptake of the TPE-PS was visualized using laser scanning confocal microscopy (LSM). The efficacy of the PS excited at their optimal wavelength was quantified via PrestoBlue metabolic assay using a 3D model of osteosarcoma cells encapsulated in a gelatin-based hydrogel. Finally, to show the precision of the irradiation, ASC/TERT cells, co-cultured together with osteosarcoma (MG63) spheroids, were visualized after selective two-photon irradiation of spheroids only in the presence of the PS using LSM.
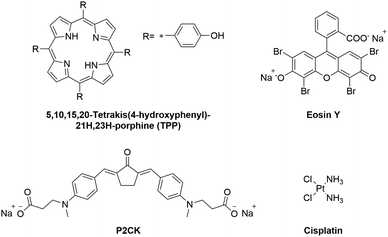 | ||
| Fig. 1 Molecular structures of the investigated two-photon photosensitizers (TPE-PS) and the reference compound cisplatin. | ||
Experimental
All chemicals and cells were purchased from Sigma-Aldrich (Saint Louis, USA) unless otherwise stated. GraphPad Prism 6 was used for graphs.Spectral scanning of photosensitizers
UV-VIS spectra were obtained using a PerkinElmer Lambda 750 spectrometer. Z-Scan measurements were performed on a home-built setup powered using a high power femtosecond laser oscillator (MaiTai DeepSee, Spectra Physics, Santa Clara, USA) with the tuning range of 690–1040 nm, a repetition rate of 80 MHz and a pulse duration of 70 fs.39 Using a motorized stage, the transmitted signal at 25 positions along the focused beam is recorded. A beam chopper with 90 Hz rotation frequency and an on-time of 78 μs reduces the exposure time of the sample to prevent thermo-optical effects caused by the high repetition rate of the laser.40 Each z-scan setting was measured in triplicate. Stock solutions of P2CK (10 mM), Eosin Y (3 mM), and cisplatin (1 mM) were prepared by dissolving the respective PS in PBS, while 5,10,15,20-tetrakis(4-hydroxyphenyl)-21H,23H-porphyrin (TPP) was dissolved in DMSO at a concentration of 10 mM. For each material, four different laser powers were used to verify that heat accumulation caused by the high repetition rate of the laser did not affect the measured 2PA behaviour.Two-photon irradiation setup
The abovementioned laser was used throughout the TPE-PDT experiments with two different objectives (C-Achroplan 10×/0.3 NA, and 2.5×/0.085 NA, ZEISS).34The peak intensity (Ipeak) of the laser for a sech2 shaped pulse is calculated by the following eqn (1);41
 | (1) |
The full width at half maximum (FWHM) of the volumetric pixel (voxel) for the different objectives and wavelengths was calculated by the following eqn (2) and (3) and the results can be found in Table 1;42
 | (2) |
 | (3) |
| Objective | Wavelength [nm] | FWHMx,y [μm] | FWHMz [μm] | Volume [μm3] |
|---|---|---|---|---|
| 10×, 0.3 NA | 720 | 0.9 | 13.2 | 18.9 |
| Precision | 850 | 1 | 15.5 | 31.1 |
| 960 | 1.2 | 17.5 | 44.8 | |
| 2.5×, 0.085 NA | 720 | 3.2 | 165.9 | 2672.6 |
| High-throughput | 850 | 3.8 | 195.8 | 4397.4 |
| 960 | 4.3 | 221.2 | 6335.2 | |
Cell culture
mCherry-labelled MG63 osteosarcoma cells and GFP-labelled adipose-derived stem cells (ASC/TERT1) (Evercyte, Vienna, Austria), provided by Ludwig-Boltzmann Institute for Experimental and Clinical Traumatology, were maintained at 37 °C and 5% CO2 in an incubator. The transfection of the cells is described elsewhere.43 The osteosarcoma cells were cultivated in DMEM high glucose supplemented with 10% FCS and 1% penicillin–streptomycin and the adipose tissue-derived stem cells were cultured in EGM-2 (Lonza, Walkerville, MD, USA) supplemented with 10% FCS. The cells were detached using 0.5% trypsin–EDTA solution and centrifuged at 170 relative centrifugal force (RCF) for 5 min. Afterwards, cells were re-suspended in the corresponding media and reseeded in T75 cell culture flasks (VWR, Radnor, PA, USA).Gelatin-norbornene synthesis
Gelatin-norbornene with a degree of substitution (DS) of 90% was synthesized according to a previously reported protocol.44 In brief, for the preparation of 10 g of GelNB, 1.6 g of 5-norbornene-2-carboxylic acid was dissolved in dry DMSO (Chem-Lab, Zedelgem, Belgium) under an inert atmosphere (Ar). After complete dissolution, 1.476 g (7.7 mmol) of 1-ethyl-3-(3-dimethylaminopropyl) carbodiimide (TCI Chemicals, Tokyo, Japan) was added to the reaction mixture together with 1.33 g (11.55 mmol) of N-hydroxysuccinimide followed by degassing 3 times. The mixture was allowed to react at room temperature for 25 h to eliminate any unreacted EDC functionalities. Next, 10 g of gelatin type B was dissolved in 150 mL of dry DMSO at 50 °C under Ar and reflux conditions. After complete dissolution, the prepared 5-norbornene-2-succinimidylester mixture was added to the gelatin solution followed by degassing 3 times. The reaction was allowed to proceed for 20 h followed by precipitating in a tenfold excess of acetone. Next, the precipitate was isolated using filtration (VWR, pore size 12–15 μm, Radnor, USA) on a Büchner filter. After washing, the precipitate was re-dissolved in double distilled water (ρ = 18.2 MΩ cm) and dialysed (Spectra/por 4: MWCO 12–14 kDa) for 24 h at 40 °C against distilled water. After dialysis, the pH of the solution was adjusted to 7.4 using a 5 M NaOH solution, to obtain a clear solution. The gel-NB was isolated using freezing and lyophilisation. (Christ freeze-dryer Alpha 2-4 LSC, Martin Christ GmbH, Osterode am Harz, Germany).Cell viability assay
10 wt% gelatin-norbornene (GelNB, DS = 90%) stock solution was prepared in PBS. MG63 cells were trypsinized and resuspended in cell culture media (3 million cells per mL) to achieve a final concentration of 5 wt% GelNB. Next, dithiothreitol in a 1![[thin space (1/6-em)]](https://www.rsc.org/images/entities/char_2009.gif) :
:![[thin space (1/6-em)]](https://www.rsc.org/images/entities/char_2009.gif) 1 thiol–ene ratio (10 mM) and 0.15 mM lithium phenyl-2,4,6-trimethylbenzoylphosphinate (Li-TPO) were added.40 The optimal cell number for encapsulation was chosen to be 3 million per mL based on a preliminary experiment (Fig. S1†). 15 μL of the hydrogel-cell suspension was added to each well of a glass bottom 384-well plate (Greiner Bio-One, Kremsmünster, Germany). Encapsulation was performed by 1 Joule UV-irradiation (368 nm) (Boekel UV Crosslinker, Boekel Industries, Feasterville, USA).44 In order to establish a working concentration for the PS, different concentrations of the PS were added and incubated for 4 h. TPP was dissolved in DMSO at a concentration of 1 mg mL−1 and diluted to the required concentration using cell culture media. The DMSO concentration never exceeded 0.1% of the media. Afterwards, the samples were washed and incubated for 2 days to remove any residual PS. The PrestoBlue metabolic assay was used according to the protocol provided by the manufacturer (Invitrogen, Carlsbad, USA). The emission at 590 nm was recorded at an excitation wavelength of 560 nm using a plate reader (BioTek Synergy H1, Winooski, USA). Afterwards, the efficacy of the light treatment was established. The highest non-toxic concentration of the PS was established to be 0.6 μM for TPP, 0.5 mM for P2CK and 0.25 mM for Eosin Y. MG63 cells were encapsulated in the previously described manner and incubated with the PS for 4 h before they were two-photon irradiated at the respective optimal wavelength, 720 nm for TPP and 850 nm for P2CK using a 2.5× objective, with an applied peak intensity of 550 GW cm−2 and a laser writing speed of 4 m s−1. Afterwards, the wells were washed and the PrestoBlue assay was performed. Due to the low two-photon absorption of Eosin Y and the insufficient output of the laser system used at 960 nm, Eosin Y was only used for cancer spheroid experiments.
1 thiol–ene ratio (10 mM) and 0.15 mM lithium phenyl-2,4,6-trimethylbenzoylphosphinate (Li-TPO) were added.40 The optimal cell number for encapsulation was chosen to be 3 million per mL based on a preliminary experiment (Fig. S1†). 15 μL of the hydrogel-cell suspension was added to each well of a glass bottom 384-well plate (Greiner Bio-One, Kremsmünster, Germany). Encapsulation was performed by 1 Joule UV-irradiation (368 nm) (Boekel UV Crosslinker, Boekel Industries, Feasterville, USA).44 In order to establish a working concentration for the PS, different concentrations of the PS were added and incubated for 4 h. TPP was dissolved in DMSO at a concentration of 1 mg mL−1 and diluted to the required concentration using cell culture media. The DMSO concentration never exceeded 0.1% of the media. Afterwards, the samples were washed and incubated for 2 days to remove any residual PS. The PrestoBlue metabolic assay was used according to the protocol provided by the manufacturer (Invitrogen, Carlsbad, USA). The emission at 590 nm was recorded at an excitation wavelength of 560 nm using a plate reader (BioTek Synergy H1, Winooski, USA). Afterwards, the efficacy of the light treatment was established. The highest non-toxic concentration of the PS was established to be 0.6 μM for TPP, 0.5 mM for P2CK and 0.25 mM for Eosin Y. MG63 cells were encapsulated in the previously described manner and incubated with the PS for 4 h before they were two-photon irradiated at the respective optimal wavelength, 720 nm for TPP and 850 nm for P2CK using a 2.5× objective, with an applied peak intensity of 550 GW cm−2 and a laser writing speed of 4 m s−1. Afterwards, the wells were washed and the PrestoBlue assay was performed. Due to the low two-photon absorption of Eosin Y and the insufficient output of the laser system used at 960 nm, Eosin Y was only used for cancer spheroid experiments.
Cellular uptake of photosensitizers
MG63 cells were seeded in a 96-well plate (5000 cells per well) and incubated overnight. The next day, solutions of the photosensitizers were added at concentrations of 0.5 mM P2CK, 0.25 mM Eosin Y, and 0.6 μM TPP. The cells were incubated for 4 h before laser scanning microscopy (LSM 700, Carl-Zeiss, Oberkochen, Germany) images were obtained using a 32× water-immersion objective (32×, 0.85 NA, ZEISS), using an excitation wavelength of 555 nm for P2CK and 488 nm for TPP and Eosin Y.Cell spheroid imaging
In order to visualize that TPE-PDT can be restricted to the two-photon irradiated volume, MG63 spheroids co-cultured together with adipose-derived stem cells were used. Spheroids were produced using microtissue-molds according to a protocol described elsewhere.43 Once spheroids were formed after 24 h, they were encapsulated together with 1 million per mL concentration of ASC/TERT-GFP cells in 5 wt% GelNB prepared following the abovementioned protocol. The cell containing hydrogels were incubated overnight and then imaged using LSM. Afterwards, different concentrations of the PS were added for 4 h and then spheroids were irradiated through a 10× objective using a peak intensity of 700 GW cm−2. After the PDT treatment, the hydrogel constructs were washed and then incubated for 2 days before LSM images were obtained. As a positive control, 30 μM cisplatin was incubated with cells for 48 h before cells were imaged using LSM.Results and discussion
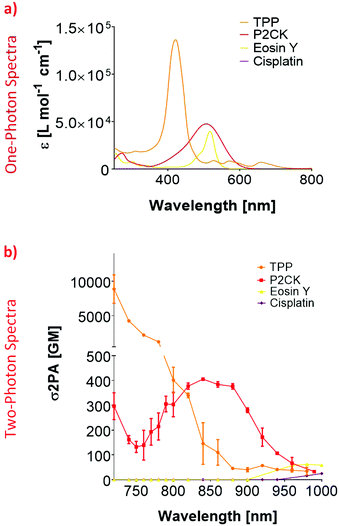
In order to establish an optimal wavelength for TPE-PDT, the absorption spectrum for the different PS has to be determined. To this end, the two-photon absorption spectra were obtained by z-scan measurements.45 Since the linear UV/VIS absorption maximum of Eosin Y was at 506 nm, the 2PA absorption region was estimated to be around 1000 nm (Fig. 2a). Although the z-scan assay did yield a change in the signal at the focus at 1000 nm, this change was within the noise range of the setup and therefore did not allow the reliable extraction of a two-photon absorption cross-section (σ2PA). To overcome this limitation, the Eosin Y concentration was increased to 3 mM for further measurements. These measurements indicated an optimal two-photon absorption window for Eosin Y at around 960–1000 nm. For cisplatin, a concentration of 1 mM in PBS was sufficient to measure the nonlinear absorption. While both compounds exhibited nonlinear absorption behaviour, their 2PA were relatively low, i.e. below 100 Göppert-Mayer (GM, 1 GM = 10−50 cm4 s per photon per molecule).46,47 The z-scan analysis of a 10 mM P2CK solution in PBS revealed an increase in σ2PA towards 700 nm, and a local absorption maximum at 850 nm (405 GM).z-Scan measurements of TPP were performed using a 10 mM solution in DMSO. The results for TPP showed a 2PA cross-section of 112 GM at 860 nm which decreased to 34 GM at 980 nm. At 1000 nm, the signal dropped below the detection limit. The 2PA cross-section increased drastically towards 700 nm where the extracted 2PA cross-section was in the range of a several thousand GM (Fig. 2b). Due to this high σ2PA, a concentration study was carried out (Fig. S2†). This was performed to test if a variation in concentration affects the 2PA behaviour. Therefore, three additional concentrations of TPP in DMSO (0.5, 1 and 2 mM) were selected. Even at 0.5 mM, the signal drop at 700 nm was still 17%, exhibiting significantly higher 2PA activity than the other screened substances, which is due to the larger conjugated π-system of TPP.
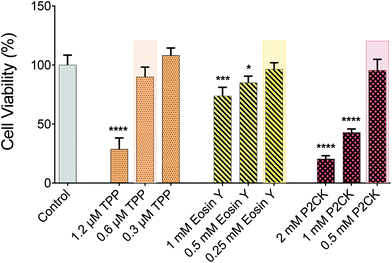
For the in vitro 3D TPE-PDT experiments, MG63 osteosarcoma cells were encapsulated in 5 wt% gelatin-norbornene (GelNB) hydrogel supplemented with a dithiothreitol (DTT) crosslinker in an equimolar thiol–ene ratio and the UV-photoinitiator Li-TPO (0.15 mM) in a glass bottom 384-well plate by UV-induced photo-polymerization. To establish the biocompatible concentration for each PS, Eosin Y and P2CK were dissolved in cell culture media. TPP was dissolved in DMSO at a concentration of 1 mg mL−1 and was further diluted in cell culture media, not to exceed 0.1% DMSO of the total volume. Different concentrations of the PS were added to the wells and incubated for 4 h. The dark cytotoxicity of the PS was established by the PrestoBlue metabolic assay, which is based on a resazurin-based solution that is cell permeable and can be reduced inside the mitochondria of living cells. The fluorescent reaction product can be detected and quantified using a spectrometer/plate reader. The highest possible biocompatible concentration was used for the later experiments, highlighted in Fig. 3. P2CK was tolerated by the cells up to 0.5 mM, which was the highest among the substances, followed by Eosin Y with 0.25 mM whereas TPP was non-toxic under dark conditions up to 0.6 μM.
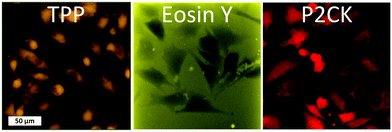
Besides the 2PA spectra of the substances, which are vital to establish the optimal working window, the localization of the PS is also of crucial importance. Since most PS are fluorescent, a confocal laser scanning microscope (LSM) can be used to determine their accumulation. The PS was incubated with MG63 osteosarcoma cells using a 2D monolayer culture to monitor the cellular uptake. Eosin Y did not enter the cell membrane, while both TPP and P2CK can be traced within the cells (Fig. 4). These results suggest that Eosin Y might not work efficiently as a PDT agent. On the other hand, both P2CK and TPP show high potential for TPE-PDT based on their accumulation inside the cells in combination with their higher σ2PA at relevant wavelengths.
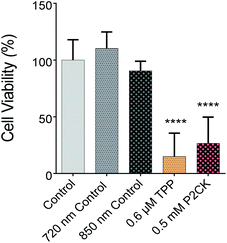
Once the biocompatible concentrations of the TPE-PS were established for dark conditions, MG63 cells, encapsulated in the GelNB hydrogel using the previously described procedure, were exposed to laser irradiation in the presence or absence of the TPE-PS. Each well was irradiated for 10 min using a peak intensity of 550 GW cm−1 at respective wavelengths. Due to the low output of the laser in the case of longer wavelengths (960 nm), only TPP and P2CK were used for quantitative assessment of the phototoxicity caused by irradiation. The wells were irradiated using a 2.5× objective with a NA of 0.085. Therefore, the volumetric pixel (voxel) is expected to be over 100-fold larger than in the case of the 10× objective, enabling a very high scanning speed of 4 m s−1 and the exposure of the whole well at the same time (Table 1). This permits the simple comparison of different compounds using the PrestoBlue assay, making the high throughput screening possible. Control wells which were only treated with 720 nm and 850 nm laser light in the absence of PS did not differ in cell viability compared to the non-irradiated controls, but both 0.5 mM P2CK and 0.6 μM TPP exhibited significant phototoxicity towards the cancer cells, leading to a viability of 27% and 15%, respectively (Fig. 5). In the case of P2CK, this could be translated to a 65% and for TPP a 75% decrease in cell viability upon irradiation at their optimal wavelengths when compared to the dark conditions.
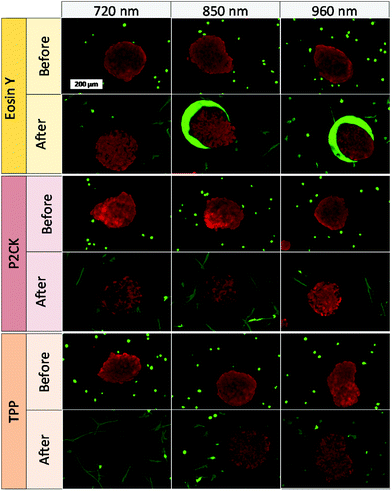
One of the main advantages that TPE-PDT has to offer in comparison to conventional PDT is that the cellular damage can be reduced to the highly localized irradiated region, while conventional PDT can cause cell death in the surrounding tissue as well. The precision of the irradiation is dependent on the spot size of the laser, which is reliant on the numerical aperture of the objective. As a result, the irradiated volume can be kept relatively small when using a 10× objective with 0.3 NA (Table 1). As a proof of principle of the high spatiotemporal control, mCherry labelled MG63 spheroids (red) were encapsulated in a single cell suspension of GFP-labelled ASC/TERT cells (green). Only the spheroids were irradiated in the presence of the respective PS. As the cells are already fluorescently labelled, no additional live-dead staining was required to address the cell viability. If the cellular damage is caused by TPE-PDT, the damage will only appear in the irradiated regions, and if the interaction is mediated by one-photon absorption, the surrounding green cells will be impaired as well. The controls irradiated at 720 nm, 850 nm and 960 nm with a peak intensity of 700 GW cm−2 showed no negative effect on cell viability (Fig. S3†). 0.25 mM Eosin Y irradiated at 960 nm also did not affect the cell viability. The green halo around the spheroids in the Eosin Y sample is probably a result from localized Eosin Y grafting into the hydrogel upon irradiation. The low efficiency of Eosin Y can be explained by its low cellular uptake (Fig. 4) and its low two-photon absorption in the spectral region accessible by the setup. Our study demonstrates that Eosin Y can be used in the presence of cells without significantly harming them. P2CK (0.5 mM), on the other hand, causes substantial damage to the MG63 cell spheroid, both at 720 nm and 850 nm, as it has a relatively high σ2PA at both these wavelengths (i.e. 292 GM and 405 GM respectively). At 960 nm, where its σ2PA (66 GM) is low, the spheroids remained intact. In the presence of TPP, MG63 spheroids were completely eliminated at 720 nm where TPP has a σ2PA as high as 8865 GM, while no significant damage was caused at higher wavelengths at which the σ2PA of TPP was below 100 GM (Fig. 6). When compared to a common chemotherapeutic agent, cisplatin, the cell damage could be successfully restricted to the irradiated regions (Fig. 7), demonstrating the benefit of TPE-PDT in terms of localized targeted treatment.
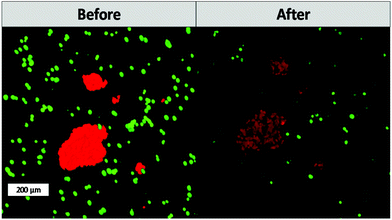 | ||
| Fig. 7 Cell viability after treatment with 30 μM cisplatin. Cisplatin affects both the viability of the ASC and MG63 cells. | ||
Conclusions
In this study, we presented a systematic in vitro screening platform for TPE-PS. The automated z-scan setup enabled the determination of the two-photon absorption spectra of the investigated TPE-PS, providing indications about the optimal working window for each compound. Our results also demonstrated that the localization and the σ2PA of TPE-PS are of crucial importance for the PDT efficacy. Additionally, the TPE-PDT efficacy was quantified using a 3D model via the PrestoBlue metabolic assay, showing a significant reduction in cell viability after 2P irradiation in the presence of both P2CK and TPP. We were able to demonstrate the spatiotemporal control of TPE-PS using a 3D co-culture tumour model. The precision of TPE-PDT was evaluated by irradiating exclusively the osteosarcoma cells. In contrast to the use of cisplatin, no collateral damage to non-irradiated regions was observed. Our pre-screening approach enables high throughput profiling of TPE-PS, thereby allowing the comprehensive analysis of the PS efficacy in vitro.Conflicts of interest
There are no conflicts to declare.Acknowledgements
The authors thank Dr Severin Muehleder and Prof Wolfgang Holnthoner (Ludwig-Boltzmann-Institute for Experimental and Clinical Traumatology, Vienna, Austria) for providing the cells, and Prof. Liska (Institute of Applied Synthetic Chemistry, TU Wien) for providing P2CK. Funding from TU Biointerfaces Doctorate College is gratefully acknowledged. JVH holds an FWO-SB PhD grant (1S44016N) issued by the Research Foundation Flanders (FWO Vlaanderen).Notes and references
- Z. Zhang, W. Huang, M. Lei, Y. He, M. Yan, X. Zhang and C. Zhao, Int. J. Pharm., 2016, 498, 1–11 CrossRef CAS.
- S. Sharma, G. C. Brown and M. M. Brown, Ophthalmology, 6420, 2051–2059 Search PubMed.
- M. R. Hamblin and T. Hasan, Photochem. Photobiol. Sci., 2004, 3, 436 RSC.
- D. E. Dolmans, D. Fukumura and R. K. Jain, Nat. Rev. Cancer, 2003, 3, 380–387 CrossRef CAS PubMed.
- T. J. Dougherty, C. J. Gomer, B. W. Henderson, G. Jori, D. Kessel, M. Korbelik, J. Moan and Q. Peng, J. Natl. Cancer Inst., 1998, 90, 40–45 CrossRef.
- Y. Zheng, G. Yin, V. Le, A. Zhang, S. Chen, X. Liang and J. Liu, Int. J. Biol. Sci., 2016, 12, 120–132 CrossRef CAS PubMed.
- J. Moan, J. Photochem. Photobiol., B, 1990, 6, 343–347 CrossRef CAS.
- J. S. Dysart and M. S. Patterson, Phys. Med. Biol., 2005, 50, 2597–2616 CrossRef CAS PubMed.
- S. B. Brown, E. A. Brown and I. Walker, Lancet Oncol., 2004, 5, 497–508 CrossRef CAS.
- C. Ash, M. Dubec, K. Donne and T. Bashford, Lasers Med. Sci., 2017, 32, 1909–1918 CrossRef PubMed.
- Z. Sun, L.-P. Zhang, F. Wu and Y. Zhao, Adv. Funct. Mater., 2017, 27, 1704079 CrossRef.
- J. D. Bhawalkar, G. S. He and P. N. Prasad, Rep. Prog. Phys., 1996, 59, 1041–1070 CrossRef CAS.
- C. Fowley, N. Nomikou, A. P. McHale, B. McCaughan and J. F. Callan, Chem. Commun., 2013, 49, 8934–8936 RSC.
- F. Bolze, S. Jenni, A. Sour and V. Heitz, Chem. Commun., 2017, 53, 12857–12877 RSC.
- Y. Shen, A. J. Shuhendler, D. Ye, J.-J. Xu and H.-Y. Chen, Chem. Soc. Rev., 2016, 45, 6725–6741 RSC.
- E. Wachter, D. K. Heidary, B. S. Howerton, S. Parkin and E. C. Glazer, Chem. Commun., 2012, 48, 9649–9651 RSC.
- K. Ogawa and Y. Kobuke, BioMed Res. Int., 2013, 2013, 125658 Search PubMed.
- M. Lan, S. Zhao, Y. Xie, J. Zhao, L. Guo, G. Niu, Y. Li, H. Sun, H. Zhang, W. Liu, J. Zhang, P. Wang and W. Zhang, ACS Appl. Mater. Interfaces, 2017, 9, 14590–14595 CrossRef CAS PubMed.
- Y. Zhao, W. Wang, F. Wu, Y. Zhou, N. Huang, Y. Gu, Q. Zou and W. Yang, Org. Biomol. Chem., 2011, 9, 4168–4175 RSC.
- J. Schmitt, V. Heitz, A. Sour, F. Bolze, H. Ftouni, J.-F. Nicoud, L. Flamigni and B. Ventura, Angew. Chem., Int. Ed., 2015, 54, 169–173 CrossRef CAS PubMed.
- H. A. Collins, M. Khurana, E. H. Moriyama, A. Mariampillai, E. Dahlstedt, M. Balaz, M. K. Kuimova, M. Drobizhev, V. X. D. Yang, D. Phillips, A. Rebane, B. C. Wilson and H. L. Anderson, Nat. Photonics, 2008, 2, 420–424 CrossRef CAS.
- M. Khurana, H. A. Collins, A. Karotki, H. L. Anderson, D. T. Cramb and B. C. Wilson, Photochem. Photobiol., 2007, 83, 1441–1448 CrossRef CAS PubMed.
- B. Gu, W. Wu, G. Xu, G. Feng, F. Yin, P. H. J. Chong, J. Qu, K.-T. Yong and B. Liu, Adv. Mater., 2017, 29, 1701076 CrossRef PubMed.
- H. Abrahamse and M. R. Hamblin, Biochem. J., 2016, 473, 347–364 CrossRef CAS PubMed.
- J. R. Starkey, A. K. Rebane, M. A. Drobizhev, F. Meng, A. Gong, A. Elliott, K. McInnerney and C. W. Spangler, Clin. Cancer Res., 2008, 14, 6564–6573 CrossRef CAS.
- Y. Imamura, T. Mujohara, Y. Shimono, Y. Funakoshi, N. Chayahara, M. Toyoda, N. Kiyota, S. Takao, S. Kono, T. Nakatsura and H. Minami, Oncol. Rep., 2015, 33, 1837–1843 CrossRef CAS PubMed.
- A. G. Souza, I. B. B. Silva, E. Campos-Fernandez, L. S. Barcelos, J. B. Souza, K. Marangoni, L. R. Goulart and V. Alonso-Goulart, Curr. Pharm. Des., 2018, 24, 1689–1694 CrossRef CAS.
- Y. Yang, X. Yang, J. Zou, C. Jia, Y. Hu, H. Du and H. Wang, Lab Chip, 2015, 15, 735–744 RSC.
- Y.-C. Chen, X. Lou, Z. Zhang, P. Ingram and E. Yoon, Sci. Rep., 2015, 5, 12175 CrossRef.
- J. Moan, Photochem. Photobiol., 1986, 43, 681–690 CrossRef CAS PubMed.
- K. Marinic, D. Manoil, A. Filieri, J. C. Wataha, J. Schrenzel, N. Lange and S. Bouillaguet, Photodiagn. Photodyn. Ther., 2015, 12, 393–400 CrossRef CAS PubMed.
- M. Farsari, G. Filippidis, K. Sambani, T. S. Drakakis and C. Fotakis, J. Photochem. Photobiol., A, 2006, 181, 132–135 CrossRef CAS.
- C. A. Deforest and K. S. Anseth, Nat. Chem., 2011, 3, 925–931 CrossRef CAS PubMed.
- M. Tromayer, A. Dobos, P. Gruber, A. Ajami, R. Dedic, A. Ovsianikov and R. Liska, Polym. Chem., 2018, 9, 3108–3117 RSC.
- A. Ovsianikov, S. Mühleder, J. Torgersen, Z. Li, X. H. Qin, S. Van Vlierberghe, P. Dubruel, W. Holnthoner, H. Redl, R. Liska and J. Stampfl, Langmuir, 2014, 30, 3787–3794 CrossRef CAS PubMed.
- M. Lunzer, L. Shi, O. G. Andriotis, P. Gruber, M. Markovic, P. J. Thurner, D. Ossipov, R. Liska and A. Ovsianikov, Angew. Chem., 2018, 130, 15342–15347 CrossRef.
- E. W. Van Stryland and M. Sheik-Bahae, Charact. Tech. Tabul. Org. Nonlinear Mater., 1998, 655–692 CAS.
- M. Sheik-Bahae, A. A. Said, T.-H. Wei, D. J. Hagan and E. W. Van Stryland, IEEE J. Quantum Electron., 1990, 26, 760–769 CrossRef CAS.
- W. Steiger, P. Gruber, D. Theiner, A. Dobos, M. Lunzer, J. Van Hoorick, S. Van Vlierberghe, R. Liska and A. Ovsianikov, Fully automated z-scan setup based on a tunable fs-oscillator, 2019 Search PubMed , submitted.
- A. Gnoli, L. Razzari and M. Righini, Opt. Express, 2005, 13, 7976–7981 CrossRef CAS.
- B. Zhang, J. Zerubia and J.-C. Olivo-Marin, Appl. Opt., 2007, 46, 1819 CrossRef.
- W. R. Zipfel, R. M. Williams and W. W. Webb, Nat. Biotechnol., 2003, 21, 1369–1377 CrossRef CAS PubMed.
- L. Knezevic, M. Schaupper, S. Mühleder, K. Schimek, T. Hasenberg, U. Marx, E. Priglinger, H. Redl and W. Holnthoner, Front. Bioeng. Biotechnol., 2017, 5, 25 Search PubMed.
- J. Van Hoorick, P. Gruber, M. Markovic, M. Rollot, G. Graulus, M. Vagenende, M. Tromayer, J. Van Erps, H. Thienpont, J. C. Martins, S. Baudis, A. Ovsianikov, P. Dubruel and S. Van Vlierberghe, Macromol. Rapid Commun., 2018, 1800181, 1–7 Search PubMed.
- A. Gnoli, L. Razzari and M. Righini, Opt. Express, 2005, 13, 7976–7981 CrossRef CAS.
- M. Göppert-Mayer, Ann. Phys., 1931, 401, 273–294 CrossRef.
- W. Kaiser and C. G. B. Garrett, Phys. Rev. Lett., 1961, 7, 229–231 CrossRef CAS.
Footnote |
| † Electronic supplementary information (ESI) available. See DOI: 10.1039/c9an00068b |
| This journal is © The Royal Society of Chemistry 2019 |

