 Open Access Article
Rapid and simple detection of ascorbic acid and alkaline phosphatase via controlled generation of silver nanoparticles and selective recognition†
Piaopiao
Chen
a,
Shixin
Yan
a,
Erica
Sawyer
a,
Binwu
Ying
a,
Xiawei
Wei
a,
Zhengzhi
Wu
*bcd and
Jia
Geng
 *a
*a
aDepartment of Laboratory Medicine, State Key Laboratory of Biotherapy, West China Hospital, Sichuan University and Collaborative Innovation Center for Biotherapy, Chengdu, Sichuan 610041, China. E-mail: geng.jia@scu.edu.cn
bThe First Affiliated Hospital of Shenzhen University, Shenzhen, 518035, China
cThe Eighth Affiliated Hospital of Sun Yat-sen University, Shenzhen, 518033, China
dShenzhen Institute of Geriatrics, Shenzhen, 518020, China. E-mail: szwzz001@email.szu.edu.cn
First published on 10th December 2018
Abstract
Ascorbic acid (AA) and alkaline phosphatase (ALP) serve as an important coenzyme and enzyme in multiple biological metabolism reactions, respectively, and abnormal levels of these substrates have been associated with several diseases. Herein, a new and simple fluorescence strategy has been developed for AA and ALP sensing by exploiting CdTe quantum dots (QDs) as an effective signal indicator. This method is mainly based on the selective fluorescence-quenching reaction between Ag+ and CdTe QDs, as opposed to silver nanoparticles (Ag NPs); Ag+ can be reduced to Ag NPs by AA. Furthermore, by taking advantage of AA as a mediator, this strategy is further exploited for ALP assay given that ALP can cause the hydrolysis of L-ascorbic acid-2-phosphate (AAP), which yields AA. Under optimal conditions, controlled generation of Ag NPs and the selective recognition-based sensing system exhibit high sensitivity toward AA and ALP with limits of detection (LODs) of 3 μM and 0.25 U L−1 and linear ranges of detection from 0 to 800 μM and 1 to 1000 U L−1, respectively. Moreover, the sensor was successfully used for assaying AA in fruit juice and ALP in human serum. The results demonstrate that the proposed fluorescence strategy has significant advantages, such as its simplicity, cost-effectiveness, and rapid runtime, and the operational convenience of this label-free method further demonstrates its potential for constructing effective sensors with biochemical and clinical applications.
1. Introduction
Monitoring the concentrations of reactive small molecules and enzymes is critical to explore their biological functions and their impact on living organisms, and assist in the diagnosis of related diseases. Among them, ascorbic acid is a key reactive biological molecule that has many roles: as an antioxidant protects against oxidative damage, it functions as an enzyme cofactor, etc.1,2 Alkaline phosphatase can cause dephosphorylation reaction for small molecules and proteins.3,4 Development of a simple and efficient strategy for assaying AA and ALP levels has become a critical subject of current chemical research. In the past few decades, several approaches have been used for AA and ALP detection, such as fluorescence,5 colorimetric,6 electrochemical,7 magnetic relaxation switching (MRS),8 surface-enhanced Raman scattering (SERS),9 and so on. Among these methods, the fluorescence strategy has significant advantages due to its ease of use, high sensitivity, rapid analysis, and good reproducibility. Consequently, it has received extensive attention. To date, many fluorescence methods were developed for AA and ALP detection using materials, such as carbon dots (CDs),10 cerium metal–organic frameworks (MOFs),11 gold nanoclusters (Au NCs),12 quantum dots (QDs),13 DNA-templated silver nanoclusters (Ag NCs),14 poly(thymine)-templated copper nanoclusters (Cu NCs),15 MnO2 nanosheets,16etc.Semiconductor QDs exhibit unique properties, e.g., width, symmetry, size-tunable emission spectra, broad absorption spectra, long photoluminescence lifetimes, and significant photo-stability, which allow for fascinating applications in sensing, bioimaging, etc.17,18 Additionally, cation exchange reactions have led to the development of a series of research methods for quantitative assays,19 which can be used to analyze the characteristics of nucleic acids,20 proteins,21 single-nucleotide polymorphisms (SNPs),22 and other substrates. These reaction conditions are mild, and strong acids and complex steps were not involved.23,24 Subsequently, researchers discovered that CdTe QDs can selectively distinguish Ag+ from Ag NPs. Various detection methods have been developed based on this phenomenon.25 However, the selective recognition reaction of CdTe QDs has not been used for assaying AA and ALP.
In this study, by combining the reduction reaction-mediated formation of Ag NPs and the selective recognition reaction between Ag+ and CdTe QDs, a novel and simple sensor was designed for the highly sensitive assay of AA and ALP. AA can reduce Ag+ to form Ag NPs, inhibiting the occurrence of a fluorescence quenching reaction, leading to the high fluorescence intensity of CdTe QDs. Therefore, the detection of AA was achieved using a fluorescence turn-on mode strategy. Furthermore, ALP enables the removal of PO43− from L-ascorbic acid-2-phosphate, which does not act as a reducing agent, and yields AA, which can then reduce Ag+ to Ag NPs. Therefore, with AAP as a bridge, assay of ALP was successfully realized (as shown in Scheme 1). Subsequently, this sensing strategy was used for the analysis of AA (fruit juice) and ALP (human serum) in real samples, and satisfactory results were achieved. The proposed strategy of AA and ALP activity possesses advantages such as its ease of use, cost-effectiveness, convenience, and sensitivity.
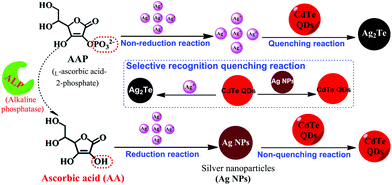 | ||
| Scheme 1 Schematic illustration of the fluorescence AA and ALP assay based on the controlled generation of silver nanoparticles and selective quenching reaction. | ||
2. Experimental
2.1 Materials and instruments
Silver nitrate (AgNO3), glycine (Gly), glucose, ascorbic acid (AA), L-ascorbic acid 2-phosphate trisodium salt (AAP), alkaline phosphatase (ALP), human serum albumin (HSA), transferrin, trypsin, pepsin, papain, and thrombin were purchased from Sigma-Aldrich (St Louis, MO, USA). High purity NaNO3, Mg(NO3)2, HCl, NaOH, CdCl2, KBH4, and trisodium citrate were obtained from Kelong Reagent Factory (Chengdu, China). 3-[N-Morpholino] propanesulfonic acid (MOPS) was ordered from Solarbio Technology Co., Ltd (Beijing, China). Na2TeO3 and 3-mercaptopropionic acid (MPA) were obtained from Aladdin Reagent Co., Ltd (Shanghai, China). A MOPS buffer solution (10 mM, pH 7.0, 100 mM NaNO3, 2.5 mM Mg(NO3)2) was used in this work. High purity deionized water (18.2 MΩ cm, Chengdu Pure Technology Co., Chengdu, China) was used in this work. The commercial ALP kit was obtained from Roche Pharmaceuticals (Germany). Human serum samples were provided by the Department of Laboratory Medicine, West China Hospital of Sichuan University (Chengdu, China).The F-7100 spectrometer (Hitachi, Japan) was used to record the emission spectra and the signal of CdTe QDs at a 365 nm excitation wavelength. Absorption spectra of CdTe QDs were recorded on a Hitachi U-1750 UV-vis spectrophotometer (Shimadzu, Kyoto, Japan). High-resolution transmission electron microscopy (HR-TEM) measurements of CdTe QDs were carried out using a Tecnai G2F20 STWIN TEM at an accelerating voltage of 200 kV (FEI Co., USA).
2.2 Synthesis of CdTe QDs
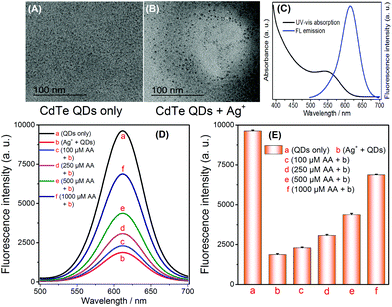
A one-pot synthetic method was adopted to obtain CdTe QDs with slight modifications.26 Firstly, a 50 mL solution containing CdCl2 (0.5 mmol) and trisodium citrate (0.2 g) was prepared. Then, MPA (52 μL) was instantly added into the above solution, and the solution pH was adjusted to 10.5 using NaOH. Later, Na2TeO3 (0.1 mmol) and KBH4 (50 mg) were added into the above solution, and then this solution mixture was refluxed for 1 h to obtain the CdTe QDs solution. Subsequently, high purity CdTe QDs were obtained via precipitation with n-propanol and centrifugation (11![[thin space (1/6-em)]](https://www.rsc.org/images/entities/char_2009.gif) 000 rpm). The purified CdTe QDs were redispersed in high purity water before use.27 The fluorescence and UV-vis absorption spectra were recorded (Fig. 1C). The MPA-CdTe QDs were kept at 4 °C.
000 rpm). The purified CdTe QDs were redispersed in high purity water before use.27 The fluorescence and UV-vis absorption spectra were recorded (Fig. 1C). The MPA-CdTe QDs were kept at 4 °C.
2.3 AA assay
As per the sensing assay of AA shown in Scheme 1, different concentrations of AA (50 μL) were mixed with Ag+ (50 μL, 5 μM) in 100 μL MOPS buffer in the dark at room temperature (RT) for 20 min to form silver nanoparticles (Ag NPs). The same reaction mixtures without the target AA were used as negative controls. Then, 10 μL CdTe QDs (a 10-fold dilution of the original CdTe QDs solution) was mixed with the above solution and further incubated in the dark for 10 min at RT. Finally, the resulting solution was diluted to 1 mL and fluorescence measurements were performed immediately. All of the measurements were performed at least three times.2.4 ALP assay
The sensitive fluorescence detection of ALP started with the addition of 50 μL AAP (1 mM) and 50 μL ALP (various concentrations), which were added into MOPS buffer (100 μL). Later, the above solution mixtures were incubated for 30 min at 37 °C. Then, Ag+ solution (5 μM, 50 μL) was added into the mixtures, which were further incubated in the dark at RT for 20 min to form Ag NPs. Then, 10 μL CdTe QDs (a 10-fold dilution of the original CdTe QDs solution) was added into the above solution and further maintained in the dark for 10 min at RT. Finally, the resulting solution was diluted to 1 mL and the fluorescence measurements (with excitation at 365 nm) were performed immediately. All of the measurements were performed at least three times.2.5 Real sample preparation
The fruit juice sample was diluted 100-fold with high purity water before analysis.Healthy human serums were prepared with a 50-fold dilution with high purity water, and then filtered using a 30 kDa ultrafiltration membrane to remove the interfering macromolecules and small molecules. The ultrafiltrates were spiked with ALP (1, 10, 100, and 1000 U L−1, final concentrations). For the ALP assay, the spiked diluted serum samples served as the standard solutions as described in the ALP assay procedure.
3. Results and discussion
3.1 Sensing principle
The principle of our proposed selective fluorescence quenching reaction-based strategy for AA and ALP sensing is illustrated in Scheme 1. Its mechanism is mainly based on Ag+ being reduced by AA to generate Ag NPs, and the ability of CdTe QDs to selectively differentiate Ag+ and Ag NPs. In the absence of the corresponding targets, Ag+ can effectively quench the fluorescence of CdTe QDs by a rapid cation exchange reaction and an obvious reduction in the fluorescence signal can be recorded. However, in the presence of the target AA, Ag NPs can be formed from Ag+via AA reduction. The CdTe QDs stay intact and have a strong fluorescence signal. Because the increasing degree of the fluorescence signal is proportional to the concentration of AA, target AA can be successfully detected through the fluorescence change of the CdTe QDs. Furthermore, by taking advantage of AA as a mediator, this sensing platform was extended to ALP detection due to the ability of ALP to catalyze the hydrolysis of AAP to yield AA. Therefore, the AA and ALP assay used a turn-on mode strategy, and the concentration of CdTe QDs was proportional to the amount of AA and ALP; this enabled the conversion of the target reaction events into a detectable signal of the CdTe QDs via a fluorescence spectrometer.3.2 The feasibility of the AA assay
In accordance with the principle shown in Scheme 1, the feasibility of AA sensing was investigated. The TEM images of the CdTe QDs and the products from the cation exchange reaction indicate that the spherical CdTe QDs (Fig. 1A) become Ag2Te aggregates (Fig. 1B), thus verifying the cation exchange reaction between CdTe QDs and Ag+. To further confirm the feasibility of this strategy, AA of different concentrations (100, 250, 500, 1000 μM) were added into the Ag+ solution. After the addition of CdTe QDs the selective quenching reaction was triggered, and the fluorescence signal changes were recorded. As shown in Fig. 1D and E, the fluorescence signal of CdTe QDs increased significantly when the concentration of AA increased (Fig. 1D-bvs.1D-c, d, e, f). The above results indicate that AA can reduce Ag+ and inhibit the quenching of CdTe QDs. Thus, the feasibility of this technique has been demonstrated for AA sensing while displaying its advantages, such as its simple operation and rapid response.3.3 Detection of AA
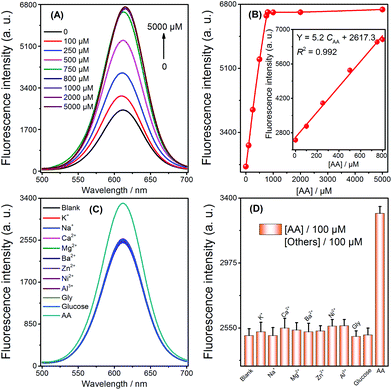
To ensure the strategy presented in this work for sensitive detection of AA, the sensing conditions were first optimized. An Ag+ volume of 50 μL (5 μM) (Fig. S1†), a 20 min duration of Ag NPs formation by AA reduction of Ag+ (Fig. S2†), and a 10 min duration for the selective quenching reaction (Fig. S3†) were finally adopted for subsequent experiments. Under the optimized conditions, when the concentration of AA increased, the fluorescence intensity also increased (Fig. 2A). Fig. 2B describes the relationship between the signal enhancement and the concentrations of AA; the inset of Fig. 2B shows a good linearity (R2 = 0.992) from 0 to 800 μM with a LOD of 3 μM (3σ, n = 11). The comparison of AA detection with other methods is summarized (Table 1). Although our method does not have the highest sensitivity, it has the advantages of simplicity in both design and operation, as well as its low cost. In addition, a series of eleven repetitive measurements of 100 μM AA were used for estimating the precision of this method, and the resulting RSD value was 2.9%.| Method | Linear range | LOD | Ref. |
|---|---|---|---|
| a Gold nanoclusters. b Gold nanoclusters and NIR PbS QDs. c Graphene quantum dots. d Cerium metal–organic framework (ZJU-136-Ce). e Cobalt oxyhydroxide nanoflake two-photon nanoparticles. f Upconversion nanoparticles. g Carbon dot-modified hexagonal cobalt oxyhydroxide nanoflakes. h Nitrogen-doped carbon nanoparticles. | |||
| Au NCsa | 5–100 μM | 5 μM | 28 |
| Au NCs–PbS-QDsb | 3–40 μM | 1.5 μM | 12 |
| GQDsc | 1–30 μM | 270 nM | 29 |
| MOFd | 0–80 μM | 7 nM | 11 |
| CoOOH-modified TPNPse | 1–20 μM | 170 nM | 30 |
| UCNPsf | 0.1–25 μM | 0.04 μM | 31 |
| CD-CoOOHg | 0.1–20 μM | 50 nM | 10 |
| N-CNPsh | 0.2–150 μM | 50 nM | 32 |
| CdTe QDs | 0–800 μM | 3 μM | This work |
Selectivity was investigated by challenging this fluorescence strategy with potential interferents, including abundant cations (K+, Na+, Ca2+, Mg2+, Ba2+, Zn2+, Ni2+, Al3+), glucose, and glycine (Gly). As shown in Fig. 2C and D, 100 μM AA resulted in the obvious enhancement of fluorescence. In contrast, no obvious change in fluorescence was monitored by adding 100 μM of the other analytes. Therefore, the high selectivity of the sensor could be attributed to the selective quenching reaction between Ag+/Ag NPs and CdTe QDs and the reduction ability of AA towards Ag+.
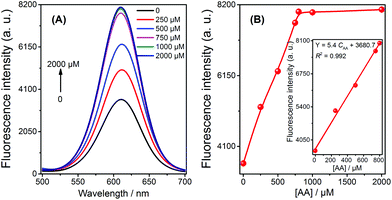
The application of the fluorescent sensor for AA detection in 1% fruit juice was evaluated using the spiked method, and the resulting fluorescence spectra and signals were recorded (shown in Fig. 3). It is observed that the signal of the solution increased with the increasing concentration of AA from 0.5 μM to 800 μM; a strong linear relationship was demonstrated in this range (Fig. 3B, inset). These results imply that the sensor is capable of being used to detect AA in real samples in a practical and efficient manner.
3.4 Assay of ALP
The results of the aforementioned experiments inspired the extension of applications for this method. Given that ALP can catalyze the hydrolysis of AAP to generate AA, this property enabled us to develop a novel strategy for assaying ALP via the selective quenching reaction. Before evaluating its analytical performance, the feasibility of the ALP fluorescence assay was verified. The fluorescence signal was obviously reduced after the addition of Ag+ into the CdTe QDs solution, which indicated that the quenching reaction had been initiated (Fig. 4A-avs. 4A-b). At the same time, no significant signal changes were observed when AAP was added to the above Ag+ + CdTe QDs solution (Fig. 4A-bvs. 4A-c). Later, when different concentrations of ALP were added into the blank solutions, the fluorescence signals of the solutions gradually increased (Fig. 4A-d and A-e); this indicated that AA had been successfully generated and Ag+ was reduced to Ag NPs. Overall, these results show that the strategy can be extended to the assay of ALP and the strategy outlined in Scheme 1 works well.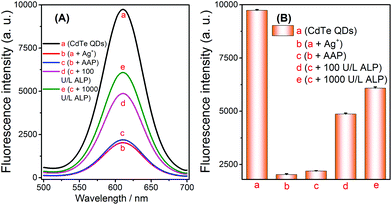 | ||
| Fig. 4 Feasibility of the alkaline phosphatase fluorescence assay based on the controlled generation of silver nanoparticles and the selective quenching reaction. | ||
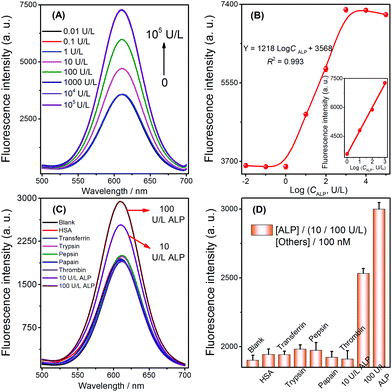
To test whether the strategy could be used for quantitative detection of target ALP, the fluorescence signals observed with various ALP concentrations were first measured to evaluate the sensitivity of the sensor under the previously optimized conditions (shown in Fig. S4, see the ESI†). The fluorescence signals of the biosensor increased with the increasing concentrations of ALP ranging from 1 to 1000 U L−1 (Fig. 5A). A calibration plot of ALP activity is shown in Fig. 5B (inset), and the correlation equation was Y = 1218![[thin space (1/6-em)]](https://www.rsc.org/images/entities/char_2009.gif) log
log![[thin space (1/6-em)]](https://www.rsc.org/images/entities/char_2009.gif) CALP + 3568 (C is the concentration of ALP, R2 = 0.993). The limit of detection can be reached at a low concentration of 0.25 U L−1, and the LOD of this ALP detection is comparable to that of other methods (Table 2). A series of eleven repetitive measurements of 100 U L−1 ALP were used for estimating the precision of this method, and the resulting RSD value was 3.6%.
CALP + 3568 (C is the concentration of ALP, R2 = 0.993). The limit of detection can be reached at a low concentration of 0.25 U L−1, and the LOD of this ALP detection is comparable to that of other methods (Table 2). A series of eleven repetitive measurements of 100 U L−1 ALP were used for estimating the precision of this method, and the resulting RSD value was 3.6%.
| Method | Linear range; LOD | Ref. |
|---|---|---|
| a Surface-enhanced Raman scattering. b Not mentioned. | ||
| Fluorescence (PolyT-Cu NPs) | 0–70 U L−1; 1 U L−1 | 15 |
| Fluorescence (silver nanoclusters) | 30–240 U L−1; 5 U L−1 | 33 |
| Colorimetric (Au NPs) | 0–6.8 μM; NMb | 6 |
| Colorimetric (Au/Ag core/shell nanorods) | 5–100 U L−1; 3.3 U L−1 | 34 |
| Electrochemical | 0.1–10 U L−1; 0.1 U L−1 | 35 |
| Photoelectrochemical | 0.5–40 U L−1; 0.33 U L−1 | 36 |
| Magnetic relaxation switching | 29.3–3750 U L−1; 0.42 U L−1 | 8 |
| SERSa | 0.72–3 U L−1; 0.01 U L−1 | 37 |
| Fluorescence (CdTe QDs) | 1–1000 U L−1; 0.25 U L−1 | This work |
The selectivity of the selective quenching reaction-based strategy was investigated using pepsin, papain, thrombin, trypsin, transferrin, and human serum albumin as interfering substances. A significant increase in fluorescence was only observed with the target ALP (10 and 100 U L−1); in contrast, there was no increase observed when using the other compounds, which were employed at comparatively higher concentrations (100 nM, Fig. 5C and D). These experimental results indicated that the simple turn-on method possessed high specificity for the ALP assay, which was mainly due to the highly specific catalytic hydrolysis of AAP by ALP.
To evaluate the general applicability of the sensor to clinical samples, this sensor was used in a complex sample matrix of human serum. It is noteworthy that the interference from Cu2+ can be eliminated in real samples by using an ultrafiltration membrane in sample pretreatment. A similar signal curve was observed when the sensor was introduced to 2% serum in comparison with the curve of the buffer solution, which was observed under the same experimental conditions (Fig. S5†). Furthermore, the designed CdTe QDs-based method was used to detect the concentrations and recoveries of ALP by spiking 50-fold dilutions of human serum samples with a series of known ALP concentrations. The experimental results of the two methods (our method and the commercial ALP kit colorimetric method) are comparable; moreover, satisfactory recoveries were obtained (96% to 100%, Table 3). Therefore, the above experimental results have demonstrated that this method has potential for practical sample analysis.
| Samples | ALP kit (U L−1) | This method (U L−1) | Added, U L−1 | Founda, U L−1 | Recoveryb, % |
|---|---|---|---|---|---|
| a Mean and standard deviation of results (n = 3). b Recovery (%) = (CFound/CAdded) × 100%. | |||||
| 1 | 65 | 60 | 100 | 158 ± 5 | 98 |
| 2 | 71 | 75 | 200 | 270 ± 15 | 97 |
| 3 | 97 | 100 | 300 | 388 ± 23 | 96 |
| 4 | 72 | 67 | 500 | 570 ± 15 | 100 |
| 5 | 88 | 83 | 750 | 830 ± 15 | 99 |
| 6 | 100 | 105 | 900 | 1000 ± 23 | 99 |
4. Conclusions
In summary, we have developed a simple and novel strategy for the detection of AA and ALP by exploiting CdTe QDs as an effective signal indicator. In the assay, the reduction reaction-mediated formation of Ag NPs and the selective quenching reaction between Ag+/Ag NPs and CdTe QDs were utilized. This method has the following advantages: (1) mild reaction conditions without any rigorous operation; (2) rapid response (completes in a few minutes); and (3) good analytical performance, and it has been successfully applied to real samples. Given these advantages, this simple, new strategy may hold great potential for further applications in biomedical research and disease diagnosis.Conflicts of interest
There are no conflicts to declare.Acknowledgements
This work was supported by the National Key Research and Development Program of China (2016YFA0201400 and 2016YFC1200300) and the National Natural Science Foundation of China (81574038).Notes and references
- Q. Chen, M. G. Espey, A. Y. Sun, C. Pooput, K. L. Kirk, M. C. Krishna, D. B. Khosh, J. Drisko and M. Levine, Proc. Natl. Acad. Sci. U. S. A., 2008, 105, 11105–11109 CrossRef CAS PubMed.
- R. Heller, F. Münscher-Paulig, R. Gräbner and U. Till, J. Biol. Chem., 1999, 274, 8254–8260 CrossRef CAS PubMed.
- J. R. Eastman and D. Bixler, Clin. Chem., 1977, 23, 1769–1770 CAS.
- S. G. Julien, N. Dubé, S. Hardy and M. L. Tremblay, Nat. Rev. Canacer, 2011, 11, 35–49 CrossRef CAS PubMed.
- M. C. Rong, L. P. Lin, X. H. Song, Y. R. Wang, Y. X. Zhong, J. W. Yan, Y. F. Feng, X. Y. Zeng and X. Chen, Biosens. Bioelectron., 2015, 68, 210–217 CrossRef CAS PubMed.
- Y. Choi, N. H. Ho and C. H. Tung, Angew. Chem., Int. Ed., 2007, 119, 721–723 CrossRef.
- H. Wang, G. Q. Pu, S. Devaramani, Y. F. Wang, Z. F. Yang, L. F. Li, X. F. Ma and X. Q. Lu, Anal. Chem., 2018, 90, 4871–4877 CrossRef CAS PubMed.
- M. L. Dong, W. S. Zheng, Y. P. Chen, B. Ran, Z. Y. Qian and X. Y. Jiang, Anal. Chem., 2018, 90, 2833–2838 CrossRef CAS PubMed.
- P. Muhammad, X. Y. Tu, J. Liu, Y. J. Wang and Z. Liu, ACS Appl. Mater. Interfaces, 2017, 9, 12082–12091 CrossRef CAS PubMed.
- L. B. Li, C. Wang, K. Y. Liu, Y. H. Wang, K. Liu and Y. Q. Lin, Anal. Chem., 2015, 87, 3404–3411 CrossRef CAS PubMed.
- D. Yue, D. Zhao, J. Zhang, L. Zhang, K. Jiang, X. Zhang, Y. J. Cui, Y. Yang, B. L. Chen and G. D. Qian, Chem. Commun., 2017, 53, 11221–11224 RSC.
- P. Zhao, K. Y. He, Y. T. Han, Z. Zhang, M. Z. Yu, H. H. Wang, Y. Huang, Z. Nie and S. Z. Yao, Anal. Chem., 2015, 87, 9998–10005 CrossRef CAS PubMed.
- L. Jia, J. P. Xu, D. Li, S. P. Pang, Y. Fang, Z. G. Song and J. Ji, Chem. Commun., 2010, 46, 7166–7168 RSC.
- X. Q. Liu, F. A. Wang, A. Niazov-Elkan, W. W. Guo and I. Willner, Nano Lett., 2012, 13, 309–314 Search PubMed.
- J. Sun, T. Hu, X. L. Xu, L. Wang and X. R. Yang, Nanoscale, 2016, 8, 16846–16850 RSC.
- T. Xiao, J. Sun, J. H. Zhao, S. Wang, G. Y. Liu and X. R. Yang, ACS Appl. Mater. Interfaces, 2018, 10, 6560–6569 CrossRef CAS PubMed.
- Y. F. Kong, J. Chen, H. W. Fang, G. Heath, Y. Wo, W. L. Wang, Y. X. Li, Y. Guo, S. D. Evans and S. Y. Chen, Chem. Mater., 2016, 28, 3041–3050 CrossRef CAS PubMed.
- J. Kim, M. J. Biondi, J. J. Feld and W. C. Chan, ACS Nano, 2016, 10, 4742–4753 CrossRef CAS PubMed.
- D. H. Son, S. M. Hughes, Y. D. Yin and A. P. Alivisatos, Science, 2004, 306, 1009–1012 CrossRef CAS PubMed.
- X. R. Zhang, H. X. Liu, R. J. Li, N. B. Zhang, Y. Xiong and S. Y. Niu, Chem. Commun., 2015, 51, 6952–6955 RSC.
- Z. Z. Lin, S. Z. Lv, K. Y. Zhang and D. P. Tang, J. Mater. Chem. B, 2017, 5, 826–833 RSC.
- X. R. Zhang, Y. Zhang, F. T. Chen, Y. Li and S. S. Zhang, Chem. Commun., 2016, 52, 13261–13264 RSC.
- J. S. Li, T. R. Zhang, J. P. Ge, Y. D. Yin and W. W. Zhong, Angew. Chem., Int. Ed., 2009, 121, 1616–1619 CrossRef.
- J. J. Yao, X. G. Han, S. Zeng and W. W. Zhong, Anal. Chem., 2012, 84, 1645–1652 CrossRef CAS PubMed.
- K. Huang, K. L. Xu, J. Tang, L. Yang, J. R. Zhou, X. D. Hou and C. B. Zheng, Anal. Chem., 2015, 87, 6584–6591 CrossRef CAS PubMed.
- Z. H. Sheng, H. Y. Han, X. F. Hu and C. Chi, Dalton Trans., 2010, 39, 7017–7020 RSC.
- W. W. Yu, L. H. Qu, W. Z. Guo and X. G. Peng, Chem. Mater., 2003, 15, 2854–2860 CrossRef CAS.
- L. Z. Hu, L. Deng, S. Alsaiari, D. Y. Zhang and N. M. Khashab, Anal. Chem., 2014, 86, 4989–4994 CrossRef CAS PubMed.
- L. L. Feng, Y. X. Wu, D. L. Zhang, X. X. Hu, J. Zhang, P. Wang, Z. L. Song, X. B. Zhang and W. H. Tan, Anal. Chem., 2017, 89, 4077–4084 CrossRef CAS PubMed.
- H. M. Meng, X. B. Zhang, C. Yang, H. L. Kuai, G. J. Mao, L. Gong, W. H. Zhang, S. L. Feng and J. B. Chang, Anal. Chem., 2016, 88, 6057–6063 CrossRef CAS PubMed.
- Q. Q. Wu, H. Y. Chen, A. J. Fang, X. Y. Wu, M. L. Liu, H. T. Li, Y. Y. Zhang and S. Z. Yao, ACS Sens., 2017, 2, 1805–1813 CrossRef CAS PubMed.
- X. H. Zhu, T. B. Zhao, Z. Nie, Y. Liu and S. Z. Yao, Anal. Chem., 2015, 87, 8524–8530 CrossRef CAS PubMed.
- J. L. Ma, B. C. Yin, X. Wu and B. C. Ye, Anal. Chem., 2016, 88, 9219–9225 CrossRef CAS PubMed.
- Z. Q. Gao, K. C. Deng, X. D. Wang, M. Miró and D. P. Tang, ACS Appl. Mater. Interfaces, 2014, 6, 18243–18250 CrossRef CAS PubMed.
- L. F. Zhang, T. Hou, H. Y. Li and F. Li, Analyst, 2015, 140, 4030–4036 RSC.
- N. Zhang, Y. F. Ruan, L. B. Zhang, W. W. Zhao, J. J. Xu and H. Y. Chen, Anal. Chem., 2018, 90, 2341–2347 CrossRef CAS PubMed.
- Y. Zeng, J. Q. Ren, S. K. Wang, J. M. Mai, B. Qu, Y. Zhang, A. G. Shen and J. M. Hu, ACS Appl. Mater. Interfaces, 2017, 9, 29547–29553 CrossRef CAS PubMed.
Footnote |
| † Electronic supplementary information (ESI) available. See DOI: 10.1039/c8an01925h |
| This journal is © The Royal Society of Chemistry 2019 |

