 Open Access Article
Shape-selective crystallisation of fluxional carbon cages†
Aisha N.
Bismillah
 ,
Jiri
Sturala‡
 ,
Brette M.
Chapin
,
Dmitry S.
Yufit
,
Brette M.
Chapin
,
Dmitry S.
Yufit
 ,
Paul
Hodgkinson
 and
Paul R.
McGonigal
 *
*
Department of Chemistry, Durham University, Lower Mountjoy, Stockton Road, Durham, DH13LE, UK. E-mail: paul.mcgonigal@durham.ac.uk
First published on 22nd October 2018
Abstract
Dynamic covalent rearrangements of fluxional carbon cages, such as bullvalenes and barbaralanes, impart ‘shapeshifting’ molecular properties. Here, a series of five barbaralanes each interconvert dynamically between two constitutional isomers in solution, but resolve to single isomers upon crystallisation. Unexpectedly, the minor solution-phase isomers are resolved in two instances. Through dynamic NMR, crystallographic and DFT analyses, we show that the isomer observed in the solid state is not a direct consequence of the equilibrium distribution in solution or any specific noncovalent interactions. Rather, the dynamic preferential crystallisation is dictated by differences in molecular size and shape.
Introduction
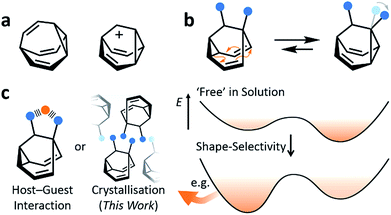
Fluxional carbon cages, such as bullvalene1 and the barbaralyl cation2 (Fig. 1a), undergo reversible pericyclic rearrangements on a grand scale.3 Sequential, low-energy steps interconvert large numbers of degenerate isomers. For example, bullvalene passes back and forth between 1.2 million degenerate valence isomers1 by strain-assisted Cope rearrangements. Functionalised derivatives, on the other hand, give rise (Fig. 1b) to nondegenerate valence isomers with distinct constitutions.4 When their C–C bonds trade places with one another, the positions and relative orientations of their substituents are altered, endowing them with dynamic shapes (Fig. 1c) and making them ideal building blocks for adaptive chemistry.5 Bode et al.6 have taken advantage of these phenomena to design shapeshifting bullvalene sensors—the equilibrium distribution of tetrasubstituted bullvalene isomers is shifted in a characteristic manner when interacting with different guests, either by specific noncovalent interactions6b or dynamic covalent bonds.6cHere, we report on the influence of shape over the crystallisation of fluxional carbon cages. Neutral barbaralane derivatives, which equilibrate (Fig. 1b) between sets of two non-equivalent valence isomers7 in solution, are resolved to single valence isomers upon crystallisation. By analysing NMR spectra of solutions and powdered samples, X-ray crystal structures and DFT models, we observe that (i) the dynamic isomerism is ‘frozen’ in the solid state and (ii) relatively small differences in the substituents dictate which constitutional isomer is found upon crystallisation. Three of the compounds crystallise as the major solution-phase valence isomers, i.e., their molecular structures in the solid state match those of the thermodynamically favoured species in solution. However, two compounds crystallise (Fig. 1c) as the minor solution-phase valence isomers, achieving more densely packed crystals by adopting molecular structures that fit together more effectively. Size- and shape-matching of these fluxional molecules to their surroundings outweigh the inherent energetic preference of the shapeshifting equilibrium.
Results and discussion
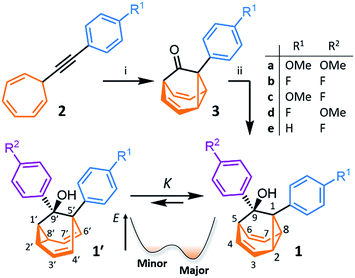
We synthesised (Scheme 1) fluxional mixtures of nondegenerate barbaralanes 1/1′ in two steps from alkynyl cycloheptatriene precursors 2 (for experimental details see the ESI†). Gold-catalysed cycloisomerisation of 2 proceeds2c through barbaralyl cation intermediates, which are oxidised2din situ by Ph2SO to afford barbaralones 3 in 58–75% yields. Subsequent addition of arylmagnesium bromides to 3 gives barbaralanes 1/1′, each bearing a tertiary alcohol§ and two aromatic rings. The aromatic ring at the 1/5′-position of each barbaralane breaks the symmetry of the Cope rearrangements, giving rise to the pairs of valence isomers 1 and 1′. We reasoned that these pairs of nondegenerate valence isomers would be useful compounds for probing the shapeshifting properties of fluxional carbon cages. Compared to the huge numbers of valence isomers accessible to other systems, analysis of the double-well-type potential energy surface (Scheme 1) of 1/1′ is more tractable. At the same time, the rearrangement still modulates the molecular shape to some extent—the strain present in the tricyclic cores of 1 and 1′ is slightly different, regulating the relative orientations of the two aromatic rings. Five sets of barbaralanes (1a–e/1a′–e′) were prepared in which the groups at the p-positions of the aromatic rings (R1 and R2) are varied between OMe, F, and H.Isomers 1 and 1′ are in fast exchange (Fig. S15–S48†) when observed by solution-phase NMR spectroscopy. Consequently, each pair of exchangeable sites gives rise to one peak. The chemical shift of each peak represents an average of the two discrete chemical environments, weighted by the position of the equilibrium, which enables us to identify the major isomer. For example, the 13C peak associated with position 2 of 1a and position 4′ of 1a′ appears (Fig. S16†) at 49.6 ppm in CDCl3 at 298 K, which is closer to the resonance of a divinyl cyclopropane group8 (∼25 ppm) than that of a cis-dialkylolefin group9 (∼135 ppm). This observation allows us to assign 1a as the major isomer10 and to estimate an equilibrium constant, K, of ∼3.5, as well as a Gibbs free energy difference, ΔG, of ∼3 kJ mol−1. These conclusions are supported by DFT modelling, which predicts (Table S5†) that 1a is lower in energy than 1a′ by a margin of ∼5 kJ mol−1 (for calculation details see the ESI†). Further NMR and DFT analyses reveal (Fig. S17–S48 and Table S5†) that K is only minimally affected by varying the R1 and R2 groups at the p-positions of the aromatic rings. The substituents are sufficiently remote from the barbaralane core that their electronic and steric differences have little impact – structure 1 remains the thermodynamically favoured solution-phase valence isomer for all derivatives (1a–e). In order to probe the equilibria further, we also recorded solution-phase 1H NMR spectra of bis(4-anisyl)barbaralane 1a/1a′ (Fig. S29†) and bis(4-fluorophenyl)barbaralane 1b/1b′ (Fig. 2) at low temperatures. The temperature-dependent spectroscopic changes are consistent with the behaviour of two nondegenerate valence isomers interconverting rapidly through a low-lying transition state. For example, the signal for the 8/6′ positions of 1b/1b′ shifts (Fig. 2) from 3.55 ppm at 292 K to 3.31 ppm at 165 K, moving further towards the chemical shift expected for a cyclopropyl resonance, while the signal associated with 6/8′ moves towards the olefinic region, shifting from 5.50 ppm at 292 K to 5.60 ppm at 149 K. Therefore, the equilibrium shifts further in favour of the thermodynamically favoured isomer 1b at lower temperatures, which would be expected for a Boltzmann distribution of nondegenerate isomers.
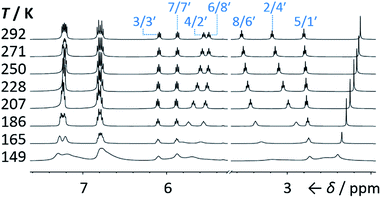 | ||
| Fig. 2 Partial 1H NMR spectra (500 MHz, CS2–CD2Cl2) of 1b/1b′. As the temperature is decreased, the equilibrium shifts towards the lower-energy isomer 1b. At temperatures below 186 K, the broadening of peaks indicates the reversible Cope rearrangement is entering the slow-exchange regime. Selected resonances are labelled according to the numbering in Scheme 1. | ||
All five 1/1′ derivatives form crystalline solids, allowing us to analyse (Fig. 3) their solid-state structures by single-crystal X-ray diffraction.† The fluxional mixtures of 1/1′ undergo dynamic preferential crystallisation,11i.e., just one valence isomer from each pair of fluxional carbon cages crystallises from the mixture.12,13 The bis(4-anisyl)barbaralane crystallises (Fig. 3a) as the major solution-phase valence isomer 1a. Similarly, the barbaralanes bearing one 4-fluorophenyl group and one 4-anisyl group each adopt the major solution-phase structures 1c and 1d upon crystallisation. Surprisingly, however, we observed the more strained molecular structures in crystals of the bis(4-fluorophenyl)barbaralane 1b′ and its phenyl analogue 1e′. While the p-substituents have little influence over the solution-state valence isomerism of the five 1/1′ derivatives, it appears that a subtle change at a position distant from the barbaralane core, such as switching out the OMe group of 1c/1c′ for a F atom (i.e., giving 1b/1b′), is sufficient to bias crystallisation in favour of another valence isomer.¶
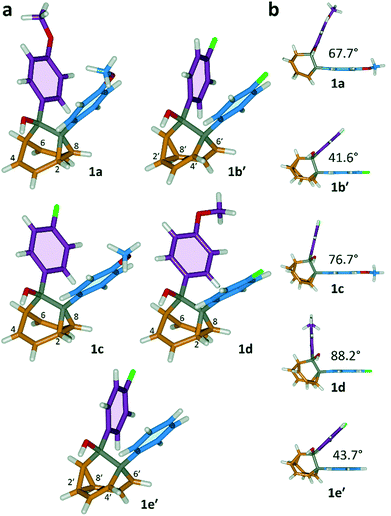 | ||
| Fig. 3 X-ray crystal structures of 1/1′ shown in stick representations.† (a) Whereas the major solution-phase valence isomers are obtained in some cases (1a, 1c and 1d), the minor solution-phase isomers crystallise preferentially in others (1b′ and 1e′). (b) Side-on views show the variation in dihedral angles between the planes of the aromatic rings. Selected interatomic distances at 120 K (Å): 1a, C2–C8 1.592(2), C4⋯C6 2.359(2); 1b′, C2′–C8′ 1.592(3), C4′⋯C6′ 2.353(2); 1c, C2–C8 1.582(2), C4⋯C6 2.364(2); 1d, C2–C8 1.586(2), C4⋯C6 2.367(2); 1e′, C2′–C8′ 1.591(2), C4′⋯C6′ 2.345(2). Oxygen atoms are shown in red, fluorine atoms are green, hydrogen atoms are white, and carbon atoms are blue, purple, orange or grey. | ||
Although some fluxional carbon cages14 are known to become ‘fixed’ structures upon crystallisation, others15 remain fluxional. Variable-temperature X-ray diffraction (VT-XRD) measurements performed on single crystals of 1a and 1b′ show (Fig. S42 and S43†) negligible changes in C–C distances of bonds involved in Cope rearrangement. For example, the C2–C8 bond length of 1a only changes from 1.592 Å at 120 K to 1.604 Å at 370 K. The identities of 1 and 1′ isomers in the solid state can also be distinguished by comparing (Fig. 4) their low-temperature solution and ambient-temperature solid-state 13C NMR spectra. At 149 K, the solution-phase equilibria are biased heavily towards 1a and 1b, so both solution-phase spectra show (Fig. 4a,d) similar patterns of peaks in their alkyl regions. Unlike the solid-state NMR (ssNMR) spectrum of the bis(4-anisyl)barbaralane (Fig. 4b), which matches closely with its solution spectra (in keeping with its assignment by X-ray diffraction as structure 1a), the ssNMR spectrum (Fig. 4c) of the bis(4-fluorophenyl)barbaralane is markedly different. The ssNMR spectrum indicates structure 1b′ is favoured over 1b. Hence, the ssNMR and VT-XRD data are both consistent with the barbaralanes 1/1′ having fixed constitutions in the solid state.
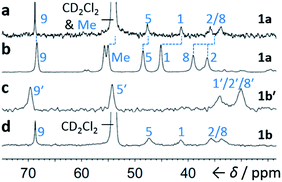 | ||
| Fig. 4 Comparison of partial 13C NMR spectra of 1a/1a′ and 1b/1b′ acquired (a and d) as CS2–CD2Cl2 solutions at low temperature (126 MHz, 149 K), and (b and c) as powders at ambient temperature (105 MHz). Peaks are labelled according to the numbering in Scheme 1. | ||
The barbaralane cage acts as a hinge between its two aromatic substituents, giving (Fig. 3b) the molecules V-shaped structures. Notably, the dihedral angles between the planes of these aromatic rings in the solid state vary substantially between the different derivatives. Compounds 1a, 1c, and 1d have relatively wide dihedral angles > 67°, whereas the dihedral angles of 1b′ and 1e′ are both <44°.|| Inspection (Fig. 5 and S57–S61†) of the solid-state superstructures reveals that these changes in dihedral angles are linked to differences in the crystal packing. Indeed, the packing is dominated by the way in which the V-shaped units fit together, rather than any specific noncovalent interactions. Compounds 1a, 1c, and 1d pack with a preference to arrange their V-shaped structures head-to-tail, while 1b′ and 1e′ are arranged head-to-head, allowing their aromatic groups to interdigitate. We attribute changes between these two modes of packing primarily to differences in the sizes of the R1 and R2 groups. A 4-anisyl group is too large to allow efficient interdigitation, so the head-to-tail arrangement is favoured in which the aromatic rings are splayed around a neighbouring barbaralane. This geometry is most easily accommodated by the 1-isomer form. Conversely, 1b′ and 1e′ lack 4-anisyl groups, so they are able to achieve more densely packed lattices than the other derivatives (1.39–1.44 vs. 1.33–1.35 g cm−3) by adopting head-to-head arrangements. The 4-fluorophenyl and phenyl groups are small enough for the aromatic rings to pack together efficiently, favouring smaller dihedral angles that are more accessible when the barbaralane adapts to the slightly higher energy 1′-isomer. Although there is more strain in the molecular structure, the relatively small (∼5 kJ mol−1) energy penalty to adopt the structure of the minor solution-state isomer must be overridden by a more favourable lattice energy, making the 1′-isomer favoured in the solid state.16
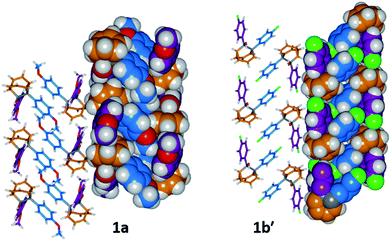 | ||
| Fig. 5 Solid-state superstructures of 1a and 1b′ shown in partial stick and space-filling representations and viewed along the crystallographic b-axes. The superstructures of 1c and 1d (Fig. S59 and S60†) are similar to 1a, whereas the superstructure of 1e′ (Fig. S61†) is isostructural with 1b′. Calculated densities (g cm−3): 1a, 1.33; 1b′, 1.44; 1c, 1.35; 1d, 1.35; 1e′, 1.39. | ||
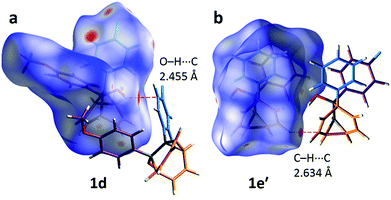
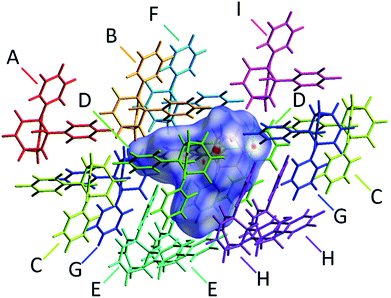
The alcohol function (which might normally be expected to dictate17 the packing) is overcrowded and electrostatic potential maps show (Fig. S66†) that the aromatic rings are only mildly polarised. In order to search for noncovalent bonding interactions, we calculated the Hirshfeld surfaces18 of each crystal structure. The Hirshfeld surfaces show (Fig. S67–S72†) that no interatomic distances are significantly closer than the sum of the respective van der Waals radii. For example, the most prominent close contacts present (Fig. 6) in 1d and 1e′ are weak O–H⋯C and C–H⋯C interactions, which each remain within ∼0.2 Å of the sum of the van der Waals radii.19 We confirmed this lack of significant, specific noncovalent bonding interactions by performing DFT modelling (CE-B3LYP**) of all the intermolecular interactions in the solid state. These calculations allow us to elucidate the total interaction energies (Etot) between neighbouring molecules based on the individual energetic components of electrostatics (Eele), polarisation (Epol), dispersion forces (Edis) and repulsion (Erep).20 For example, we examined (Fig. 7) a cluster of 14 neighbouring molecules surrounding a central molecule in the structure of 1e′. The 14 neighbours account for all of the molecules that come within 3.8 Å of the central molecule. As would be expected, the pairs of 1e′ molecules that are closest, having the smallest centroid-to-centroid distances (R), generally interact most strongly with one another. Molecules in position D and F are separated (Table 1) from the central molecule by R < 7 Å and have interaction energies of Etot = −31.1 and −43.5 kJ mol−1, respectively, which are the strongest pairings present in the structure. Dispersion forces account for the majority of their attractive intermolecular interactions, contributing energies of Edis = −46.8 kJ mol−1 for D and Edis = −51.4 kJ mol−1 for F. Overall, the modelling for the full series of five 1/1′ derivatives shows (Tables S10–S14†) that dispersion forces21 (which are influenced by the shape of the molecules and their packing) make up the major component of the interactions between molecules in all of the packing motifs, dominating the overall lattice energies in each case. This observation is consistent with our description of these molecules packing in the solid state in a manner that is influenced more by molecular shape than by any specific noncovalent bonding interactions.
| Neighbouring moleculea | R/Åb | Interaction energies/kJ mol−1 | ||||
|---|---|---|---|---|---|---|
| E ele | E pol | E dis | E rep | E tot | ||
| a The labels A–I correspond to those shown in Fig. 7 and refer to the nearby molecules in the solid state. b R is the centroid-to-centroid distance between the labelled molecule and the central molecule. Centroids are based on the coordinates of all atoms in each molecule and are not weighted by mass. c E tot is the scaled sum of the individual interaction energy components Eele, Epol, Edis and Erep. | ||||||
| A | 13.29 | 2.1 | −0.2 | −1.3 | 0.0 | 1.0 |
| B | 7.94 | −10.1 | −1.4 | −31.2 | 20.3 | −26.3 |
| C | 11.59 | −2.3 | −0.4 | −3.8 | 0.6 | −5.6 |
| D | 6.20 | −8.4 | −2.4 | −46.8 | 32.8 | −31.1 |
| E | 8.26 | −5.0 | −0.9 | −30.3 | 18.7 | −20.8 |
| F | 6.63 | −14.8 | −2.8 | −51.4 | 30.9 | −43.5 |
| G | 9.79 | −5.0 | −0.8 | −16.1 | 11.7 | −12.7 |
| H | 7.90 | −6.3 | −1.1 | −31.5 | 17.9 | −23.8 |
| I | 11.04 | 1.1 | −0.4 | −8.1 | 1.8 | −5.1 |
Conclusions
In summary, by investigating the dynamic isomerisation of nondegenerate barbaralanes, we have found that their crystallisation is directed by the shapes of their fluxional isomers. Either the major or the minor solution-phase isomer may be resolved as a result of their assembly in crystal lattices, becoming trapped in the solid state. At present, it has not been possible to discern precisely the shapes available to the most advanced shapeshifting sensors,6 which encompass hundreds of constitutional isomers and conformationally flexible substituents. Our observations, based on a bistable fluxional carbon cage with rigid substituents, illustrate that shape-selective interactions can override the inherent thermodynamic differences between even closely related valence isomers. Understanding the relationship between shape-selectivity and the energetics of fluxional carbon cages will aid the development of shapeshifting sensors and other applications of adaptive molecules.Conflicts of interest
There are no conflicts to declare.Acknowledgements
A. N. B. acknowledges an EPSRC DTG. J. S. acknowledges an Experientia Foundation Fellowship, Advanced Functional Nanorobots (CZ.02.1.01/0.0/0.0/15_003/0000444 financed by the EFRR), and computational resources from the MSMT under the CESNET (LM2015042) and CERIT-Scientific Cloud (LM2015085) projects. B. M. C. and P. R. M. thank the EPSRC for funding (EP/N029992/1). We thank Dr Mark Miller and Prof. Jon Steed for useful discussions. We are grateful to Dr David Apperley and Dr Raquel Belda-Vidal for assistance with NMR measurements.Notes and references
- (a) W. von E. Doering and W. R. Roth, Tetrahedron, 1963, 19, 715 CrossRef CAS; (b) G. Schröder, Angew. Chem., 1963, 75, 722 CrossRef; (c) A. Ault, J. Chem. Educ., 2001, 78, 924 CrossRef CAS; (d) O. Yahiaoui, L. F. Pašteka, B. Judeel and T. Fallon, Angew. Chem., Int. Ed., 2018, 57, 2570 CrossRef CAS PubMed.
- (a) P. Ahlberg, D. L. Harris and S. Winstein, J. Am. Chem. Soc., 1970, 92, 4454 CrossRef CAS; (b) D. Cremer, P. Svensson, E. Kraka and P. Ahlberg, J. Am. Chem. Soc., 1993, 115, 7445 CrossRef CAS; (c) P. R. McGonigal, C. de León, Y. H. Wang, A. Homs, C. R. Solorio-Alvarado and A. M. Echavarren, Angew. Chem., Int. Ed., 2012, 51, 13093 CrossRef CAS PubMed; (d) S. Ferrer and A. M. Echavarren, Angew. Chem., Int. Ed., 2016, 55, 11178 CrossRef CAS PubMed.
- S. Jalife, J. I.-C. Wu, G. Martínez-Guajardo, P. von Ragué Schleyer, M. A. Fernández-Herrera and G. Merino, Chem. Commun., 2015, 51, 5391 RSC.
- (a) D. J. Tantillo and R. Hoffmann, Acc. Chem. Res., 2006, 39, 477 CrossRef CAS PubMed; (b) J.-M. Lehn, Top. Curr. Chem., 2012, 322, 1 CAS.
- J.-M. Lehn, Angew. Chem., Int. Ed., 2015, 54, 3276 CrossRef CAS PubMed.
- (a) A. R. Lippert, A. Naganawa, V. L. Keleshian and J. W. Bode, J. Am. Chem. Soc., 2010, 132, 15790 CrossRef CAS PubMed; (b) K. K. Larson, M. He, J. F. Teichert, A. Naganawa and J. W. Bode, Chem. Sci., 2012, 3, 1825 RSC; (c) J. F. Teichert, D. Mazunin and J. W. Bode, J. Am. Chem. Soc., 2013, 135, 11314 CrossRef CAS PubMed.
- C. W. Jefford, J. C. Rossier and J. A. Zuber, Angew. Chem., Int. Ed. Engl., 1982, 21, 549 CrossRef.
- R. E. Moore, J. A. Pettus and J. Mistysyn, J. Org. Chem., 1974, 39, 2201 CrossRef CAS.
- E. Pretsch, P. Bühlmann and M. Badertscher, Structure Determination of Organic Compounds, Springer-Verlag, Berlin Heidelberg, 4th edn, 2009, p. 91 Search PubMed.
- Previous investigations have shown the preference of alkyl and aryl substituents to occupy a barbaralane 1-position over a 5-position. J. C. Barborak, S. Chari and P. von Ragué Schleyer, J. Am. Chem. Soc., 1971, 93, 5275 CrossRef CAS . See also ref. 2d..
- (a) R. O. Gould, C. L. Jones, T. A. Stephenson and D. A. Tocher, J. Organomet. Chem., 1984, 264, 365 CrossRef CAS; (b) J. L. Davidson, W. F. Wilson, L. Manojlović-Muir and K. W. Muir, J. Organomet. Chem., 1983, 254, C6–C10 CrossRef CAS; (c) K. M. J. Brands and A. J. Davies, Chem. Rev., 2006, 106, 2711 CrossRef CAS PubMed; (d) Y. Kitamoto, K. Suzuki, N. Morohashi, K. Sakai and T. Hattori, J. Org. Chem., 2013, 78, 597 CrossRef CAS PubMed; (e) M. Sakamoto and T. Mino, in Advances in Organic Crystal Chemistry: Comprehensive Reviews, ed. R. Tamura and M. Miyata, Springer, Tokyo, 1st edn, 2015, vol. 1, p. 445 Search PubMed.
- Some monosubstituted bullvalenes resolve to single isomers upon crystallisation (a) K. Müller, H. Zimmermann, C. Krieger, R. Poupko and Z. Luz, J. Am. Chem. Soc., 1996, 118, 8006 CrossRef; (b) R. Poupko, K. Müller, C. Krieger, H. Zimmermann and Z. Luz, J. Am. Chem. Soc., 1996, 118, 8015 CrossRef CAS; (c) Z. Luz, L. Olivier, R. Poupko, K. Müller, C. Krieger and H. Zimmermann, J. Am. Chem. Soc., 1998, 120, 5526 CrossRef CAS.
- There has been one report of a minor valence isomer crystallising from a solution of a bullvalene derivative. However, the assignment of the major species in the solution-phase equilibrium is somewhat ambiguous and it has not been possible to discern what forces control the crystallisation. P. Luger and K. Roth, J. Chem. Soc., Perkin Trans. 2, 1989, 649 RSC.
- (a) R. D. Miller and C. S. Yannoni, J. Am. Chem. Soc., 1980, 102, 7396 CrossRef CAS; (b) W. W. Win, K. G. Grohmann and L. Todaro, J. Org. Chem., 1994, 59, 2803 CrossRef CAS; (c) J. Siegwarth, J. Bornhöft, C. Näther and R. Herges, Org. Lett., 2009, 11, 3450 CrossRef CAS PubMed . See also articles cited in ref. 2d, 12 and 13..
- (a) V. Macho, R. D. Miller and C. S. Yannoni, J. Am. Chem. Soc., 1983, 105, 3735 CrossRef CAS; (b) I. Sellner, H. Schuster, H. Sichert, J. Sauer and H. Nöth, Chem. Ber., 1983, 116, 3751 CrossRef CAS; (c) L. M. Jackman, A. Benesi, A. Mayer, H. Quast, E. M. Peters, K. Peters and H. G. von Schnering, J. Am. Chem. Soc., 1989, 111, 1512 CrossRef CAS; (d) S. Schlick, Z. Luz, R. Poupko and H. Zimmermann, J. Am. Chem. Soc., 1992, 114, 4315 CrossRef CAS; (e) R. V. Williams, V. R. Gadgil, P. Luger, T. Koritsanszky and M. Weber, J. Org. Chem., 1999, 64, 1180 CrossRef CAS; (f) A. Benesi, R. Bertermann, H. Förster, M. Heubes, L. M. Jackman, T. Koritsanszky, P. Luger, A. Mayer, H. Quast, M. Seefelder and D. Zobel, J. Am. Chem. Soc., 2000, 122, 4455 CrossRef CAS.
- Differences in lattice energies of ∼5 kJ mol–1 between conformational polymorphs are relatively common. See (a) P. G. Thompson and G. M. Day, Chem. Sci., 2014, 5, 3173 RSC; (b) J. Nyman and G. M. Day, CrystEngComm, 2015, 17, 5154 RSC . Even though the isomerisation of the barbaralanes described here causes changes in constitution, rather than just conformation, the energetic differences are of similar magnitude to some conformational changes. It is reasonable, therefore, that the small energetic preference of the fluxional Cope rearrangements can be outweighed upon crystallisation..
- E. N. Baker and R. E. Hubbard, Prog. Biophys. Mol. Biol., 1984, 44, 97 CrossRef CAS PubMed.
- M. A. Spackman and D. Jayatilaka, CrystEngComm, 2009, 11, 19 RSC.
- R. S. Rowland and R. Taylor, J. Phys. Chem., 1996, 100, 7384 CrossRef CAS.
- M. J. Turner, S. Grabowsky, D. Jayatilaka and M. A. Spackman, J. Phys. Chem. Lett., 2014, 5, 4249 CrossRef CAS PubMed.
- J. P. Wagner and P. R. Schreiner, Angew. Chem., Int. Ed., 2015, 54, 12274 CrossRef CAS PubMed.
Footnotes |
| † Electronic supplementary information (ESI) available. CCDC 1857573–1857583, 1857874. For ESI and crystallographic data in CIF or other electronic format see DOI: 10.1039/c8sc04303e |
| ‡ Present address: Department of Inorganic Chemistry, University of Chemistry and Technology Prague, Technická 5, Prague 6 16628, Czech Republic. |
| § Barbaralanes 1/1′ were prepared and isolated as racemic mixtures. For simplicity, only one enantiomer of each compound is shown. |
| ¶ During our experiments, we did not observe any crystals of solvates or conformational polymorphs. The limited conformational freedom of 1/1′ and limited potential for hydrogen bonding suggest they are unlikely to be highly polymorphic. |
| || The differences in dihedral angles coincide with changes to the C1–C9/C5′–C9′ distances in the barbaralane core. The averaged C1–C9 distance for 1a, 1c, and 1d is 1.534 Å, whereas the averaged C5′–C9′ distance for 1b′ and 1e′ is 1.586 Å, showing that the movement of the divinylcyclopropane motif influences the geometries near the aromatic rings. |
| ** The CE-B3LYP functional was used instead of other DFT functionals, e.g., CAM-B3LYP or MN15-L, because its implementation in CrystalExplorer allows calculation of the individual interaction energy terms in addition to the total energy. It should be noted that CE-B3LYP is different to the original B3LYP functional, which is not suitable for calculation of weak interactions. It reproduces counterpoise-corrected B3LYP-D2/6-31G(d,p) energies with a mean absolute deviation of about 1 kJ mol−1 and gives a mean absolute deviation of just 2.5 kJ mol−1 compared to CCSD(T)/CBS while using much less computational time. See ref. 20. |
| This journal is © The Royal Society of Chemistry 2018 |

