 Open Access Article
Creative Commons Attribution 3.0 Unported Licence
Observation of a new type of aggregation-induced emission in nanoclusters†
Xi
Kang
 ,
Shuxin
Wang
 * and
Manzhou
Zhu
 *
*
Department of Chemistry, Center for Atomic Engineering of Advanced Materials, Anhui Province Key Laboratory of Chemistry for Inorganic/Organic Hybrid Functionalized Materials, Anhui University, Hefei, Anhui 230601, China. E-mail: ixing@ahu.edu.cn; zmz@ahu.edu.cn
First published on 19th February 2018
Abstract
The strategy of aggregation-induced emission (AIE) has been widely used to enhance the photo-luminescence (PL) in the nanocluster (NC) research field. Most of the previous reports on aggregation-induced enhancement of fluorescence in NCs are induced by the restriction of intramolecular motion (RIM). In this work, a novel mechanism involving the restriction of the “dissociation–aggregation pattern” of ligands is presented using a Ag29(BDT)12(TPP)4 NC (BDT: 1,3-benzenedithiol; TPP: triphenylphosphine) as a model. By the addition of TPP into an N,N-dimethylformamide solution of Ag29(BDT)12(TPP)4, the PL intensity of the Ag29(BDT)12(TPP)4 NC could be significantly enhanced (13 times, quantum yield from 0.9% to 11.7%) due to the restricted TPP dissociation–aggregation process. This novel mechanism is further validated by a low-temperature PL study. Different from the significant PL enhancement of the Ag29(BDT)12(TPP)4 NC, the non-dissociative Pt1Ag28(S-Adm)18(TPP)4 NC (S-Adm: 1-adamantanethiol) exhibits a maintained PL intensity under the same TPP-addition conditions. Overall, this work presents a new mechanism for largely enhancing the PL of NCs via modulating the dissociation of ligands on the NC surface, which is totally different from the previously reported AIE phenomena in the NC field.
1 Introduction
Noble metal nanoclusters (NCs) have attracted widespread attention due to their advantages of atomically precise structures, distinct physical/chemical properties, and extensive catalytic/biomedical applications.1–16 Among these interesting physical/chemical properties, photo-luminescence (PL) represents one of the most fascinating features owing to the low toxicity, good photostability, and high biocompatibility of NCs.1,2,8,17–24 Although several luminescent NCs have been reported,8,18,21–31 most of them exhibit lower quantum yields (QYs) compared with other fluorescent nanomaterials (such as lanthanide nanoparticles,32 organic dyes33 and quantum dots34), which severely impedes extensive application of fluorescent NCs in biological and sensing fields. Several strategies have been developed to enhance the PL QY of NCs, and they can be mainly classified into the following three categories: (1) tailoring the capping ligands of NCs (in terms of controlling the ligand to metal charge transfer (LMCT) process);8,35–37 (2) controlling the metal composition in the NC kernel;21,22,26,28,29,38 and (3) aggregation-induced emission (AIE) from non- or weakly luminescent metal NCs (or complexes).19,20,25,39,40 Nowadays, the AIE strategy is being expanded to the hydrocarbon, metal complex, metal NC, and macromolecular research fields.41 The corresponding AIEgens have been widely applied in biological probing, chemical sensing, and organic light-emitting diodes, to name a few.42 In the NC field, the AIE strategy could boost the PL QY through facile approaches (e.g., solvent- or cation-inducing approaches).19,25 Furthermore, the previously reported enhancements of fluorescence in NCs have mostly been achieved by the restriction of intramolecular motion (RIM, a general mechanism in AIE materials).19,25 This raises some interesting questions: are there any other patterns (other than RIM) of AIE that exist in the NC field? If so, how can we enhance the QY of fluorescent NCs with new patterns? Addressing these issues will not only develop a powerful and practical strategy for synthesizing more fluorescent NCs with enhanced PL QYs, but also promote wide-range application of AIE in the NC field.Herein, a novel AIE pattern (the restriction of the ligand dissociation–aggregation process) is discovered using a Ag29(BDT)12(TPP)4 NC (BDT, 1,3-benzenedithiol; TPP, triphenylphosphine) as a model. The PL intensity of the Ag29(BDT)12(TPP)4 NC in the solid or crystal state is significantly higher than that in the solution state. Considering the particularly close packing of Ag29(BDT)12(TPP)4 as well as the existence of π⋯π and C–H⋯π interactions between the ligands, the AIE process is unlikely caused by the RIM completely in the case of the Ag29(BDT)12(TPP)4 NC. Furthermore, electrospray ionization mass spectrometry (ESI-MS) and 31P nuclear magnetic resonance (31P NMR) analyses are performed on the Ag29(BDT)12(TPP)4 NC, and they reveal several dissociated ligands from Ag29(BDT)12(TPP)4; that is, the mechanism of AIE in Ag29(BDT)12(TPP)4 could be the restriction of the TPP dissociation–aggregation process. To prove the mechanism, different concentrations of TPP molecules are added to the dissociative Ag29(BDT)12(TPP)4 and non-dissociative Pt1Ag28(S-Adm)18(TPP)4 (S-Adm, 1-adamantanethiol) NC solution. Resultantly, the PL intensity of Ag29(BDT)12(TPP)4 is significantly enhanced (up to 13 times, with a PL QY from 0.9% to 11.7%) by the addition of TPP owing to the restriction of the TPP dissociation–aggregation process (or the chemical equilibrium shifting to TPP aggregation on the Ag29(BDT)12(TPP)x NCs, summarized in Scheme 1). By contrast, the non-dissociative Pt1Ag28(S-Adm)18(TPP)4 shows nearly the same intensity of PL after the addition of TPP. In addition, the temperature-dependent PL of the Ag29(BDT)12(TPP)4 NC shows two segments of rising curves, which represent both the restriction of the TPP dissociation–aggregation process (the QY varies from 0.9% to 22.5%) and the quenched thermal vibration process (the QY varies from 22.5% to about 100%). However, the non-dissociative Pt1Ag28(S-Adm)18(TPP)4 only exhibits a quenched thermal vibration process (the QY varies from 9.3% to ∼100%).
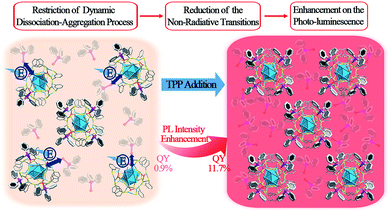 | ||
| Scheme 1 Enhancement of PL intensity induced by the restriction of the TPP dissociation–aggregation process based on the Ag29(BDT)12(TPP)4 NC in the solution state. | ||
2 Experimental methods
Materials
All chemicals including silver nitrate (AgNO3, 99%, metal basis), hexachloroplatinic(IV) acid (H2PtCl6·6H2O, 99.99%, metals basis), triphenylphosphine (TPP, 99%), benzene-1,3-dithiol (BDT, 99%), 2,4-dimethylbenzenethiol (HSPhMe2, 99%), 1-adamantanethiol (HSC10H15, 99%), sodium borohydride (NaBH4, 99.9%), methylene chloride (CH2Cl2, HPLC grade, Aldrich), acetic ether (CH3COOC2H5, HPLC, Aldrich), methanol (CH3OH, HPLC, Aldrich), ethanol (CH3CH2OH, HPLC, Aldrich) and N,N-dimethylformamide (DMF, HPLC, Aldrich) were purchased from Sigma-Aldrich and used without further purification. Pure water was purchased from Wahaha Co. Ltd. All glassware was thoroughly cleaned with aqua regia (HCl![[thin space (1/6-em)]](https://www.rsc.org/images/entities/char_2009.gif) :
:![[thin space (1/6-em)]](https://www.rsc.org/images/entities/char_2009.gif) HNO3 = 3
HNO3 = 3![[thin space (1/6-em)]](https://www.rsc.org/images/entities/char_2009.gif) :
:![[thin space (1/6-em)]](https://www.rsc.org/images/entities/char_2009.gif) 1 v/v), rinsed with copious amounts of pure water, and then dried in an oven prior to use.
1 v/v), rinsed with copious amounts of pure water, and then dried in an oven prior to use.
Synthesis of the Ag29(BDT)12(TPP)4 NC
The synthesis of the Ag29(BDT)12(TPP)4 NC was performed following a method reported by Bakr and coworkers.27Synthesis of the Pt1Ag28(S-Adm)18(TPP)4 NC
The synthesis of the Pt1Ag28(S-Adm)18(TPP)4 NC was performed according to our previous work.43Synthesis of the Pt1Ag28(BDT)12(TPP)4 NC
The synthesis of the Pt1Ag28(BDT)12(TPP)4 NC was performed following a method previously reported by Bakr and coworkers.44Test of the TPP ligand concentration–PL intensity correlation
10 mg of Ag29(BDT)12(TPP)4 (or Pt1Ag28(S-Adm)18(TPP)4 or Pt1Ag28(BDT)12(TPP)4) NC was dissolved in 10 mL of DMF. Then the TPP ligand was added to the DMF solution with the molar ratio of TPP/NC ranging from 0.1 to 10. The PL spectra were then measured for these mixed solutions.Test of the temperature–PL intensity correlation
10 mg of Ag29(BDT)12(TPP)4 (or Pt1Ag28(S-Adm)18(TPP)4) NC was dissolved in 10 mL of DMF. Then the solutions were cooled to different temperatures and the PL spectra were measured.Characterization
All UV-vis absorption spectra of NCs dissolved in DMF were recorded using an Agilent 8453 diode array spectrometer, with the background corrected by using a DMF blank. Solid samples were dissolved in DMF to make a dilute solution, which was transferred to a 1 cm path length quartz cuvette for spectral measurements.PL spectra were measured on an FL-4500 spectrofluorometer with the same optical density (OD) of ∼0.05. In these experiments, the NC solutions were prepared in DMF at a concentration of less than 1 mg mL−1.
Absolute quantum yields (QYs) were measured with dilute solutions of NCs (0.05 OD absorption at 445 nm) on a HORIBA FluoroMax-4P.
31P NMR spectra were acquired using a Bruker 600 Avance III spectrometer equipped with a Bruker BBO multinuclear probe (BrukerBioSpin, Rheinstetten, Germany). To achieve a sufficient signal-to-noise ratio, the 31P NMR spectra were recorded by collecting 1k scans with a recycle delay time of 5 s.
Electrospray ionization time-of-flight mass spectrometry (ESI-TOF-MS) measurements were performed on a MicrOTOF-QIII high-resolution mass spectrometer.
3 Results and discussion
The Ag29(BDT)12(TPP)4 NC was prepared following a method previously published by Bakr and coworkers.27 They also reported the crystal structure of Ag29(BDT)12(TPP)4.27 The structure is shown in Fig. 1A and B. Regarding the structural anatomy, Ag29(BDT)12(TPP)4 is composed of a three-layer configuration: the icosahedral Ag13 kernel is enclosed by four Ag3S6 motifs to form a Ag25(BDT)12 architecture (it should be noted that the four Ag3S6 motifs are united by the BDT ligands); the Ag25(BDT)12 architecture is further capped by four Ag–TPP units. Fig. 1C shows the UV-vis spectrum of Ag29(BDT)12(TPP)4, which exhibits broad, multiband optical absorption bands centred at 345, 360, 445, and 510 nm. Furthermore, Ag29(BDT)12(TPP)4 possesses an emission band centred at 642 nm (Fig. 1D). Additionally, the PL excitation spectrum is almost the same as the absorption spectrum (Fig. 1C and D), which is reminiscent of some previously reported fluorescent NCs as well as the quantum-dot behavior.22,25,45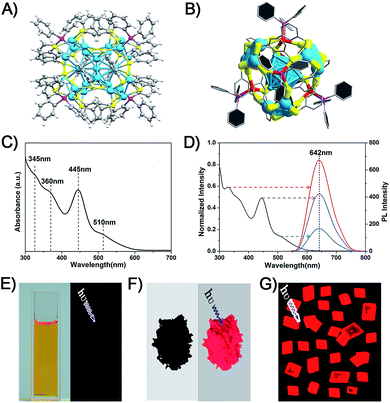 | ||
| Fig. 1 (A) Total structure of the Ag29(BDT)12(TPP)4 NC (redrawn from ref. 27). (B) Structural anatomy of the Ag29(BDT)12(TPP)4 NC. (C) UV-vis spectrum of the Ag29(BDT)12(TPP)4 NC (dissolved in DMF). (D) PL excitation spectrum (black) and emission spectra (other colors) of the Ag29(BDT)12(TPP)4 NC. Digital photographs of the Ag29(BDT)12(TPP)4 NC in (E) solution state, (F) solid state, and (G) crystal state under visible or UV light. Color codes: cerulean/red spheres, Ag; yellow spheres, S; purple spheres, P; grey spheres, C; white spheres, H. | ||
It is noteworthy that the PL QY of Ag29(BDT)12(TPP)4 is only 0.9%, which is too weak to be perceived by the naked eye (Fig. 1E).27,28 Interestingly, the Ag29(BDT)12(TPP)4 NC exhibits enhanced fluorescence in the solid or crystal state (Fig. 1F and G). These observations suggest that the aggregation process significantly boosts the emission of Ag29(BDT)12(TPP)4. Previously, the RIM pattern was believed to be the primary cause either in the solvent- or ion-induced AIE process.19,25 In our current work, the AIE observed during the drying or crystallization process is obviously not relevant to any ionic effect, because our process only involves a solvent evaporation process.
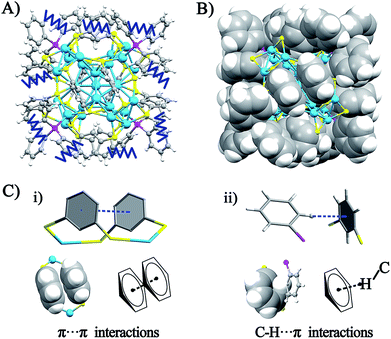
The crystal structure of the Ag29(BDT)12(TPP)4 NC is analyzed in order to gain insight into the aforementioned solvent evaporation-induced AIE. In the solution state, the energy dissipation of photo-excited Ag29(BDT)12(TPP)4 includes two pathways: (i) non-radiative transitions (mainly affected by intra-molecular vibrations), and (ii) radiative transitions (through luminescence). Fig. 2A shows an illustration of intra-molecular vibrations of the Ag29(BDT)12(TPP)4 NC, which comprise rota-vibrations and swing-vibrations. However, the considerable close-packing of the structural configuration (see the space-fill pattern in Fig. 2B) suggests that such vibrations are difficult. Furthermore, as mentioned above, each Ag3S6 motif is linked by the BDT ligand, which restricts the vibrations of Ag–S–Ag motifs. Moreover, many π⋯π and C–H⋯π interactions among BDT or TPP ligands are observed. Specifically, every two neighboring benzene rings of BDT ligands interact through π⋯π interaction, which forms 6 pairs of π⋯π interactions in total (Fig. 2C). In addition, the vibration of each of the ortho-position C–H on TPP is rendered difficult owing to the C–H⋯π interaction with the nearby benzene ring of BDT (altogether 12 pairs of C–H⋯π interactions, shown in Fig. 2C). To summarize, the main cause of the weak PL of the Ag29(BDT)12(TPP)4 NC in solution is not thermal vibration, because the architecture of the Ag29(BDT)12(TPP)4 NC exhibits strong rigidity. Consequently, the AIE of the Ag29(BDT)12(TPP)4 NC is unlikely induced by the RIM pattern completely.
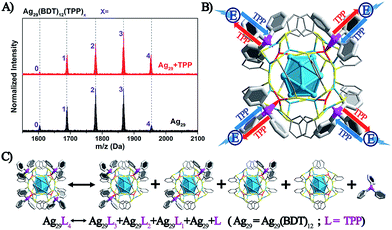
The above discussion raises an interesting question: what is the essential role of the AIE in the Ag29(BDT)12(TPP)4 NC? From the ESI-MS spectrum of Ag29(BDT)12(TPP)4 (Fig. 3A, see Fig. S1† for the expansion of the spectrum, and Fig. S2† for the comparison of the experimental and simulated isotope patterns), we find that the TPP ligands are capable of dissociation to generate Ag29(BDT)12(TPP)x (x = 0–3) and the dissociated TPP ligands. For instance, the highest signal in the ESI-MS spectrum is the peak of Ag29(BDT)12(TPP)2, which is generated by dissociating two TPP ligands of the intact NC. To further validate the TPP dissociation process of Ag29(BDT)12(TPP)4 in the solution state, ESI-MS measurements were also performed on the mixture of Ag29(BDT)12(TPP)4 NC with extra TPP. The spectrum (Fig. 3A, red line) exhibits a stronger signal of the intact Ag29(BDT)12(TPP)4 NC compared with the case of the Ag29(BDT)12(TPP)4 NC only (Fig. 3A, black line), which indicates a suppressed dissociation process with extra TPP in solution (note that because of the dilution process in the ESI-MS measurements, there were still lots of dissociated Ag29(BDT)12(TPP)x signals in the sample mixture). Therefore, based on the ESI-MS results, the reversible reaction of the Ag29(BDT)12(TPP)4 NC in solution could be determined to be Ag29(BDT)12(TPP)4 ↔ Ag29(BDT)12(TPP)3 + Ag29(BDT)12(TPP)2 + Ag29(BDT)12(TPP)1 + Ag29(BDT)12 + TPP (shown in Fig. 3C). Accordingly, the TPP ligands on the Ag29(BDT)12(TPP)4 NC are in dynamic dissociation/aggregation. It is suggested that the breaking of coordination bonds would consume energy,46 and thus the energy loss with non-radiative transitions would influence the energy release with the radiative transition. Specifically, the TPP dissociation process would consume vast amounts of energy, which could be used to explain the result of low PL of the photo-excited Ag29(BDT)12(TPP)4 NC in the solution state. Thus, we speculate that the significantly enhanced PL of the Ag29(BDT)12(TPP)4 NC in the solid or crystal state should arise from the restriction of the TPP dissociation–aggregation process—which inhibits the non-radiative pathways, and thus enhances the radiative pathway (PL). Therefore, the AIE of the Ag29(BDT)12(TPP)4 NC could be induced by the restriction of the ligand dissociation–aggregation process.
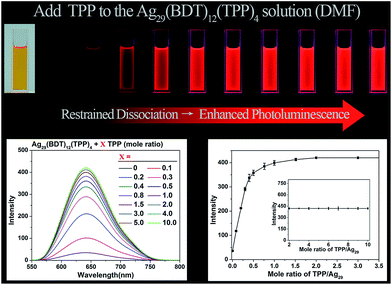
Considering that the TPP dissociation–aggregation process is a reversible reaction, we are motivated to control the reversible process to control the intensity of PL. As shown in Fig. 4, an increasing proportion (molar ratio) of TPP added to the DMF solution of Ag29(BDT)12(TPP)4 increases the PL intensity rapidly in the beginning, and then it levels off, with the highest PL QY being 11.7%, which is in striking contrast to the weakly luminescent Ag29(BDT)12(TPP)4 NC with no TPP addition (QY = 0.9%). A quantitative test was performed to obtain the relationship between the PL intensity and the amount of TPP added (Fig. 4, bottom-left). When adding a 0.1 molar ratio of TPP (versus NC) to the DMF solution of Ag29(BDT)12(TPP)4 NC, the PL intensity increases by almost 3 times compared with the initial state. Furthermore, by the further addition of TPP, the QY enhancement gradually becomes steady. Finally, a 13-fold enhancement compared to the initial state is achieved when the amount of added TPP is greater than 2 (molar ratio). The PL intensity at 642 nm is compared (Fig. 4, bottom-right), which also confirms the PL variation trend in the PL QY test (i.e., the increasing trend as well as the 13-fold enhancement). To sum up, the redundant TPP ligands will prevent the TPP dissociation–aggregation process on the nanocluster surface, and then enhance the PL intensity of the Ag29(BDT)12(TPP)4 NC.
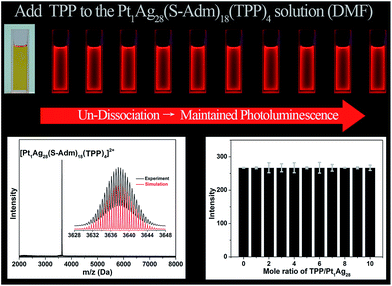
For comparison, the same TPP-addition experiment was performed on the Pt1Ag28(S-Adm)18(TPP)4 NC (see Fig. S3† for the structural anatomy of Pt1Ag28(S-Adm)18(TPP)4).43 The ESI-MS of the Pt1Ag28(S-Adm)18(TPP)4 NC shows a distinct peak at 3637.63 Da (Fig. 5, bottom-left), which clearly illustrates the non-dissociated state of TPP ligands of this NC in the DMF solution. The unchanged ESI-MS and UV-vis spectra after the addition of TPP ligands illustrate that the as-synthesized nanoclusters will not decompose or transform in this operation (Fig. S4†). Importantly, in sharp contrast to the PL variation trend of the Ag29(BDT)12(TPP)4 NC, the PL intensity of the Pt1Ag28(S-Adm)18(TPP)4 NC maintains a QY of 9.3% no matter how high the TPP amount added to the solution is (Fig. 5, top). Note that the PL QY of Pt1Ag28(S-Adm)18(TPP)4 in CH2Cl2 is 4.9%,43 which illustrates the solvent effect on the PL of Pt1Ag28(S-Adm)18(TPP)4. The PL intensity of the Pt1Ag28(S-Adm)18(TPP)4 NC monitored at 672 nm by fluorescence spectroscopy also indicates the unchanged fluorescence (Fig. 5, bottom-right). In other words, the non-dissociative Pt1Ag28(S-Adm)18(TPP)4 NC does not display any equilibrium dissociation–aggregation process, and thus the addition of TPP would not alter the PL intensity in the solution state. The sharp contrast between the PL variation trends of the Ag29(BDT)12(TPP)4 and Pt1Ag28(S-Adm)18(TPP)4 NCs indicates that the restriction of the ligand dissociation–aggregation process should be the major underlying mechanism of AIE in the Ag29(BDT)12(TPP)4 NC.
Additionally, in order to structurally and compositionally match the Pt1Ag28(S-Adm)18(TPP)4 NC, the TPP-addition experiment was performed on a Pt centrally doped Ag29(BDT)12(TPP)4 NC (that is, Pt1Ag28(BDT)12(TPP)4 NC).44 As shown in Fig. S5,† the PL intensity of Pt1Ag28(BDT)12(TPP)4 also exhibits significant enhancement by the addition of TPP (the maximum PL QY was 18.9%), which is similar to the case of Ag29(BDT)12(TPP)4; hence, Pt doping is not the critical factor for PL enhancement with TPP addition. Specifically, the fluorescence intensity (centered at 720 nm) rises rapidly during the initial TPP addition and then levels off once the molar ratio (TPP to Pt1Ag28(BDT)12(TPP)4 NC) is greater than 1.5. A 7-fold enhancement is finally obtained by the addition of TPP to the Pt1Ag28(BDT)12(TPP)4 NC. Considering the same PL enhancement phenomenon of the Pt1Ag28(BDT)12(TPP)4 and Ag29(BDT)12(TPP)4 NCs with the addition of TPP ligands, the difference in the metallic composition is unlikely to be the primary cause for being dissociative or not of these NCs. The major different between the dissociative Ag29(BDT)12(TPP)4 and non-dissociative Pt1Ag28(S-Adm)18(TPP)4 nanoclusters is the outer ligands (BDT vs. S-Adm). The difference of these two ligands largely affects the structure of the metallic kernel and outer complex shell, which is a critical factor in the dissociative/non-dissociative phenomenon (see Fig. S6† for the structural anatomies of the Pt1Ag28(BDT)12(TPP)4 as well as the Pt1Ag28(S-Adm)18(TPP)4).
31P NMR was performed to validate the TPP dynamic dissociation–aggregation state of the Ag29(BDT)12(TPP)4 and Pt1Ag28(S-Adm)18(TPP)4 NCs. As shown in Fig. S7 and S8,† the 31P NMR spectrum of the Ag29(BDT)12(TPP)4 NC (without the addition of TPP) exhibits a broad peak (half-peak width ∼0.85 ppm), which narrows down continuously with the addition of more TPP (the peak width finally reduces to 0.17 ppm with a large excess of TPP in the Ag29(BDT)12(TPP)4 solution). The notable decrease in the peak width illustrates that the state of P is uniformalized; that is, the TPP dynamic dissociation–aggregation extent of the Ag29(BDT)12(TPP)4 NC in solution is remarkably suppressed with the addition of excess TPP. Furthermore, the maintained width of the 31P NMR peak (half-peak width by 0.02 ppm, shown in Fig. S9†) for the Pt1Ag28(S-Adm)18(TPP)4 with or without TPP addition demonstrates the TPP non-dissociated state of the Pt1Ag28(S-Adm)18(TPP)4 NC.
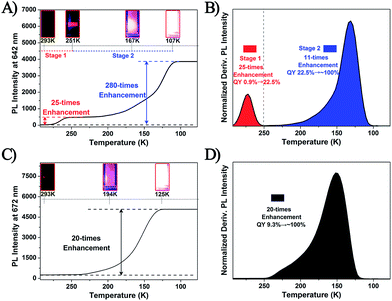
It is well known that the temperature would significantly influence the dissociation–aggregation dynamic equilibrium process. Thus, to further verify the above-mentioned AIE mechanism, the temperature–PL intensity correlation of the Ag29(BDT)12(TPP)4 and Pt1Ag28(S-Adm)18(TPP)4 NCs was monitored. As shown in Fig. 6A and B and S10,† the temperature-dependent fluorescence of the Ag29(BDT)12(TPP)4 NC shows two stages: (1) when the temperature is reduced from 293 K to 251 K, the fluorescence shows a 25-fold enhancement (in this state the UV-vis absorption is maintained, and thus the PL QY increases from 0.9% to 22.5%), and (2) the fluorescence intensity is increased significantly (a 280-fold boost comparing the 107 K data with the 293 K data) when the temperature is reduced to 107 K, and the UV-vis absorption presents a 2.5-fold enhancement (Fig. S11†). Accordingly, the PL QY increases almost to 100%. The fluorescence of the Ag29(BDT)12(TPP)4 NC appeared to be extremely bright at 107 K, which is in striking contrast to the nearly invisible fluorescence at room temperature (Fig. 6A, insets). In strong contrast, the non-dissociative Pt1Ag28(S-Adm)18(TPP)4 NC exhibits only one stage during the same temperature lowering process (Fig. 6C and D and S12†), and finally exhibits a 20-fold enhancement of PL intensity and 1.9-fold enhancement of UV-vis absorption (Fig. S13†). Thus, the PL QY of the Pt1Ag28(S-Adm)18(TPP)4 NC in the final stage is also nearly 100%. Furthermore, it should be noted that the single stage of Pt1Ag28(S-Adm)18(TPP)4 is similar to stage 2 of the Ag29(BDT)12(TPP)4 NC. Therefore, the PL boost in stage 2 of the Ag29(BDT)12(TPP)4 NC as well as in Pt1Ag28(S-Adm)18(TPP)4 should be completely induced by the suppression of thermal energy dissipation (or by the RIM pattern). Additionally, because the TPP dissociation process is much more sensitive to the temperature, the PL enhancement in stage 1 of the Ag29(BDT)12(TPP)4 NC should be mainly caused by the restriction of the TPP dissociation–aggregation process. Because this restriction process is easily influenced by the temperature variation, stage 1 is observed in the relatively high-temperature region (compared with stage 2 in the lower temperature region). To sum up, decreasing the temperature (from r.t. to 251 K) is effective in restricting the TPP dissociation–aggregation process which will lead to a significant enhancement in the fluorescence of the Ag29(BDT)12(TPP)4 NC in the solution state.
It should be noted that the PL enhancement of the Ag29(BDT)12(TPP)4 NC in the TPP addition process and temperature reduction process is different (13 times versus 25 times, with no increase in UV/vis absorption). In the TPP addition process, we find that the half-peak width (in the 31P NMR spectrum) of the Ag29(BDT)12(TPP)4 NC shows a continual decrease with the addition of TPP; however, the half-peak width in the final state is also wider than that in the Pt1Ag28(S-Adm)18(TPP)4 NC (0.17 versus 0.02 ppm). This suggests that the TPP dissociation–aggregation dynamic equilibrium in the Ag29(BDT)12(TPP)4 NC is not completely prohibited, but is just limited to a certain extent. In other words, the non-radiative pathways caused by the TPP dissociation–aggregation process still exist, even with the excess dose of TPP, which makes it difficult to reach the highest PL (with the non-dissociated state) of the Ag29(BDT)12(TPP)4 NC. By contrast, the non-dissociated state could be easily achieved in the temperature reduction process, and apparently, the Ag29(BDT)12(TPP)4 NC in the non-dissociated state (at 251 K) exhibits a higher PL QY than the final state in the TPP addition process (22.5% versus 11.7%).
4 Conclusions
In summary, a novel mechanism of aggregation-induced emission is discovered in nanoclusters, which involves the restriction of the ligand dissociation–aggregation process. The fluorescence intensity of Ag29(BDT)12(TPP)4 can be significantly enhanced (about 13-fold, quantum yield from 0.9% to 11.7%) via promoting the aggregation of TPP onto the easy-to-dissociate nanocluster surface. Furthermore, the TPP dissociation–aggregation dynamic equilibrium process of Ag29(BDT)12(TPP)4 is also restrained by reducing the temperature, which results in enhanced photoluminescence intensity (25-fold) in Ag29(BDT)12(TPP)4. In contrast, the same experiments performed on the non-dissociative Pt1Ag28(S-Adm)18(TPP)4 nanocluster do not show any PL enhancement. These different results are not caused by the presence of the Pt dopant, but by the different thiolate ligands (BDT versus S-Adm). The retained PL intensity in the case of Pt1Ag28(S-Adm)18(TPP)4 validates the aforementioned mechanism for the Ag29(BDT)12(TPP)4 nanocluster. Overall, this work presents a new mechanism of aggregation-induced emission in nanoclusters. In addition to previous studies on the enhancement of nanocluster photo-luminescence, this work will hopefully draw greater attention of optical and theoretical chemists to fully understand the photo-luminescence properties of metal nanoclusters. Future work will focus on extending this new AIE mechanism to other fluorescent nanoclusters.Conflicts of interest
There are no conflicts to declare.Acknowledgements
We acknowledge the financial support by the NSFC (21372006, U1532141 & 21631001), the Ministry of Education, the Education Department of Anhui Province, and the 211 Project of Anhui University.Notes and references
- R. Jin, C. Zeng, M. Zhou and Y. Chen, Chem. Rev., 2016, 116, 10346 CrossRef CAS PubMed.
- I. Chakraborty and T. Pradeep, Chem. Rev., 2017, 117, 8208 CrossRef CAS PubMed.
- P. Liu, R. Qin, G. Fu and N. Zheng, J. Am. Chem. Soc., 2017, 139, 2122 CrossRef CAS PubMed.
- Z. Hu and L. Jensen, Chem. Sci., 2017, 8, 4595 RSC.
- X.-K. Wan, J.-Q. Wang, Z.-A. Nan and Q.-M. Wang, Sci. Adv., 2017, 3, e1701823 CrossRef PubMed.
- D. M. Black, C. M. Crittenden, J. S. Brodbelt and R. L. Whetten, J. Phys. Chem. Lett., 2017, 8, 1283 CrossRef CAS PubMed.
- S. Yamazoe, K. Koyasu and T. Tsukuda, Acc. Chem. Res., 2014, 47, 816 CrossRef CAS PubMed.
- Z. Gan, Y. Lin, L. Luo, G. Han, W. Liu, Z. Liu, C. Yao, L. Weng, L. Liao, J. Chen, X. Liu, Y. Luo, C. Wang, S. Wei and Z. Wu, Angew. Chem., Int. Ed., 2016, 55, 11567 CrossRef CAS PubMed.
- Y. Niihori, S. Hossain, S. Sharma, B. Kumar, W. Kurashige and Y. Negishi, Chem. Rec., 2017, 17, 473 CrossRef CAS PubMed.
- X. Yuan, X. Dou, K. Zheng and J. Xie, Part. Part. Syst. Charact., 2015, 32, 613 CrossRef.
- N. A. Sakthivel, S. Theivendran, V. Ganeshraj, A. G. Oliver and A. Dass, J. Am. Chem. Soc., 2017, 139, 15450 CrossRef CAS PubMed.
- G. Hu, Q. Tang, D. Lee, Z. Wu and D.-e. Jiang, Chem. Mater., 2017, 29, 4840 CrossRef CAS.
- Y. Wang, X.-K. Wan, L. Ren, H. Su, G. Li, S. Malola, S. Lin, Z. Tang, H. Häkkinen, B. K. Teo, Q.-M. Wang and N. Zheng, J. Am. Chem. Soc., 2016, 138, 3278 CrossRef CAS PubMed.
- K. K. Chakrahari, J.-H. Liao, S. Kahlal, Y.-C. Liu, M.-H. Chiang, J.-Y. Saillard and C. W. Liu, Angew. Chem., Int. Ed., 2016, 55, 14704 CrossRef CAS PubMed.
- K. L. D. M. Weerawardene and C. M. Aikens, J. Am. Chem. Soc., 2016, 138, 11202 CrossRef CAS PubMed.
- I. Dolamic, S. Knoppe, A. Dass and T. Bürgi, Nat. Commun., 2012, 3, 798 CrossRef PubMed.
- Z. Hu and L. Jensen, Chem. Sci., 2017, 8, 4595 RSC.
- (a) Y. Yu, Z. Luo, D. M. Chevrier, D. T. Leong, P. Zhang, D.-e. Jiang and J. Xie, J. Am. Chem. Soc., 2014, 136, 1246 CrossRef CAS PubMed; (b) S.-S. Zhang, L. Feng, R. D. Senanayake, C. M. Aikens, X.-P. Wang, Q.-Q. Zhao, C.-H. Tung and D. Sun, Chem. Sci., 2018, 9, 1251 RSC; (c) N. Goswami, Q. Yao, T. Chen and J. Xie, Coord. Chem. Rev., 2016, 329, 1 CrossRef CAS; (d) X. Kang, L. Xiong, S. Wang, Y. Pei and M. Zhu, Chem. Commun., 2017, 53, 12564 RSC; (e) N. Goswami, Z. Luo, X. Yuan, D. T. Leong and J. Xie, Mater. Horiz., 2017, 4, 817 RSC; (f) M. S. Bootharaju, S. M. Kozlov, Z. Cao, M. Harb, N. Maity, A. Shkurenko, M. R. Parid, M. N. Hedhili, M. Eddaoudi, O. F. Mohammed, O. M. Bakr, L. Cavallo and J.-M. Basset, J. Am. Chem. Soc., 2017, 139, 1053 CrossRef CAS PubMed; (g) K. Zheng, M. I. Setyawati, D. T. Leong and J. Xie, Coord. Chem. Rev., 2018, 357, 1 CrossRef CAS.
- (a) Z. Luo, X. Yuan, Y. Yu, Q. Zhang, D. T. Leong, J. Y. Lee and J. Xie, J. Am. Chem. Soc., 2012, 134, 16662 CrossRef CAS PubMed; (b) N. Goswami, Q. Yao, Z. Luo, J. Li, T. Chen and J. Xie, J. Phys. Chem. Lett., 2016, 7, 962 CrossRef CAS PubMed.
- Z. Wu, H. Liu, T. Li, J. Liu, J. Yin, O. F. Mohammed, O. M. Bakr, Y. Liu, B. Yang and H. Zhang, J. Am. Chem. Soc., 2017, 139, 4318 CrossRef CAS PubMed.
- T. Udayabhaskararao, Y. Sun, N. Goswami, S. K. Pal, K. Balasubramanian and T. Pradeep, Angew. Chem., Int. Ed., 2012, 51, 2155 CrossRef CAS PubMed.
- S. Wang, X. Meng, A. Das, T. Li, Y. Song, T. Cao, X. Zhu, M. Zhu and R. Jin, Angew. Chem., Int. Ed., 2014, 53, 2376 CrossRef CAS PubMed.
- Z. Lei, X.-L. Pei, Z.-J. Guan and Q.-M. Wang, Angew. Chem., Int. Ed., 2017, 56, 7117 CrossRef CAS PubMed.
- Z. Lei, X.-L. Pei, Z.-G. Jiang and Q.-M. Wang, Angew. Chem., Int. Ed., 2014, 53, 12771 CrossRef CAS PubMed.
- X. Kang, S. Wang, Y. Song, S. Jin, G. Sun, H. Yu and M. Zhu, Angew. Chem., Int. Ed., 2016, 55, 3611 CrossRef CAS PubMed.
- M. S. Bootharaju, C. P. Joshi, M. R. Parida, O. F. Mohammed and O. M. Bakr, Angew. Chem., Int. Ed., 2016, 55, 922 CrossRef CAS PubMed.
- L. G. AbdulHalim, M. S. Bootharaju, Q. Tang, S. D. Gobbo, R. G. AbdulHalim, M. Eddaoudi, D.-e. Jiang and O. M. Bakr, J. Am. Chem. Soc., 2015, 137, 11970 CrossRef CAS PubMed.
- G. Soldan, M. A. Aljuhani, M. S. Bootharaju, L. G. AbdulHalim, M. R. Parida, A.-H. Emwas, O. F. Mohammed and O. M. Bakr, Angew. Chem., Int. Ed., 2016, 55, 5749 CrossRef CAS PubMed.
- X. Kang, L. Xiong, S. Wang, H. Yu, S. Jin, Y. Song, T. Chen, L. Zheng, C. Pan, Y. Pei and M. Zhu, Chem.–Eur. J., 2016, 22, 17145 CrossRef CAS PubMed.
- Y. Wang, H. Su, L. Ren, S. Malola, S. Lin, B. K. Teo, H. Häkkinen and N. Zheng, Angew. Chem., Int. Ed., 2016, 55, 15152 CrossRef CAS PubMed.
- R.-W. Huang, Y.-S. Wei, X.-Y. Dong, X.-H. Wu, C.-X. Du, S.-Q. Zang and T. C. W. Mak, Nat. Chem., 2017, 9, 689 CrossRef CAS PubMed.
- F. Wang and X. Liu, Chem. Soc. Rev., 2009, 38, 976 RSC.
- D. Wu, A. C. Sedgwick, T. Gunnlaugsson, E. U. Akkaya, J. Yoon and T. D. James, Chem. Soc. Rev., 2017, 46, 7105 RSC.
- G. H. Carey, A. L. Abdelhady, Z. Ning, S. M. Thon, O. M. Bakr and E. H. Sargent, Chem. Rev., 2015, 115, 12732 CrossRef CAS PubMed.
- Z. Wu and R. Jin, Nano Lett., 2010, 10, 2568 CrossRef CAS PubMed.
- X. Kang, X. Li, H. Yu, Y. Lv, G. Sun, Y. Li, S. Wang and M. Zhu, RSC Adv., 2017, 7, 28606 RSC.
- A. Kim, C. Zeng, M. Zhou and R. Jin, Part. Part. Syst. Charact., 2017, 34, 1600388 CrossRef.
- X. Liu, J. Yuan, C. Yao, J. Chen, L. Li, X. Bao, J. Yang and Z. Wu, J. Phys. Chem. C, 2017, 121, 13848 CAS.
- K. Zheng, X. Yuan, K. Kuah, Z. Luo, Q. Yao, Q. Zhang and J. Xie, Chem. Commun., 2015, 51, 15165 RSC.
- X. Dou, X. Yuan, Y. Yu, Z. Luo, Q. Yao, D. T. Leong and J. Xie, Nanoscale, 2014, 6, 157 RSC.
- (a) J. Mei, N. L. C. Leung, R. T. K. Kwok, J. W. Y. Lam and B. Z. Tang, Chem. Rev., 2015, 115, 11718 CrossRef CAS PubMed; (b) R. Hu, N. L. C. Leung and B. Z. Tang, Chem. Soc. Rev., 2014, 43, 4494 RSC; (c) Y. Hong, J. W. Y. Lam and B. Z. Tang, Chem. Soc. Rev., 2011, 40, 5361 RSC; (d) J. Wu, W. Liu, J. Ge, H. Zhang and P. Wang, Chem. Soc. Rev., 2011, 40, 3483 RSC.
- (a) Z. Ning, Z. Chen, Q. Zhang, Y. Yan, S. Qian, Y. Cao and H. Tian, Adv. Funct. Mater., 2007, 17, 3799 CrossRef CAS; (b) D. Ding, K. Li, B. Liu and B. Z. Tang, Acc. Chem. Res., 2013, 46, 2441 CrossRef CAS PubMed; (c) Y. Cui, B. Chen and G. Qian, Coord. Chem. Rev., 2014, 273, 76 CrossRef; (d) J. Mei, Y. Hong, J. W. Y. Lam, A. Qin, Y. Tang and B. Z. Tang, Adv. Mater., 2014, 26, 5429 CrossRef CAS PubMed; (e) R. T. K. Kwok, C. W. T. Leung, J. W. Y. Lam and B. Z. Tang, Chem. Soc. Rev., 2015, 44, 4228 RSC.
- X. Kang, M. Zhou, S. Wang, S. Jin, G. Sun, M. Zhu and R. Jin, Chem. Sci., 2017, 8, 2581 RSC.
- M. S. Bootharaju, S. M. Kozlov, Z. Cao, M. Harb, M. R. Parida, M. N. Hedhili, O. F. Mohammed, O. M. Bakr, L. Cavallo and J.-M. Basset, Nanoscale, 2017, 9, 9529 RSC.
- H. Wu, H. Zhu, J. Zhuang, S. Yang, C. Liu and Y. C. Cao, Angew. Chem., Int. Ed., 2008, 47, 3730 CrossRef CAS PubMed.
- (a) S. A. Macgregor and T. Wondimagegn, Organometallics, 2007, 26, 1143 CrossRef CAS; (b) S. A. Macgregor and P. Vadivelu, Organometallics, 2007, 26, 3651 CrossRef CAS; (c) D. Hill, C. Delaney, M. Clark, M. Eaton, B. Hassan, O. Hendricks, D. K. Dang and R. U. Kirss, RSC Adv., 2017, 7, 34425 RSC.
Footnote |
| † Electronic supplementary information (ESI) available: Fig. S1–S13 for the ESI-MS, UV-vis, PL, and 31P NMR spectra and the structural anatomies of the NCs. See DOI: 10.1039/c7sc05317g |
| This journal is © The Royal Society of Chemistry 2018 |

