 Open Access Article
Facile synthesis of novel calcium silicate hydrated-nylon 6/66 nanocomposites by solution mixing method
S. Estrada-Flores a,
A. Martínez-Luévanos
 *a,
P. Bartolo-Pérezb,
L. A. García-Cerdac,
T. E. Flores-Guia
 a and
E. N. Aguilera-Gonzáleza
aDepartamento de Materiales Cerámicos Avanzados y Energía, Facultad de Ciencias Químicas, Universidad Autónoma de Coahuila, Blvd. V. Carranza s/n, 25280, Saltillo, Coahuila, Mexico. E-mail: aml15902@uadec.edu.mx; Fax: +52-84-4169213; Tel: +52-84-41383973
bDepartamento de Física Aplicada, Cinvestav, Unidad Mérida, C.P. 97310, Mérida, Yucatán, Mexico
cDepartamento de Materiales Avanzados, CIQA, Saltillo, Coahuila, Mexico
First published on 14th December 2018
Abstract
In this article a facile and green procedure for the synthesis of novel calcium silicate hydrated-nylon 6/66 nanocomposites is proposed. Calcium silicate hydrate (CSH) was synthesized by a hydrolysis technique assisted by ultrasound and using sodium dodecyl sulphate (SDS) as surfactant. CSH-nylon 6/66 nanocomposites were obtained by a solution mixing method at CSH loadings of 2.5, 25, 50 and 75 weight percent (samples CA, CD, CB and CC, respectively). The synthesis of CSH was confirmed by DRX and ATR-FTIR techniques; the CSH sample presents as mesoporous with a diameter between 3.34 nm and 52.68 nm and an average size of 27.07 nm; the specific surface area of the CSH sample was 343.99 m2 g−1. The formation of the CSH-nylon 6/66 nanocomposites was confirmed by ATR-FTIR, SEM, XRD, TGA, DSC and XPS techniques. The crystallization and melting temperatures (Tm and Tc, respectively) of CSH-nylon 6/66 nanocomposites occur at a slightly lower temperatures than those of neat Ny 6/66. These results suggest a slight decrease of the crystallite size and crystallization rate of nylon 6/66. The fusion enthalpy (ΔHf) decreases with increase in CSH content in nylon 6/66, which can be associated to a good dispersion. The XRD peaks of the nylon 6/66 at 19.99° and 23.77° were displaced at slightly higher values of 2θ with the incorporation of CSH in the polymer forming nanocomposite materials.
Introduction
The interest in calcium silicates has grown in different fields such as biomaterials and wastewater treatment due to the capability of recovering phosphates from aqueous environments. Some calcium silicates like wollastonite, olivine and β-CaSiO3, have been reported as bioactive materials because of their ability to form hydroxyapatite (Hap) over their surface, but between the different types of silicates, calcium silicate hydrate (CSH) is distinguished for the presence of –OH groups and Ca2+ ions that react with the PO43− groups providing a high bioactivity, and for that, it is considered a promising material for bone regeneration.1–6 Besides the chemical composition of the CSH, characteristics such as specific surface area and porosity must also be considered to improve the bioactivity of the material, although there are some CSH with crystalline structures. The amorphous form of CSH can contribute to the obtaining of a porous morphology, and for that, it is necessary to find a synthesis method that allows the control of these properties.1In addition to the characteristics mentioned above, the biomaterials should have good mechanical properties and be easily processed to make different pieces such as bone prosthesis or dental implants that are more durable and efficient than the ones made with conventional materials.7–11 Ceramic materials are fragile and are not suitable for use in applications that require high load. In order to improve its mechanical properties, composite materials of ceramics with polymers like chitosan, polyamides and polycaprolactone have been studied as biomaterials.7,9,12–14
Among the polymers used in the field of biomaterials, the polyamides, also known as nylons, are an interesting group due to their chemical structure that allow a good interaction with ceramics like HAp, also, they have shown mechanical properties similar to human bones.12 Some types of nylons that have been reported before for synthesize composite materials are nylon 12, nylon 6, and nylon 6,66 with layered silicates and organoclays.12,15–18 Nylon 6/66 composites have been synthetized before with HAp as a filler, showing good bioactivity and good mechanical properties, for that it could be possible for composite materials made with CSH and nylon 6/66 show good bioactive behavior and good mechanical properties.
A common method to synthetize polymer matrix composites consist in the melting of the polymer and the subsequent incorporation of the ceramic in the melted polymer, needing high temperatures to melt the polymer and fabricate the composite. A more facile method to synthesize this type of composites is the solution mixing method that consist in the dissolution of the polymer in an accurate solvent where the ceramic particles are dispersed. This method ensures the homogeneity of the composite.19
In this study the synthesis of nanocomposite materials of CSH and nylon 6/66 through a facile method is investigated for first time, with the aim to obtain new nanocomposite materials with possible applications in bone regeneration, fabrication of prosthesis and in odontology.
Materials and methods
Materials
Calcium nitrate (Ca(NO3)2·4H2O, 99%), sodium meta-silicate (Na2SiO3, 44–47% SiO2), sodium lauryl sulfate (SDS, 99%), sodium hydroxide (NaOH, 99%), nylon 6/66 (M.W. 29![[thin space (1/6-em)]](https://www.rsc.org/images/entities/char_2009.gif) 954 g mol−1), anhydrous ethanol and formic acid (95%) were purchased from Sigma-Aldrich.
954 g mol−1), anhydrous ethanol and formic acid (95%) were purchased from Sigma-Aldrich.
Synthesis of CSH by hydrolysis and ion exchange
CSH was synthetized by a modification of the method reported by Mehrali et al.20 A solution 0.2 M of Ca(NO3)2 was prepared and the pH value was adjusted to 9 with a solution 0.1 M of NaOH; after that, SDS was added in a concentration equal to its critical micellar concentration (CMC). Subsequently, a solution 0.2 M of Na2SiO3 was mixed with the solution of Ca(NO3)2 and the mixture was left under ultrasonic irradiation (SONICS, Ultrasonic Processor, 20% amplitude, 750 W) for 15 min at 85 °C. The obtained white product was washed with deionized water and ethanol to eliminate the surfactant and finally it was dried in an oven at 120 °C for 2 hours.Synthesis of CSH-nylon 6/66 nanocomposite materials by solution mixing method
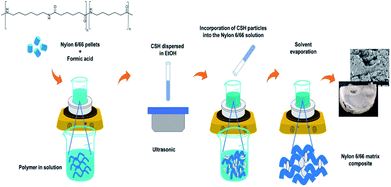
A previously established amount of nylon 6/66 pellets was dissolved in 6 ml of formic acid; after that, a suspension prepared with 0.2 g of the CSH into 15 ml of ethanol was added to the solution and the mixture was left under stirring for 15 min at 35 °C. Next, the temperature was raised to 45 °C and the stirring was turned off for 24 hours to evaporate the solvent. The white film obtained was then washed with deionized water and dried in an oven at 100 °C for 2 hours. Table 1 shows the synthesis conditions used to obtain four different composite materials and the synthesis procedure is schematized in Fig. 1.| Sample | Nylon 6/66 weight % | CSH weight % |
|---|---|---|
| CA | 75 | 25 |
| CD | 50 | 50 |
| CB | 25 | 75 |
| CC | 2.5 | 97.5 |
Characterization
The FTIR spectra were obtained with a Thermo Scientific spectrometer in the ATR modality. A X-ray diffractometer Rigaku Ultima IV (Cu Kα, 10° min−1, 2 theta/theta, D-Tex, 40 KV, 44 mA) was used to characterize the calcium silicate sample and their composites with nylon 6/66. The nitrogen adsorption/desorption isotherm of calcium silicate sample was obtained using a Beckman Coulter SA3100 equipment. The morphology of the samples was investigated with an electronic microscope Philips XL 30 ESEM, equipped with an energy-dispersive X-ray (EDX) microanalysis system.The thermal stability of CSH, nylon 6/66 and CSH-nylon 6/66 nanocomposites was determined using thermogravimetric analysis (TGA). Thermogravimetric measurements were performed using a PerkinElmer, TGA 4000 thermogravimetric analyser from 25 to 800 °C with a heating rate of 10 °C min−1 and nitrogen gas flow rate of 20 cm3 min−1. Differential scanning calorimetry (DSC) was employed to investigate the effect of CSH on the melting and crystallization behavior of nylon 6/66. Samples of neat nylon 6/66, CB and CD were studied using a TA Instruments DSC model Discovery 2500, using a heating and cooling rate of 10 °C min−1 between 30 and 300 °C under an inert nitrogen atmosphere. The samples were held at 300 °C for 5 min prior to cooling to remove previous thermal history. The samples were then cooled to 30 °C at 10 °C min−1 and reheated again to 300 °C at 10 °C min−1.
Chemical binding was analyzed by X-ray photoelectron spectroscopy (XPS) performed with a Thermo Scientific equipment, under high vacuum (9.5 × 10⁻⁹ mbar) operating with Al Kα radiation at 12 KV and 40 W; each sample was sputtered 15 seconds for a better analysis of the surface.
Results and discussion
Characterization of CSH
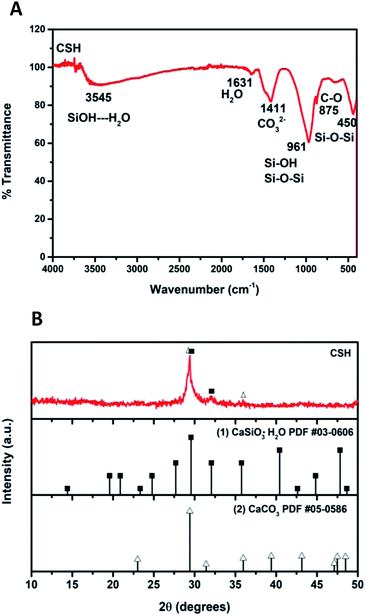
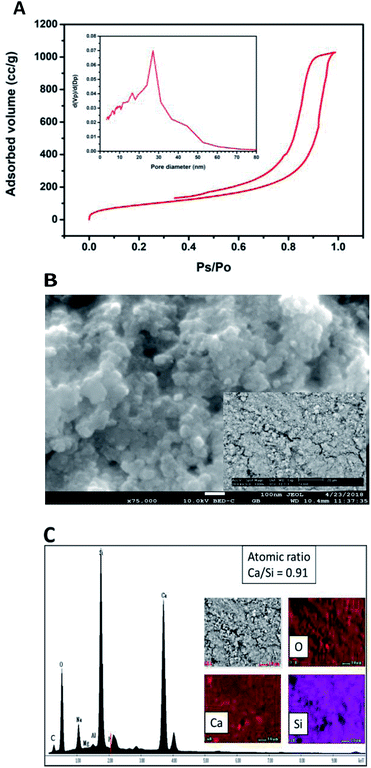
Fig. 2A shows the ATR-FTIR spectrum of the sample of calcium silicate. The band at 961 cm−1, can be attributed to a coupling of the vibrations of the Si–O–Si, Si–OH and Si(OSi)3O–Ca groups. The band at 3545 cm−1 is attributed to the stretching vibration of Si–OH⋯H2O, this band and the one at 1631 cm−1 indicate the presence of water in the chemical structure of calcium silicate. Absorption band at 1411 cm−1 corresponding to the binding vibration of the C–O indicates the presence of CO23− groups, this is because the sample adsorbs CO2, and due to its nature, it is not possible to avoid this phenomenon once it is exposed to the environment.20–25 The diffraction pattern of the sample of calcium silicate is show in Fig. 2B; the presence of CSH (CaSiO3·H2O PDF #03-0606) was identified. Also, calcium carbonate is presented (CaCO3, PDF #05-0586); the formation of this phase maybe took place during the synthesis process, where CO2 from the atmosphere was absorbed due to the elevated pH conditions. The low-intensity diffraction peak at 2θ = 29.4° indicates low crystallinity of CSH.Specific surface area was estimated according to Brunauer–Emmet–Teller (BET) method and the pore size distribution was calculated according to the Barret–Joyner–Halenda (BJH) model with the data of the nitrogen desorption isotherm. The nitrogen adsorption/desorption isotherm presented in Fig. 3A corresponds to a type IV isotherm according to the IUPAC classification, which is characteristic of a mesoporous solid. The pore size distribution indicates that the CSH sample presents porous with a diameter between 3.34 nm and 52.68 nm and an average size of 27.07 nm. The specific surface area obtained was 343.99 m2 g−1, this result can ensure a higher bioactivity due to the increase of sites for formation of Hap; also the presence of mesoporous is a suitable characteristic for biomaterials for bone regeneration because they allow the free movement of biomolecules like proteins and induce the adhesion of cells.8,26–28 The SEM image shown in Fig. 3B suggests that the CSH consists of agglomerated nanoparticles and it has high porosity. Energy spectrum and element mapping images of Si, Ca and O of the CSH are shown in Fig. 3C. The value of the atomic ratio of Ca/Si is equal to 0.91, which is close to the expected theoretical value of 1; the difference between both values is due to EDX microanalysis is not a quantitative technique.
Characterization of CSH-nylon 6/66 nanocomposite materials
The ATR-FTIR spectrum of the CSH and ATR-spectra of the samples CA, CB, CC and CD are presented in Fig. 4A. It can be observed that the characteristic bands of the amide at 3293, 1631 and 1533 cm−1 (νN–H, νC![[double bond, length as m-dash]](https://www.rsc.org/images/entities/char_e001.gif) O, νC–N and δN–H) are displaced to higher wave number as the amount of CSH increases (see Fig. 4B and C).
O, νC–N and δN–H) are displaced to higher wave number as the amount of CSH increases (see Fig. 4B and C).
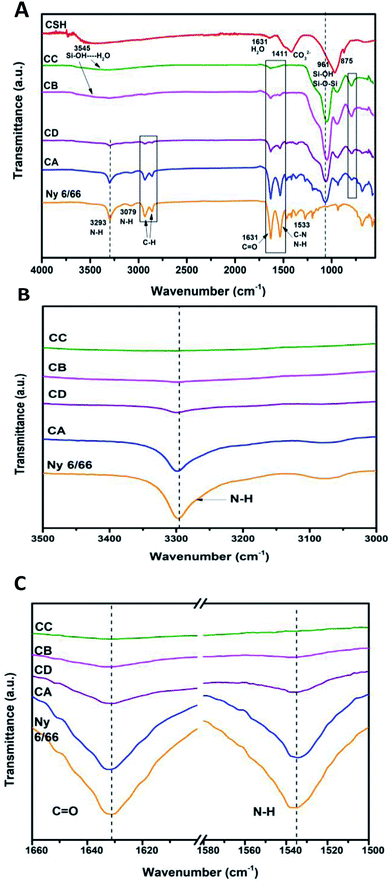 | ||
| Fig. 4 (A) ATR-FTIR spectra of the samples CA, CB, CD, CC and Ny 6/66 from 4000 to 400 cm−1; (B) spectra from 3500 to 3000 cm−1 and (C) spectra from 1660 to 1500 cm−1. | ||
The typical bands of the methylene groups at 2933 and 2859 cm−1, corresponding to the asymmetric and symmetric vibrations of C–H are also displaced to higher wave number. In the composite materials the band at 961 cm−1 is not present, but the appearance of the typical bands of the Si–O–Si are clearly presented from 1066 to 1047 cm−1 and 794 to 792 cm−1. Therefore, it can be inferred that the interaction between nylon 6/66 and CSH occurs trough amide groups of nylon 6/66 with Si–OH groups of the CSH. Table 2 shows the characteristic vibration frequencies in ATR-FTIR spectra of the samples CA, CB, CC and CD and the assignments according to the literature.16,20–23,29–32
| Assignments | Samples synthetized in this work | Literature | |||||
|---|---|---|---|---|---|---|---|
| CA | CD | CB | CC | Ny 6/66 | CSH | ||
| N–H stretching | 3299 | 3300 | — | — | 3293 | — | 3296–3335 |
| N–H overtone of amide II | 3077 | — | — | — | 3079 | — | 3070–3082 |
| CH methylene asymmetric stretching | 2933 | 2934 | — | — | 2933 | — | 2920–2934 |
| CH methylene symmetric stretching | 2859 | 2862 | — | — | 2859 | — | 2851–2860 |
C![[double bond, length as m-dash]](https://www.rsc.org/images/entities/char_e001.gif) O stretching amide I O stretching amide I |
1633 | 1633 | 1633 | 1633 | 1631 | — | 1632–1660 |
| C–N stretching and N–H bending amide II | 1534 | 1537 | 1538 | — | 1533 | — | 1530–1537 |
| CH2 scissoring | 1464 | 1463 | — | — | 1465 | — | 1466 |
| CH2 wagging | 1367 | 1363 | — | — | 1371 | — | 1370–1373 |
| Amide III | 1274 | — | — | — | 1270 | — | 1262–1279 |
| Si–OH⋯H2O | — | — | 3500–3100 | 3500–3100 | — | 3545 | 2800–3700 |
| H2O molecular | — | — | — | — | — | 1631 | 1600–1650 |
| CO32− asymmetric stretching | — | — | — | — | — | 1411 | 1410–1510 |
| Si–O–Si stretching | 1066 | 1060 | 1050 | 1047 | — | — | 1095–900 |
| Si(OSi)3O–Ca | 935 | 936 | 941 | 943 | — | 961 | 890–965 |
| Si–O–Si stretching or bending | 792 | 793 | 794 | 794 | — | — | 760–850 |
| C–O | — | — | — | — | — | 875 | 856–880 |
In the thermogravimetric curves (Fig. 5) a main weight loss can be seen between 350 °C and 550 °C for the nylon 6/66 and the samples CA, CB, CC and CD, this is due to the decomposition of the polymer chains. The starting degradation temperature of the pristine nylon 6/66 take place at 350 °C, this temperature value decreases for the samples CA, CB, CC and CD, having the lower degradation temperature for CB sample at 333 °C and the higher initial degradation temperature for CC sample at 348 °C. However, the final degradation temperature of the nylon 6/66 at 445 °C, increases as the amount of CSH in the polymer matrix increases too, obtaining the higher final degradation temperature in sample CC at 527 °C. This indicates that the samples CA, CB, CC and CD are thermally stable in a longer range of temperature, which can be due to the formation of bonds between the nylon 6/66 and the CSH. A second weight loss is seen in the TG curve of nylon 6/66; this loss starts at 603 °C and in this case the initial degradation temperature increases as the amount of CSH increases too, obtaining the higher initial degradation temperature in the composite CC at 613 °C. All samples of CSH-nylon 6/66 present higher thermal stability than pristine nylon 6/66. For the CSH a total weight loss of 30% occurs mainly due to the evaporation of adsorbed water and water bonded to the crystalline structure. After the degradation of the polymer matrix, some changes still occur in the composite materials such as the change of phase from CSH to wollastonite type silicate.33–36
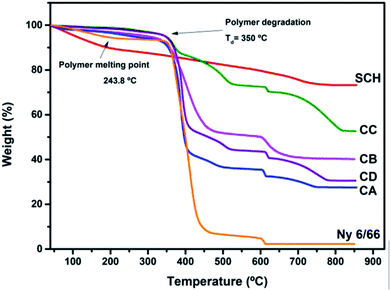 | ||
| Fig. 5 TG curves of the samples CA, CB, CC and CD and TG curves of nylon 6/66 (Ny 6/66) and the CSH. | ||
The DSC curves of neat nylon 6/66 and of the samples CB and CD during the first cooling and second heating processes are shown in Fig. 6A and B, respectively. Table 3 summarizes the data from the DSC curves. The crystallization temperature (Tc) of the samples CB and CD occurs at a slightly lower temperature than that of neat Ny 6/66. The high quantity of CSH added could deaccelerate the Ny 6/66 nucleation rate and consequently lead to the decrease of the crystallization rate, and as a result, the Tc during the cooling decreased. Also, the addition of CSH had a slight impact on the melting temperature (Tm); this may be is related to a slight reduction in crystallite size with the presence of CSH in the nanocomposites and consequently lead to the lower Tm value. However, an obvious decrease in the fusion enthalpy (ΔHf) was observed, due to the addition of CSH. This observation is in according to Venkataramani et al., (2009); they study the structure and properties of nylon 6/66 with a molecular weight of 35![[thin space (1/6-em)]](https://www.rsc.org/images/entities/char_2009.gif) 721.92 g mol−1 and a nylon 6/66 organoclay composite (2%). The fusion enthalpy (ΔHf) and melting temperature decrease with increase in clay content in nylon 6/66.17 Liu et al. (2018) investigated on crystallization of nylon 6/66 nanocomposites with exfoliated organoclay into the range of 1 to 5 weight percent, which was introduced and melt-blended with PA6/66 (Mn = 17
721.92 g mol−1 and a nylon 6/66 organoclay composite (2%). The fusion enthalpy (ΔHf) and melting temperature decrease with increase in clay content in nylon 6/66.17 Liu et al. (2018) investigated on crystallization of nylon 6/66 nanocomposites with exfoliated organoclay into the range of 1 to 5 weight percent, which was introduced and melt-blended with PA6/66 (Mn = 17![[thin space (1/6-em)]](https://www.rsc.org/images/entities/char_2009.gif) 000 g mol−1); they reported that Tc during the cooling increases.18
000 g mol−1); they reported that Tc during the cooling increases.18
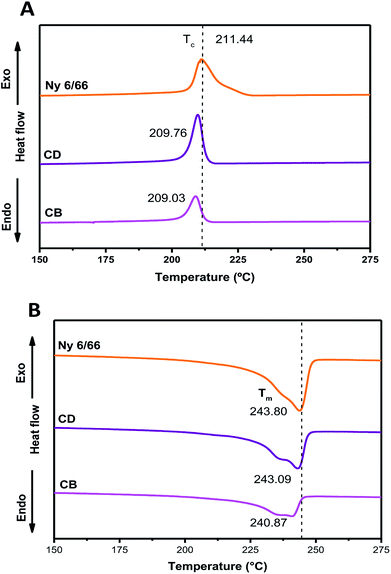 | ||
| Fig. 6 DSC curves of the nylon 6/66 and CSH-nylon 6/66 nanocomposites during the first cooling (A) and second heating (B) scans. | ||
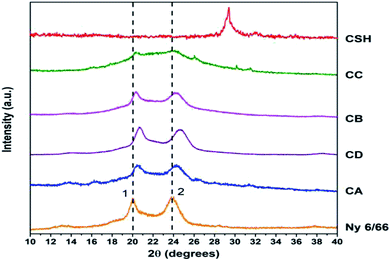
The Fig. 7 shows the XRD patterns of the samples CA, CB, CC and CD; XRD patterns of nylon 6/66 and CSH are also included. It is seen that the XRD pattern for nylon 6/66 shows its crystalline nature with the characteristic peaks at 2θ = 19.99° and 23.77° which belong to the monoclinic form; similar results have been reported for PA6/66 and its nanocomposites with different organoclay content.17 It is noticed that the two peaks of the nylon 6/66 are slightly shifted towards higher 2θ values with the incorporation of CSH in the composition of the samples CA, CB, CD and CC (see Table 4). This suggests that CSH was incorporated to nylon 6/66 forming composite materials. XRD pattern of sample CC also shows two small diffraction peaks at 26° and 30° that correspond to the presence of calcium formate, a subproduct from the reaction between CaCO3 present in the CSH sample and the formic acid used to dissolve the nylon 6/66. Calcium formate is soluble in water at 25 °C, therefore, it is possible to eliminate it easily.
| Sample | 2θ degrees | |
|---|---|---|
| Peak 1 | Peak 2 | |
| Ny 6/66 | 19.99 | 23.77 |
| CA | 20.42 | 24.30 |
| CD | 20.64 | 24.62 |
| CB | 20.34 | 24.06 |
| CC | 20.36 | 24.14 |
The morphology of the samples CA, CB, CC and CD was investigated by scanning electron microscopy (SEM). The Fig. 8 show the micrograph of the samples CA, CD, CB and CC. Also, energy spectra and element mapping images of Si and C of these samples are shown in this figure. It is observed that the samples CA and CD consist of a polymer matrix that is filled with very few agglomerates of CSH. The samples CB and CC consists of a ceramic matrix with a high amount of CSH particles. The morphology of the sample CD is very different to the other and it has more porous; this sample was possibly exposed to a longer analysis time by SEM and the energy of the beam could have burned it, leaving pores. The energy peaks corresponding to Si, Ca, C and O are observed in the energy spectra of the samples CA, CD, CB and CC. A semiquantitative analysis of the atomic ratio of Si![[thin space (1/6-em)]](https://www.rsc.org/images/entities/char_2009.gif) :
:![[thin space (1/6-em)]](https://www.rsc.org/images/entities/char_2009.gif) C for the samples CA, CD, CB and CC was performed and values of 0.045, 0.119, 0.648 and 1.007, respectively, were obtained. These measured values are lower than the expected theoretical values of 0.097, 0.194, 0.972 and 7.775 for the samples CA, CD, CB and CC, respectively, because EDX microanalysis is not a quantitative technique. The element mapping images of Si and C of the samples CA, CD, CB and CC suggest that they are homogeneous in their chemical composition.
C for the samples CA, CD, CB and CC was performed and values of 0.045, 0.119, 0.648 and 1.007, respectively, were obtained. These measured values are lower than the expected theoretical values of 0.097, 0.194, 0.972 and 7.775 for the samples CA, CD, CB and CC, respectively, because EDX microanalysis is not a quantitative technique. The element mapping images of Si and C of the samples CA, CD, CB and CC suggest that they are homogeneous in their chemical composition.
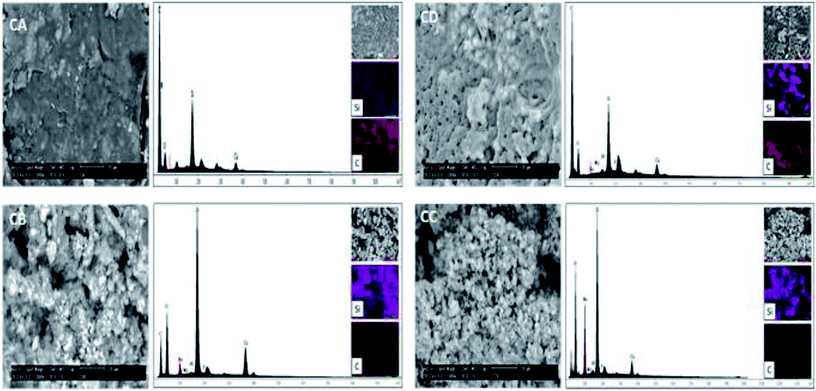 | ||
| Fig. 8 SEM micrographs, energy spectra and element mapping images of Si and C of the samples CA, CB, CC and CD. | ||
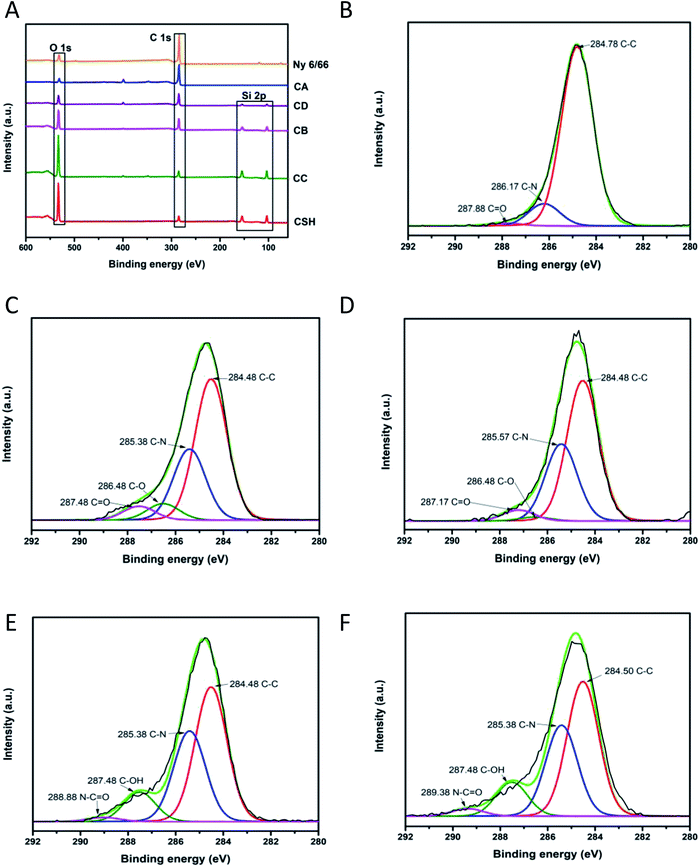
To investigate the chemical environment in the surface of the samples CA, CB, CC and CD, one XPS analysis was performed; the results are shown in Fig. 9. In the XPS binding energy spectra of the samples CA, CB, CC and CD the appearance of the peaks of Si 2p and the increasing of the intensity of the peak of O 1s can be seen; the displacement of the O 1s and the C 1s peaks shows the changing on the chemical environment in the surface of the samples (Fig. 9A). The deconvolution of the peak C 1s for the samples CA, CB, CC and CD is presented in Fig. 9B–F. The peak of the C 1s on the pristine nylon 6/66 was deconvoluted into three signals indicating the presence of C![[double bond, length as m-dash]](https://www.rsc.org/images/entities/char_e001.gif) O, C–N and C–C bonds (Fig. 9B). The signal of C–O bonding appears with the addition of the CSH to the polymer (samples CA, CB, CC and CD), which indicates the formation of new bonds between the carbon atoms of the polymer chain and the groups –OH of the CSH (Fig. 9C–F). The O 1s peak of spectra of pristine nylon 6/66 and the CSH and the O 1s peak of spectra of the samples CA, CB, CC and CD was also deconvoluted (Fig. 10). It is observed that there are two oxygen environments in the spectra of pristine nylon 6/66 that corresponding to N–C
O, C–N and C–C bonds (Fig. 9B). The signal of C–O bonding appears with the addition of the CSH to the polymer (samples CA, CB, CC and CD), which indicates the formation of new bonds between the carbon atoms of the polymer chain and the groups –OH of the CSH (Fig. 9C–F). The O 1s peak of spectra of pristine nylon 6/66 and the CSH and the O 1s peak of spectra of the samples CA, CB, CC and CD was also deconvoluted (Fig. 10). It is observed that there are two oxygen environments in the spectra of pristine nylon 6/66 that corresponding to N–C![[double bond, length as m-dash]](https://www.rsc.org/images/entities/char_e001.gif) O and C
O and C![[double bond, length as m-dash]](https://www.rsc.org/images/entities/char_e001.gif) O bonds. XPS spectra of the samples CA, CB, CC and CD have three other signals that corresponding to Si–O–Ca, Si–O–Si and Si–OH bonds from the CSH. The intensity of the signal of Si–O–Ca decreases as the amount of nylon 6/66 increases. Intensity of the signal of Si–OH of the CSH decreases as well as the intensity of the signal Si–O–Ca of the samples CA, CB, CC and CD.
O bonds. XPS spectra of the samples CA, CB, CC and CD have three other signals that corresponding to Si–O–Ca, Si–O–Si and Si–OH bonds from the CSH. The intensity of the signal of Si–O–Ca decreases as the amount of nylon 6/66 increases. Intensity of the signal of Si–OH of the CSH decreases as well as the intensity of the signal Si–O–Ca of the samples CA, CB, CC and CD.
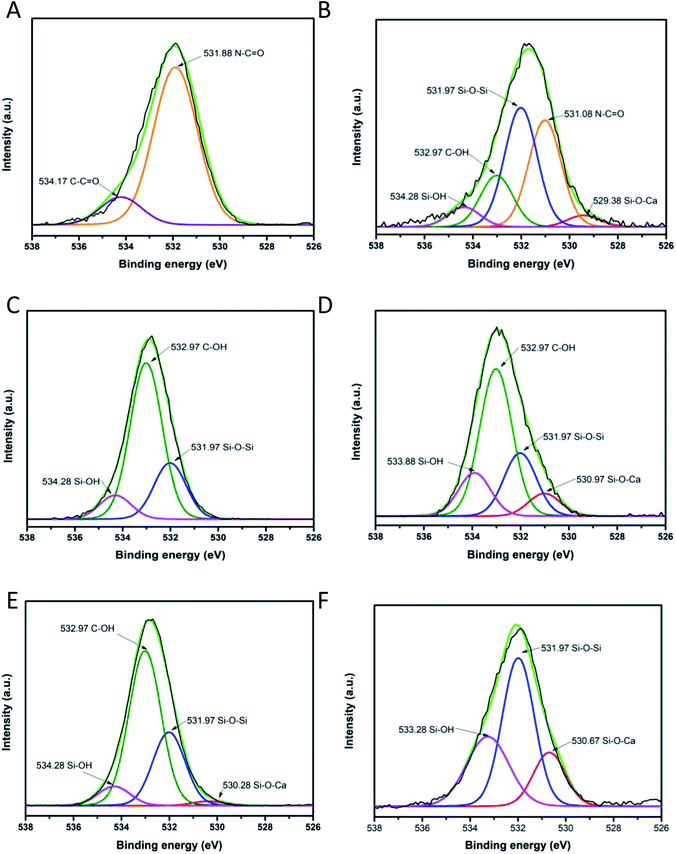 | ||
| Fig. 10 Deconvolution of O 1s peak of (A) pristine nylon 6/66, (B) composite CA, (C) composite CD, (D) composite CB, (E) composite CC and (F) CSH. | ||
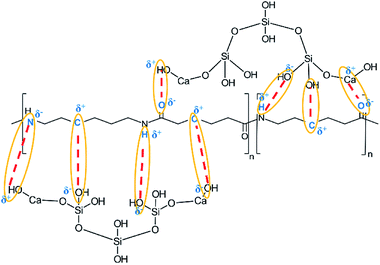
Based on the results of the ATR-FTIR spectra, XRD and XPS analysis of the spectra of the samples CA, CB, CC y CD, a structure of CSH-nylon 6/66 nanocomposites is proposed in Fig. 11.
Conclusions
According to the ATR-FTIR spectra, XRD patterns and the XPS analysis, it can be assumed that the solution mixing method, using formic acid to dissolve the nylon 6/66, allowed to easily synthetize CSH-nylon 6/66 nanocomposites. The synthesis of CSH-nylon 6/66 nanocomposites took place by the interaction between calcium atoms from the CSH with oxygen atoms from the nylon, as well as by the interactions between groups Si–OH from the CSH with groups –NH from the polymer chain. The incorporation of the CSH to nylon 6/66 increases its thermal stability. The crystallization and melting temperatures (Tm and Tc, respectively) of CSH-nylon 6/66 nanocomposites occurs at a slightly lower temperature than that of neat Ny 6/66. These results suggest a slight decrease of the crystallite size and crystallization rate of nylon 6/66. Due to the high value of specific surface area of the CSH (343.99 m2 g−1) and the chemical structure of CSH-nylon 6/66 nanocomposites, they can be used in the fabrication of bone prosthesis and odontology implants.Conflicts of interest
There are no conflicts to declare.Acknowledgements
S. Estrada-Flores thanks to the National Council of Science and Technology from Mexico (CONACYT) for the scholarship (446796).References
- P. Siriphannon, Y. Kameshima and A. Yasumori, J. Eur. Ceram. Soc., 2002, 22, 511–520 CrossRef CAS.
- A. B. Yoruc, Ceram. Int., 2007, 33, 687–692 CrossRef.
- K. Okano, S. Miyamaru, A. Kitao, H. Takano, T. Aketo, M. Toda, K. Honda and H. Ohtake, Sep. Purif. Technol., 2015, 144, 63–69 CrossRef CAS.
- Y. Lee, W. Wang, F. Lin and C. Lin, J. Formosan Med. Assoc., 2017, 116, 424–431 CrossRef CAS PubMed.
- W. Guan, F. Ji, Q. Chen, P. Yan and Q. Zhang, Ceram. Int., 2013, 39, 1385–1391 CrossRef CAS.
- R. A. Rashid, R. Shamsudin, M. H. A. Azmi and A. Jalar, Ceram. Int., 2014, 40, 6847–6853 CrossRef.
- F. Panahi, S. Mahmood and R. Shidpour, Mater. Sci. Eng., C, 2017, 80, 631–641 CrossRef CAS PubMed.
- C. Xie, P. Li, Y. Liu, F. Luo and X. Xiao, Mater. Sci. Eng., C, 2016, 67, 433–439 CrossRef CAS PubMed.
- I. A. W. B. Siqueira, N. Koba, D. Moura, J. Paulo, D. B. Machado, E. Henrique, F. Roberto and E. De Sousa, Mater. Lett., 2017, 206, 210–213 CrossRef CAS.
- M. Saini, Y. Singh, P. Arora, V. Arora and K. Jain, World J. Clin. Cases, 2015, 3, 52–57 CrossRef PubMed.
- S. Zeeshan, S. Corneliu and G. Michael, Materials, 2015, 8, 2953–2993 CrossRef.
- L. I. Castelan-Velazco, J. Mendez-Nonell, S. Sanchez-Valdes and M. F. Ramos-deValle, Polym. Bull., 2009, 110, 99–110 CrossRef.
- M. S. M. Eldin, E. A. Soliman, A. I. Hashem and T. M. Tamer, Trends Biomater. Artif. Organs, 2008, 22, 158–168 Search PubMed.
- S. Nazir, T. Hussain, A. Ayub, U. Rashid and A. J. Macrobert, Nanomedicine: Nanotechnology, Biology and Medicine, 2014, 10, 19–34 CrossRef CAS PubMed.
- T. Mcnally, W. R. Murphy, C. Y. Lew, R. J. Turner and G. P. Brennan, Polymer, 2003, 44, 2761–2772 CrossRef CAS.
- J. Pagacz, K. N. Raftopoulos, A. Leszczyn and K. Pielichowski, J. Therm. Anal. Calorim., 2016, 123, 1225–1237 CrossRef CAS.
- S. Venkataramani, J. H. Lee, M. G. Park and S. Ch. Kim, J. Macromol. Sci., Part A: Pure Appl. Chem., 2009, 46, 65–73 CrossRef CAS.
- X. Liu, Ch. Wang, Y. Liu, J. Chen, L. Mao, J. Yang and W. Wang, J. Macromol. Sci. Part B Phys., 2018, 57, 465–478 CrossRef CAS.
- W. E. Van Zyl, M. García, B. A. G. Schrauwen, B. J. Kooi and J. T. M. De Hosson, Macromol. Mater. Eng., 2002, 287, 106–110 CrossRef CAS.
- M. Mehrali, S. F. Seyed Shirazi, S. Baradaran, M. Mehrali, H. S. C. Metselaar, N. A. Bin Kadri and N. A. A. Osman, Ultrason. Sonochem., 2014, 21, 735–742 CrossRef CAS PubMed.
- A. Meiszterics, L. Rosta, H. Peterlik, J. Rohonczy, S. Kubuki, P. Henits and K. Sinkó, J. Phys. Chem., 2010, 114, 10403–10411 CrossRef CAS PubMed.
- C. Chen, C. Ho, S. Lin and S. Ding, Ceram. Int., 2015, 41, 5445–5453 CrossRef CAS.
- H. Aguiar, J. Serra, P. González and B. León, J. Non-Cryst. Solids, 2009, 355, 475–480 CrossRef CAS.
- D. A. Eurov, S. A. Grudinkin, D. A. Kurdyukov and V. G. Golubev, Phys. Solid State, 2015, 57, 2087–2092 CrossRef CAS.
- J. Abe, N. Hirano and N. Tsuchiya, J. Mater. Sci., 2012, 47, 7971–7977 CrossRef CAS.
- Y. Zhu, C. Wu, Y. Ramaswamy, E. Kockrick, P. Simon, S. Kaskel and H. Zreiqat, Microporous Mesoporous Mater., 2008, 112, 494–503 CrossRef CAS.
- C. Wu, J. Chang and W. Fan, J. Mater. Chem., 2012, 22, 16801–16809 RSC.
- J. Zhang and Y. Zhu, Microporous Mesoporous Mater., 2014, 197, 244–251 CrossRef CAS.
- T. Ishisue, M. Okamoto and K. Tashiro, Polymer, 2010, 51, 5585–5591 CrossRef CAS.
- I. A. Vorsina, T. F. Grigorèva, T. A. Udalova, S. V Vosmerikov and N. Z. Lyakhov, Russ. J. Appl. Chem., 2015, 88, 488–493 CrossRef CAS.
- R. M. Almeida and A. C. Marques, Characterization of sol – gel materials by Infrared spectroscopy, in Handbook of Sol-Gel Science and Technology, ed. L. Klein, M. Aparicio and A. Jitianu, Springer, Switzerland, 1st edn, 2017, pp. 1–31 Search PubMed.
- E. L. Papadopoulou, J. A. Heredia-Guerrero, M. I. Vázquez, J. Benavente, A. Athanassiou and I. S. Bayer, Polymer, 2017, 120, 255–263 CrossRef CAS.
- A. Abdal-hay, H. Raj Pant and J. K. Lim, Eur. Polym. J., 2013, 49, 1314–1321 CrossRef CAS.
- K. M. Lee, M. Kim, E. Lee, S. H. Baeck and S. E. Shim, Electrochim. Acta, 2016, 213, 124–131 CrossRef CAS.
- W. Ashraf and J. Olek, J. CO2 Util., 2018, 23, 61–74 CrossRef CAS.
- Heriyanto, F. Pahlevani and V. Sahajwalla, J. Cleaner Prod., 2018, 172, 3019–3027 CrossRef CAS.
| This journal is © The Royal Society of Chemistry 2018 |

