 Open Access Article
Creative Commons Attribution 3.0 Unported Licence
Time for global action: an optimised cooperative approach towards effective climate change mitigation†
A.
Galán-Martín
 a,
C.
Pozo
 a,
A.
Azapagic
 b,
I. E.
Grossmann
 c,
N.
Mac Dowell
 d and
G.
Guillén-Gosálbez
 *a
*a
aCentre for Process Systems Engineering, Department of Chemical Engineering, Imperial College London, South Kensington Campus, London SW7 2AZ, UK. E-mail: g.guillen05@imperial.ac.uk
bSchool of Chemical Engineering and Analytical Science, The University of Manchester, The Mill, Sackville Street, Manchester M13 9PL, UK
cCentre for Advanced Process Decision-Making, Department of Chemical Engineering, Carnegie Mellon University, Pittsburgh 15213, Pennsylvania, USA
dCentre for Environmental Policy, Imperial College London, South Kensington Campus, London SW7 1NA, UK
First published on 11th October 2017
Abstract
The difficulties in climate change negotiations together with the recent withdrawal of the U.S. from the Paris Agreement call for new cooperative mechanisms to enable a resilient international response. In this study we propose an approach to aid such negotiations based on quantifying the benefits of interregional cooperation and distributing them among the participants in a fair manner. Our approach is underpinned by advanced optimisation techniques that automate the screening of millions of alternatives for differing levels of cooperation, ultimately identifying the most cost-effective solutions for meeting emission targets. We apply this approach to the Clean Power Plan, a related act in the U.S. aiming at curbing carbon emissions from electricity generation, but also being withdrawn. We find that, with only half of the states cooperating, the cost of electricity generation could be reduced by US$41 billion per year, while simultaneously cutting carbon emissions by 68% below 2012 levels. These win–win scenarios are attained by sharing the emission targets and trading electricity among the states, which allows exploiting regional advantages. Fair sharing of dividends may be used as a key driver to spur cooperation since the global action to mitigate climate change becomes beneficial for all participants. Even if global cooperation remains elusive, it is worth trying since the mere cooperation of a few states leads to significant benefits for both the U.S. economy and the climate. These findings call on the U.S. to reconsider its withdrawal but also boost individual states to take initiative even in the absence of federal action.
Broader contextThe climate change deal reached through the Paris Agreement remains uncertain due to the potential withdrawal of the U.S., which could trigger a domino effect in other nations. This calls for new mechanisms to enable a resilient cooperative response to climate change mitigation at a global level. Here we propose an approach to aid future negotiations based on the optimal quantification of the benefits of cooperation and their fair distribution among the parties involved. The approach proposed was applied to the U.S. Clean Power Plan to elucidate the value of cooperation when reducing U.S. carbon emissions from the power sector. We find that, even with only a few states cooperating, significant economic and environmental benefits can be attained. A fair sharing of the cooperation dividends allows all states to benefit economically, which may act as a compensation mechanism to spur collective action. Our approach may contribute to strengthen transboundary cooperation and to maintain the momentum in global climate change action. |
Introduction
Climate change has been in the international political agenda as a collective commitment since the United Nations Framework Convention on Climate Change entered into force more than twenty years ago.1 Despite the efforts made so far, coordinating global actions on climate change mitigation and identifying solutions that satisfy a diverse group of stakeholders is still a major challenge facing the world today.2–8 The standard negotiation approach of defining regional and national targets, reflecting a ‘fair’ allocation of responsibilities among the countries involved, has thus far proved ineffective.9–11 Some of the main obstacles in reaching global agreements have been the conflicting interests and competing priorities of different countries, which in turn have determined their willingness to act towards mitigation of climate change.2 As a result, the agreed mitigation strategies might not be the most effective but simply those capable of achieving consensus.Recently, the U.S. announced its withdrawal from the 2015 Paris Climate Agreement, arguing that it was unfair for the U.S. economy. To tackle climate change more successfully12–17 and avoid domino effects of other countries potentially pulling out of the Agreement, alternative approaches will be needed. In this contribution, we argue that quantifying the benefits of cooperation and sharing them fairly through compensation mechanisms could provide a basis for more effective mitigation agreements, allowing implementation of the most cost-efficient technologies in the right places.12,18,19
To demonstrate how the proposed approach would work, we apply it to the U.S., as an illustrative case of a multi-state region which could be extrapolated at the global level. Action to mitigate climate change remains a controversial topic with high political polarisation in the U.S. Here, we aim to provide sound scientific evidence of the benefits of cooperation in climate change mitigation that could be used in ongoing discussions. Specifically, we quantify the benefits of adopting a centralised global action to reduce CO2 emissions for different levels of cooperation among states using the targets defined in the Clean Power Plan20 (CPP), one of the main elements of the Obama Administration's strategy for meeting the U.S. Paris commitments. The CPP was enacted by the Environmental Protection Agency (EPA) on the 3rd August 2015 and has been the U.S. flagship programme in climate change mitigation until the 28th March 2017, when the current Administration issued an Executive Order21 to review the rule so as to suspend, revise or rescind the CPP.22 As a result of this review, the new Administration has decided to repeal the CPP, which has raised the question of whether the U.S. might still be able to meet its commitments made under the Paris Agreement. Essentially, the CPP aimed to curb CO2 emissions from the power sector by 35% from 2012 baseline levels by establishing individual CO2 emissions targets for 47 out of 50 states (Alaska, Hawaii and Vermont are excluded). The targets, which varied greatly across the states, were based on the capacity of each state to implement three mitigation strategies, namely, switching from coal to natural gas power plants; increasing the share of renewables; and improving plant and heat-rate efficiency. The CPP followed the so-called “production-based” approach to climate change mitigation, which considers only direct CO2 emissions, as opposed to a “consumption-based” method whereby both direct and indirect emissions in the supply chain are taken into account; the latter are also referred to as “embodied” or “cradle to grave” emissions. With the CPP being rescinded, it is timely to investigate how its targets could be attained while benefiting the U.S. economy, the claim to the opposite being the main reason for its withdrawal. This is important not only because the U.S. is the second global emitter of GHG emissions,23 but also because modernising the ageing U.S. power system in a cost-effective manner can provide a robust and resilient response to the transformation challenges ahead (e.g. distributed generation, cybersecurity).24 In this context, elucidating the value of cooperation at local and regional levels can potentially provide a roadmap on how to tackle more complex negotiations at the multi-national level, such as the Paris Agreement.
Emissions reduction cooperation model
To carry out our analysis, we rely on mathematical programming techniques (also known as optimisation) that aim to find the optimal solution of a model representing a complex problem by solving a set of mathematical equations. The model contains three main elements: first, an objective function whose value needs to be maximised or minimised; second, a set of constraints that the solution sought should satisfy; and third, decision variables whose values are unknown and have to be found to optimise the objective. The type of variables (i.e. continuous and/or discrete) and equations (i.e. linear and/or non-linear) determine the class of model. In this work, we developed a mixed integer linear programming model (MILP), referred to as ERCOM (Emission Reduction Cooperation Model). ERCOM is capable of identifying the most cost-effective ways of meeting the electricity demand while not exceeding the total CO2 emissions ceiling, in this case that imposed by the CPP. In short, given the electricity demand in each U.S. state, costs (power plant construction, operation, maintenance and connection to electricity grid) and CO2 emissions for each electricity technology and their potential location, ERCOM minimises the cost of electricity generation in the U.S. for the year 2030 (the CPP target year) considering different levels of cooperation among the states. Hence, the MILP model automates the screening of millions of partnership alternatives so as to ultimately identify the most cost-effective collective action towards carbon mitigation for a given level of cooperation. An outline of the model is provided next, while a detailed description of the mathematical formulation, data and assumptions is given in Section 1.2 of the ESI.†In essence, ERCOM contains standard equations to model the energy system designed to meet specific reliability of electricity supply together with a set of constraints that enable the assessment of the benefits of cooperating when implementing CO2 abatement strategies. In the non-cooperative approach, each region is forced to keep its emissions below a specific regional limit, in this case based on the CPP targets for each state. This can be expressed in compact form as follows:
 | (1a) |
 | (1b) |
 | (1c) |
 | (1d) |
In the cooperative approach, emissions limits can be met either in cooperation or individually. More precisely, by sharing emission targets, each region is allowed to emit above its quota of emissions as long as others compensate for these extra emissions. This multi-regional cooperative approach can be modelled in a simplified manner as follows (see Section 1.2 in ESI† for details on the original formulation of ERCOM):
 | (2a) |
 | (2b) |
 | (2c) |
 | (2d) |
| Aijxij + Bjyj ≤ aij ∀i ∈ I, j ∈ J | (2e) |
x ∈ ![[Doublestruck R]](https://www.rsc.org/images/entities/char_e175.gif) , y ∈ {0,1} , y ∈ {0,1} | (2f) |
Essentially, ERCOM identifies the most cost effective collective action towards carbon mitigation for different levels of cooperation, each entailing different numbers of regions cooperating in partnerships (from the case in which regions act independently from each other, CS = 0, to the case where all cooperate, CS = |J|). The model determines optimal capacities of electric power technologies in each state, inter-state electricity flows (note that inter-state transmissions are only allowed between states within the partnership) and electricity trades with Canada required to potentially meet each state's power demand in 2030 considering region-specific abatement curves for each state (see Section 1.2.2 of the ESI† for a detailed description of the data). The following electricity sources are considered in the model: coal, natural gas (including carbon capture and storage, CCS, for both), nuclear, hydro, solar, wind, geothermal and biomass. Potential use of each resource is limited by its regional availability, but the model allows an exchange of fossil fuels and biomass among states. The reliability of supply is ensured by identifying an optimal mix of base-load and intermittent technologies. The cooperation between the states is established through electricity trading and sharing of their emission targets, allowing one state to exceed its target as long as another offsets its emission excess. By establishing cooperation among states, the model can exploit regional abatements costs, thereby identifying solutions that are more efficient globally. In this way, ERCOM goes beyond other energy systems optimisation models, such as MARKAL/TIMES, NEMS and SWITCH,25–29 to explore the gains of tackling climate change mitigation through cooperation. Note that the motivation for cooperation extends beyond pure economic interests and emissions concerns. Hence, ERCOM could account for alternative criteria embracing other environmental impacts (e.g. damage to human health, biodiversity loss, etc.), social aspects (e.g. jobs created, labour compensation, reliability and energy security concerns). Without a loss of generality, ERCOM considers only costs and emissions, focusing the analysis and interpretation of optimal solutions on the value of cooperation. As far as we are aware, this is the first time such an approach has been proposed.
Results and discussion
Benefits of increasing cooperation
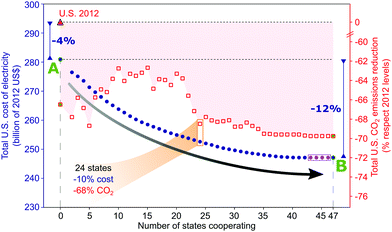
We consider a complete range of optimal solutions to explore the benefits of inter-state cooperation, from no cooperation to full cooperation among all the states. In the case of no cooperation, the states act independently from each other, with no trade of electricity among them and each aiming to meet independently the individual emissions reduction target set by the CPP. In this instance, the electricity generation costs are minimised in each state separately. This leads to solution A in Fig. 1, with the total cost of electricity generation in 2030 across all the states being 4% below the actual cost in 2012, despite a 15% higher demand. The total reduction in CO2 emissions is almost double the overall U.S. CPP reduction target: 67% vs. 35%. This is achieved by exploiting the economic competitiveness of low-carbon options30–32 which allows curbing of CO2 emissions while decreasing the overall costs. Further details on this solution can be found in Section 2.1 in ESI.†At the other end of the scale, we consider cooperation of all the states through electricity trade and emissions sharing, therefore forming a global partnership. In this case, instead of focusing on the individual states and their emission targets, we consider that the U.S. acts as a whole coordinated entity to minimise the total electricity costs, subject to the overall CO2 reduction target of at least 35% at the country level. The calculated optimal solution is denoted by point B in Fig. 1. As shown, the electricity cost is reduced by 12% compared to solution A, equivalent to a saving of more than US$33 billion per year. Compared to the actual costs in 2012, the saving amounts to billion US$46 per year; these savings are discussed further in the next section. Thus, full cooperation guided by optimisation tools such as ERCOM can bring enormous benefits to a national economy, leading to the most cost-effective reduction of CO2 emissions from the electricity sector. Indeed, the savings attained are of the same order of magnitude as the expected combined benefits that the implementation of CPP would bring through mitigation of climate change and avoidance of related health impacts, estimated between US$26 and US$45 billion in 2030.20 In addition to the costs reduction, the overall CO2 emissions are decreased far beyond the 35% target – 70% compared to the base line year. Furthermore, in the case of no-cooperation, CO2 emissions are reduced by a further 3%. These findings show that, contrary to the claims of the Trump Administration, pursuing climate change mitigation can bring significant benefits not only for the climate but also for the U.S. economy.
We then calculate optimal solutions involving the cooperation of different number of states, obtaining the cooperation curve depicted in Fig. 1. At first, the total electricity cost drops considerably with a small number of states involved in cooperation (∼10) and then continues to decline marginally up to the point where 43 states are cooperating (see the cooperation curve in Fig. 1). Beyond this point, involving the remaining four states (depicted with purple dots in Fig. 1) in the global U.S. partnership incurs no further cost or emission benefits – while they may still participate formally in the electricity trade and emission sharing, in practice they behave independently so neither extra economic or environmental benefits are attained. The cooperation curve divides the search space into two regions, providing a lower bound (i.e. minimum limit) on the total cost that could be attained when a given number of states cooperate. The region below the curve is therefore empty where no feasible solutions exist that entail lower cost than the ones on the curve. The region above the curve contains feasible solutions but they are suboptimal compared to those on the curve. These suboptimal solutions would eventually emerge from decentralised negotiation schemes that may converge towards a Nash equilibrium entailing a certain level of cooperation.14,15,33
Implications for electricity supply
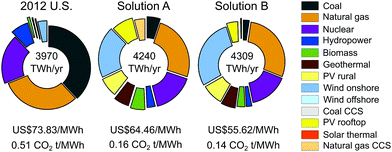
Depending on whether an individualist or a cooperative approach is followed, the optimal U.S. electricity supply system would be different since each approach entails specific compliance options. In solution A, no cooperation is allowed and states would be forced to meet their CPP target individually only by switching to cleaner energy mixes. In solution B (i.e. global U.S. partnership), states are allowed to share targets and exchange electricity which allows for exploiting region-specific abatement costs and availabilities of low-carbon and low-cost sources. Broadly speaking, in both solutions A and B, coal-fired power plants would be almost entirely phased out and natural gas and wind power would become the predominant sources of electricity. At the same time, generation from other renewable sources would be increased while nuclear capacity would be kept constant as specified in the CPP. Overall, the share of renewable sources would increase substantially, contributing 47% of the total U.S. electricity demand in 2030 for solution A and 53% for solution B (Fig. 2).Despite similar U.S. electricity portfolios in A and B, the latter entails lower costs and emissions from electricity generation mainly because cooperation allows deploying further low-cost and zero-emitting wind onshore (i.e. 29% in B comparing to 20% in A of the total electricity generation). Conversely, in solution A, more coal, natural gas with CCS and biomass would be required to ensure the system reliability due to the intermittency of wind and solar power used in some states (see Section 2.1 in ESI† for a breakdown by state of the cost-optimal electricity system in solution A). As a result of the compliance advantages emerging from the cooperation, the global U.S. levelised cost of electricity (LCOE) in solution B would be further reduced to US$55.6 per MWh compared to US$64.46 per MWh in solution A; while the global U.S. carbon intensity would be 0.14 CO2 t per MWh in solution B compared to 0.16 CO2 t per MWh in solution A.
Further analysis of solution B shows the implications of full cooperation at the state level (Fig. 3). The breakdown of the global U.S. partnership reveals that, although coal electricity would be displaced in most states (from 38% of the total U.S. electricity generation in 2012 to 2% in 2030), it would remain constant in six states (Arkansas, Wyoming, North Carolina, Tennessee and North and South Dakota), where it would be used to back up the intermittent wind and solar PV. Other states would rely on natural gas and nuclear, which would represent 52% and 24% of the total base-load generation. Natural gas would become the predominant source (more than 80%) in some north-eastern states, such as Rhode Island, Connecticut, Massachusetts, New Jersey, New York and New Hampshire. Nuclear installed capacity would be kept constant in all states, as specified in the CPP, and would represent all the electricity generated in Pennsylvania and almost all (more than 85%) in Michigan, Wisconsin and Virginia. Overall, electricity from renewable sources would supply 53% of the U.S. power needs in 2030, with onshore wind and solar PV generation increasing substantially in many states. Solar PV would grow in Florida, Nevada, Colorado, Utah, Minnesota and Delaware to provide more than one third of their total generation. Onshore wind would be installed in 26 states and become the dominant source of power in Washington, New Mexico, Texas, Oklahoma, Indiana, Maine, Missouri, West Virginia, South Dakota, Nebraska and Wyoming. Additionally, geothermal resources would be exploited in Western states (California, Arizona, Colorado, Idaho, Montana, New Mexico, Nevada, Utah, Washington and Wyoming), while biomass would be deployed in Louisiana, Mississippi, Tennessee, Georgia and South and North Carolina. Concentrated solar thermal would be installed in South Dakota, reaching 10% of the total share, and to a much lesser extent in Florida (less than 1%). The model decides in turn to rule out offshore wind and both coal and natural gas with CCS, which are at present economically less competitive than the other options.
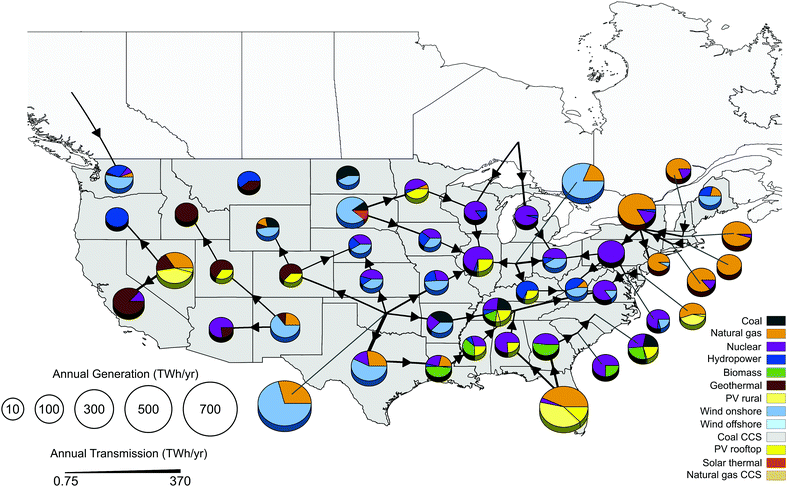 | ||
| Fig. 3 Geographical breakdown of the U.S. cost-optimal electricity system in 2030 for solution B (full cooperation in Fig. 1). The size of the pie charts is proportional to the electricity generation in each state (TWh per year) whereas the slice colours denote the technology and the slice sizes represent the associated percentage share. Arrows illustrate the electricity trade between the U.S. states and Canada, with their thickness proportional to the amount of electricity traded. | ||
Analysing the electricity trade, four groups of states would emerge: (i) states that would export electricity without importing it (e.g. Florida, Oklahoma, South Dakota, Nevada and Indiana); (ii) states that would import electricity without exporting (e.g. Arizona, California, Illinois and New Jersey); (iii) states that would export and import electricity (e.g. New York, Pennsylvania, Tennessee and Texas); and (iv) states not trading electricity at all (like Maine, Montana and North Dakota, which would satisfy their demand with domestically generated electricity). Furthermore, Washington, Michigan and Wisconsin would import hydro-electricity from Canada. In total, four states would act as key suppliers providing clean and low-cost electricity: Oklahoma and Indiana would increase their generation substantially to provide wind-based electricity while Florida and Nevada would do the same providing solar-rich electricity.
Note that the cost-optimal cooperative solution shown in Fig. 3 should be understood as a roadmap to guide the most cost-effective path for the transition to a low-carbon electricity sector. Coordinating where and how much infrastructure needs to be built would require further discussions with relevant stakeholders, considering economic, political and social concerns; this is beyond the scope of this paper.
Implications for carbon mitigation
In the absence of cooperation, switching to low-carbon electricity options is the only strategy that can reduce carbon emissions, while in the cooperation approach, cross-border imports of electricity and sharing of the emissions cap are also allowed. These mitigation strategies are implemented in solution B. As shown in Fig. 4, the majority of the states would reduce their carbon intensity (41 out of 47) and become net importers of electricity (31), while only a few (11) would emit above their CO2 target and rely on burden sharing to offset their emission excess. For example, Kentucky would reduce its carbon intensity by 100%, while others, such as New Jersey, would increase its carbon intensity by 78%. Analysing the cross-border electricity flows, some states would emerge as net exporters of electricity while others would be net importers. For instance, Oklahoma would be a net exporter that sells a total of 596 TWh of electricity to Kansas, Colorado, Texas, Missouri and Arkansas, whereas Texas would be a net importer that would purchase more electricity from Oklahoma (328 TWh) than it would sell to Louisiana (102 TWh, a net balance of −226 TWh). The analysis of the emissions reveals that Texas, California, Pennsylvania and Ohio would reduce their territorial emissions beyond their CPP target in order to offset those in the states that exceed theirs (e.g. New York, Oklahoma, Nevada and Florida). This reduction in emissions would not necessarily imply deploying a low-carbon electricity mix, since it could also be the result of reducing electricity generation. The latter would happen in New Jersey, which would increase its carbon intensity by deploying more natural gas (from 44% to 93%) – selected due to its economic competitiveness – but would offset this by decreasing its total domestic electricity generation by almost 20%. In practice, most states would rely on a combination of mitigation strategies. Texas, for instance, would emit below its original CPP target by becoming a net importer of electricity and by implementing a lower-carbon mix. On the contrary, New York would implement a more carbon-intensive mix and become a net exporter of electricity, but would offset its excess of emissions by sharing its carbon burden. Ultimately, all these strategies would give rise to an imbalance between states emitting below or above their CPP targets, where the overall emissions at the U.S. level would be finally reduced by 70%, instead of the required 35%. Compared to the no cooperation model (solution A in Fig. 1), the overall annual reduction in emissions would amount to 66 Mt CO2. This reduction would be attained because increasing the share of low-carbon technologies would be economically appealing, despite requiring a base-load capacity to ensure system reliability when intermittent renewables would be used.30–32 Thus, these results show that the most cost-effective mitigation pathway, emerged from the centralised approach, would ultimately lead to state emissions levels which are totally different from the original targets proposed by the CPP (some states would exceed their original limit while others would compensate for these extra emissions). In addition to this mismatch, there would also be cost implications that are discussed in more detail in the next section.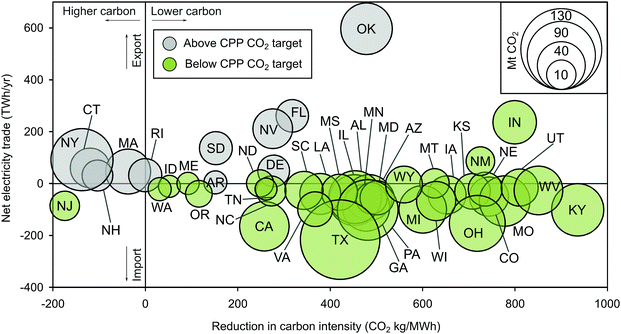 | ||
| Fig. 4 State mitigation strategies under full cooperation (solution B in Fig. 1). Each bubble corresponds to one state, for which three values are shown: (i) the reduction in carbon intensity relative to the baseline year of 2012 (x-axis); (ii) the net electricity trade (y-axis) (the values for (i) and (ii) are represented by the centre of the bubble); and (iii) the difference in emissions between the CPP target and solution B (denoted by the size of the bubble, with the grey bubbles representing the states emitting above their CPP target and the green the states with the emissions below their target). | ||
Implications for costs
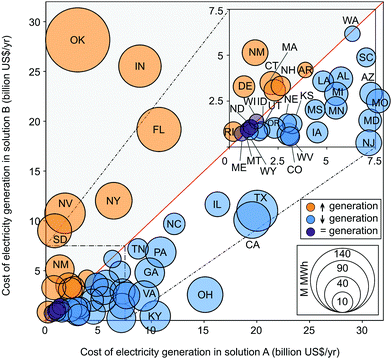
We next analyse in detail the distribution of economic efforts resulting from the multiple patterns described previously. To this end, we compare the electricity costs in solutions A and B for every U.S. state (Fig. 5). Thirty states would benefit when moving from A to B, while 14 would be penalised and only three (Montana, North Dakota and Wisconsin) would experience no change. Oklahoma would be the most penalised state when moving from an individualist strategy towards the global U.S. partnership. It would increase its electricity generation by a factor of nine, mainly by deploying a substantial capacity of onshore wind (70% of the electricity portfolio) to supply electricity to neighbouring states. This is due to its significant wind potential (best capacity factor among all states), which would allow the state to provide low-cost and zero-emitting electricity to satisfy the demand of other states. Similarly, Florida and Nevada would also incur extra costs because they would have to increase their electricity generation so as to exploit their solar potential and provide low-carbon power to neighbouring regions. Unlike these states, Texas, California, Kentucky and Ohio would import part of their electricity to satisfy their demand, thereby reducing their investment in domestic facilities. In particular, Ohio would be the state benefitting the most, reducing its generation by six-fold by importing most of its electricity demand. On the other hand, Maine would generate the same amount of electricity in solutions A and B, but it would lose out in the cooperation because it would require replacing natural gas by more expensive onshore wind. By doing so, part of the natural gas potential in Maine would then be used in other states which would otherwise incur a higher levelised cost of electricity (LCOE).As can be seen, under full cooperation some states would benefit by joining the global U.S. partnership and would therefore be willing to collaborate; however, others would be penalised and would require incentives to prevent them from leaving the global partnership.
Sharing of cooperation benefits
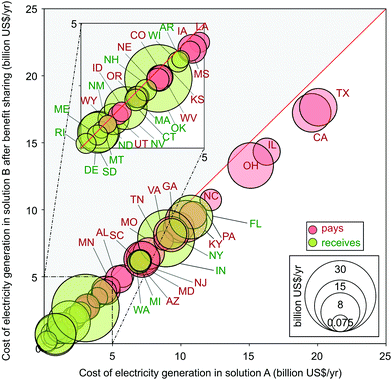
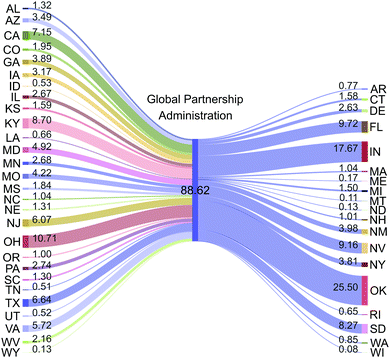
The global U.S. partnership would entail an uneven distribution of efforts that might deter the penalised states from participating. Appropriate mechanisms and policies would be therefore required to incentivise cooperation and avoid missing the significant potential benefits of cooperating. These benefits should be shared in a fair manner among all states in order to engage them in a collective action. To harmonise the benefits of participating in the global partnership, each part could receive the same dividend according to the equality principle. Following this premise, costs in the cooperation would be redistributed in such a way that each state would achieve the same cost reduction when transitioning from solution A (individual) to B (cooperative), which in this case corresponds to a 12% cost reduction. This rule is illustrated in Fig. 6, which can be derived from Fig. 5 after allocating the overall 12% of cost reduction among the U.S. states.As seen, after splitting the cooperation dividends, all states would benefit in the global partnership (all states would lie below the diagonal). As an example, in solution A, Oklahoma would incur a cost of US$3.01 billion per year, while in solution B its cost would be US$2.66 billion per year, that is, 12% cheaper. Obviously, the new distribution of costs would require establishing transfer payments between states originally benefitting and being penalised, respectively, when cooperating (Fig. 7). Particularly, 28 states would have to contribute to the global partnership (i.e. payments to the central partnership administration), while 19 states would receive compensation payments (i.e. receive payments from the central administration). Within the first set of states, we would find Ohio, deemed as the state benefiting the most from the cooperation, that would have to contribute to the partnership with US$10.7 billion per year, resulting in a final total cost of US$13.3 billion per year (12% lower than its cost in the individualist strategy). Conversely, Oklahoma, the most penalised state in the global partnership, would receive US$25.5 billion per year. To ensure a fair and reliable process, these compensation payments should be managed by the centralised U.S. partnership administration via tailored financial mechanisms.
Alternative sharing schemes could be applied based on additional fairness principles besides equality (e.g. equity, proportionality, capacity),34,35 which would further assess the contributions made by each state, both as a producer and a consumer (see ESI,† Section 2.2 for further discussion on this topic). Designing a sharing scheme perceived as “fully fair” by all participants might be extremely hard and further complicated by the fact that these alternative sharing schemes could incorporate other additional benefits (e.g. jobs creation, energy security and tax revenue) and environmental impacts (e.g. land use, water scarcity and deforestation), in addition to climate change.36
Cooperation benefits under uncertainty
All the calculations discussed previously were repeated considering the main uncertainties present in the ERCOM model in order to assess their impact on the outcome of the optimisation. To this end, ERCOM was solved iteratively for different potential values (scenarios) of the uncertain parameters (e.g. future electricity demand, capacity factors, potential of each electricity technology, etc.), which were modelled using probability distributions and sampling methods. The additional results of this sensitivity analysis, discussed further in Section 3 of the ESI,† show that benefits from cooperation are always high regardless of the scenario analysed, with the cost savings ranging between 11.5% and 17.9% compared to the individualist approach, and the emissions reduction between 43% and 74% with respect to 2012 levels.Conclusions
The current global context calls for advanced mechanisms to optimise collective actions and articulate cooperation in climate change mitigation. In an ideal world, centralised solutions would be implemented and globally optimal decisions made for the sake of the common action against climate change. In a real world, many conflicting interests exist and consensus must be reached at the expense of global optimality. We envision herein a scheme underpinned by optimisation tools to aid climate change mitigation in a more cost-effective and transparent manner. Following this approach, a centralised globally optimal solution would be first determined to make individual states aware of the potential benefits of cooperating among them. The opportunity cost of sacrificing global optimality, properly quantified via rigorous tools, should become a major driver to spur cooperation among states. In a second step, the global cooperation benefits should be shared in a fair manner among the parties involved, providing a basis to kick off negotiations for the joint carbon mitigation action.We applied this approach to a U.S. policy originally aimed at reducing carbon emissions from electricity generation but currently being withdrawn – the Clean Power Plan – to demonstrate how the emission targets could be met while attaining significant reductions in costs, thereby potentially boosting the U.S. economy. This could be accomplished via cooperation, even at low levels of engagement; for example, a 10% reduction in cost would be achieved with only half of the states cooperating while leading to emission reductions nearly double the overall CPP target (68% compared to 35%). Benefits from cooperation would result from sharing emission limits and trading electricity, both of which would lower the abatement costs by implementing the best technologies in the best locations.
The uneven distribution of territorial capacities, which constitutes the basis of the overall cooperation gains, would entail also an asymmetric distribution of efforts, where some states would be economically penalised when moving from an individualist strategy to a cooperative one. Hence, the collective gain of cooperation, albeit necessary, would not be self-sufficient to ensure the participation of all the parties involved. A fair sharing of the cooperation dividends may act as a compensation mechanism to spur the collective action towards carbon mitigation since all states would benefit by joining the global partnership, therefore making such move appealing for all of them. Further analysis of the globally optimal solution could be carried out including production-based and consumption-based data as well as socio-economic benefits and environmental impacts. In reaching an agreement, states should be flexible and understand that no perfect sharing mechanism might exist that can satisfy fully all the regions involved. Hence, efforts should focus on finding “reasonable” sharing schemes based on optimised solutions where all can benefit from cooperating.
Despite the savings in cost and emissions derived from cooperation, among other potential benefits, translating agreements into practical actions might still be challenging due to the existence of multiple stakeholders with conflicting goals and a wide range of disparate regulations at the regional level. A centralised authority could aid the process by establishing a common harmonised regulatory framework that would align the interests of private and public bodies while being consistent with the optimal roadmap identified via optimisation.
This work thus opens new avenues to develop customised schemes to aid carbon mitigation negotiations. Regardless of the approach followed, we have clearly illustrated that optimised solutions and sharing of the cooperation dividends in a fair manner should be key ingredients in any process aiming at reaching mutually beneficial collective agreements. We show here that we do have the tools available to quantify such benefits in an objective, clear, systematic and transparent manner, and that the potential benefits of cooperation can be significant and fully justify the efforts spent in finding agreements.
Overall, the CPP and similar initiatives for coordinating efforts against climate change in different countries (e.g. Five Years Plans in China, the Brazilian National Plan on Climate Change, the Clean Energy Plan in Australia, the National Climate Change Response Green Paper in South Africa, or the Climate Change Act in the United Kingdom) offer a unique opportunity to test, validate and refine approaches like the one envisioned here, which could ultimately be used at the international level to tackle greater coordination challenges, such as the Paris Agreement.
Today, there seems to be a general scientific consensus on the need to undertake stronger actions against climate change in the short term. In this contribution, we leave aside the controversial politicisation and polarisation of this topic in the U.S. and focus on providing sound scientific evidence of the potential benefits of curbing emissions through cooperation following optimised roadmaps generated with rigorous mathematical tools. These results might trigger further fruitful discussions on climate change mitigation and open a deeper debate on whether the U.S. Administration should reconsider its decision to withdraw from the Paris Agreement and join again the partnership for global climate action. Even if full cooperation remains elusive, our proposed approach demonstrates that cooperation of only a few parties can lead to significant economic and environmental benefits which may entice more states to join the new U.S. Climate Alliance, whose members pledge to take climate action regardless of what the federal government decides.
Conflicts of interest
There are no conflicts to declare.Acknowledgements
G. G.-G. thanks the Spanish Ministry of Education and Competitiveness (CTQ2016-77968-C3-1-P, MINECO/FEDER) for the financial support received. C. P., G. G.-G. and N. M. D. thank the financial support from NERC – Natural Environment Research Council (PSD202).References
- UNFCCC, United Nations Framework Convention on Climate Change – 20 Years of Effort and Achievement Key Milestones in the Evolution of International Climate Policy, http://unfccc.int/timeline/, accessed 11 July 2017.
- S. Hallegatte, J. Rogelj, M. Allen, L. Clarke, O. Edenhofer, C. B. Field, P. Friedlingstein, L. van Kesteren, R. Knutti, K. J. Mach, M. Mastrandrea, A. Michel, J. Minx, M. Oppenheimer, G.-K. Plattner, K. Riahi, M. Schaeffer, T. F. Stocker and D. P. van Vuuren, Nat. Clim. Change, 2016, 6, 663–668 CrossRef.
- R. O. Keohane and D. G. Victor, Nat. Clim. Change, 2016, 6, 570–575 CrossRef.
- T. M. Lenton, Nat. Clim. Change, 2014, 4, 14–15 CrossRef.
- T. Sandler, Global Collective Action, Cambridge University Press, 2004 Search PubMed.
- R. C. Schmidt, Nat. Clim. Change, 2015, 5, 10–12 CrossRef.
- A. Tavoni, Nat. Clim. Change, 2013, 3, 782–783 CrossRef.
- N. S. Lewis, Energy Environ. Sci., 2016, 9, 2172–2176 CAS.
- G. Hardin, J. Nat. Resour. Policy Res., 2009, 1, 243–253 CrossRef.
- N. Höhne, M. den Elzen and D. Escalante, Clim. Policy, 2014, 14, 122–147 CrossRef.
- M. R. Raupach, S. J. Davis, G. P. Peters, R. M. Andrew, J. G. Canadell, P. Ciais, P. Friedlingstein, F. Jotzo, D. P. van Vuuren and C. Le Quere, Nat. Clim. Change, 2014, 4, 873–879 CrossRef CAS.
- O. Bahn, A. Haurie, S. Kypreos and J.-P. Vial, Environ. Model. Assess., 1998, 3, 107–115 CrossRef.
- D. H. Cole, Nat. Clim. Change, 2015, 5, 114–118 CrossRef.
- P. K. Dutta and R. Radner, Proc. Natl. Acad. Sci. U. S. A., 2004, 101, 5174–5179 CrossRef CAS PubMed.
- J. Heitzig, K. Lessmann and Y. Zou, Proc. Natl. Acad. Sci. U. S. A., 2011, 108, 15739–15744 CrossRef CAS PubMed.
- R. Smead, R. L. Sandler, P. Forber and J. Basl, Nat. Clim. Change, 2014, 4, 442–445 CrossRef.
- M. Z. Jacobson, M. A. Delucchi, G. Bazouin, Z. A. F. Bauer, C. C. Heavey, E. Fisher, S. B. Morris, D. J. Y. Piekutowski, T. A. Vencill and T. W. Yeskoo, Energy Environ. Sci., 2015, 8, 2093–2117 CAS.
- T. Unger and T. Ekvall, Clim. Policy, 2003, 3, 279–294 CrossRef.
- L. Petrosjan and G. Zaccour, J. Econ. Dyn. Control, 2003, 27, 381–398 CrossRef.
- EPA, Clean Power Plan for existing Power Plants. Environmental Protection Agency, 2015.
- Exec. Ord. No. 13783, Executive Order No. 13783 ‘Promoting Energy Independence and Economic Growth’ (March 4, 2017), 2017.
- 82 FR 16329, Announcement of review of the Clean Power Plan. Federal Register Volume 82, Issue 63(April 4, 2017), 2017.
- European Commision-Joint Research Center, GHG emissions time series 1990–2012 per region/country, 2014.
- DOE, Department of Energy of the United States of America. Quadrennial technology review. An assessment of energy technologies and research opportunities, 2015.
- M. Fripp, Environ. Sci. Technol., 2012, 46, 6371–6378 CrossRef CAS PubMed.
- R. Loulou, G. Goldstein and K. Noble, Documentation for the MARKAL Family of Models, Energy Technology Systems Analysis Programme, 2004.
- J. Nelson, J. Johnston, A. Mileva, M. Fripp, I. Hoffman, A. Petros-Good, C. Blanco and D. M. Kammen, Energy Policy, 2012, 43, 436–447 CrossRef.
- US Energy Information Administration, The Electricity Market Module of the National Energy Modeling System: Model Documentation Report No. DOE/EIA-M068, 2011.
- H. Safaei and D. W. Keith, Energy Environ. Sci., 2015, 8, 3409–3417 Search PubMed.
- NREL, National Renewable Energy Laboratory. Renewable Electricity Futures Study Report No. NREL/TP-6A20-52409, 2012.
- A. E. MacDonald, C. T. M. Clack, A. Alexander, A. Dunbar, J. Wilczak and Y. Xie, Nat. Clim. Change, 2016, 6, 526–531 CrossRef.
- C. F. Heuberger, I. Staffell, N. Shah and N. Mac Dowell, Energy Environ. Sci., 2016, 9, 2497–2510 CAS.
- P. J. Wood, Ann. N. Y. Acad. Sci., 2011, 1219, 153–170 CrossRef PubMed.
- L. Ringius, A. Torvanger and A. Underdal, Int. Environ. Agreements, 2002, 2, 1–22 CrossRef.
- R. A. Phillips, Bus. Ethics Q., 1997, 7, 51–66 CrossRef.
- A. Laurent and N. Espinosa, Energy Environ. Sci., 2015, 8, 689–701 Search PubMed.
Footnote |
| † Electronic supplementary information (ESI) available: Containing methods, supplementary results and sensitivity analysis of the results. See DOI: 10.1039/c7ee02278f |
| This journal is © The Royal Society of Chemistry 2018 |

