Non-invasive analysis of stored red blood cells using diffuse resonance Raman spectroscopy
Rekha
Gautam
 a,
Joo-Yeun
Oh
b,
Rakesh P.
Patel
b and
Richard A.
Dluhy
 *a
*a
aDepartment of Chemistry, University of Alabama at Birmingham, Birmingham, AL 35294, USA. E-mail: rdluhy@uab.edu; Fax: +1 (205) 934-2543; Tel: +1 (205) 975-5381
bDepartment of Pathology and Center for Free Radical Biology, University of Alabama at Birmingham, Birmingham, AL 35294, USA
First published on 23rd July 2018
Abstract
A method to acquire the Raman spectra of sub-surface components using diffusely focused radiation in a microscope sampling configuration is described. This procedure generates Raman scattering at various sample depths by producing a converging beam at the back aperture of the objective lens. This method requires illumination of the sample with a defocused laser, while simultaneously increasing the number of CCD pixels that are binned along the spatial axis of the detector. We applied this diffuse sampling method to the analysis of stored red blood cells (RBCs). During storage, biochemical changes to RBCs occur (the “storage lesion”). However, there are no existing non-invasive methods to assess this. We evaluated the instrumental parameters needed to maximize the diffusely scattered signal, including pixel binning, slit width, and bandwidth. We demonstrated the effectiveness of this diffuse resonance Raman spectroscopy (DRRS) method by detecting RBCs through a blood bag segment (1 mm wall thickness). We directly compared the DRRS method to the more common stand-off Raman spectroscopy (SORS) method using both 633 nm and 785 nm excitation. Time-dependent DRRS spectra were used in a multivariate model for classification of RBCs in polymer segments by storage age. Young (6–8 day) RBCs were differentiated from old (35–40) RBCs with 100% sensitivity and 98.5% selectivity. These data indicated that DRRS is a promising, non-invasive technique for acquiring the spectra of sub-surface components, and is particularly applicable when the underlying sample can be resonantly enhanced.
Introduction
Conventional Raman sampling geometries generally collect the scattered radiation from the surface of the sample, or from portions of the sample close to the surface, limiting access to deeper sample sections. Over the last decade, novel Raman sampling methodologies have been reported that allow for the study of deeper, sub-surface components. This technique, known as spatially offset Raman spectroscopy (SORS), enables the detection of chemically-specific spectra from sample interiors.1–3 SORS has become a principal method used to collect sub-surface Raman spectra, and has influenced the development of a family of other techniques that are able to acquire Raman spectra through optically opaque barriers, including transmission Raman spectroscopy (TRS), universal multiple angle Raman spectroscopy (UMARS), off-confocal Raman spectroscopy (OCRS), and frequency offset Raman spectroscopy (FORS).4–7SORS incorporates a lateral offset between the points of laser focus and scattered light collection on the sample surface, thereby allowing the Raman scattered photons arising from mm-deep layers to be collected as they diffusely migrate to the surface at a distance removed from the incident focal point.8,9 An adaptation of SORS, known as micro-SORS, has also been described for depth profiling of sub-surface layers in turbid media in the range of 10's–100's of μm.10–13 Micro-SORS measures spectra at various sample depths by moving the sample away from the focusing objective in the vertical (not lateral) direction. The displacement of the sample by a distance Δz along the microscope optical axis effectively defocuses the laser illumination, resulting in the collection of Raman scattered photons from sub-surface layers. Micro-SORS methods generally collect several types of spectra: a conventionally focused (Δz = 0) spectrum of the surface, as well as spectra of the sample interior (Δz > 0). Enhanced spectra of the sample interior can be generated by scaled subtraction of the surface spectrum from the defocused sub-layer spectra.13 The main limitation of the SORS techniques is that they are less applicable in the presence of highly absorbing or highly fluorescent samples, or if the surface layer has a large Raman cross-section.
Our interest in stand-off, non-invasive methods of spectral analysis arise from our recent studies using Raman to characterize storage-induced hemolysis in red blood cells (RBCs).14 Cold storage of RBCs leads to changes in the structural, biochemical, and metabolic parameters of RBCs, collectively referred to as the “storage lesion”.15,16 With time in storage at 4–6 °C, RBCs become more fragile, denser, produce microvesicles, and are more likely to hemolyse with release of free hemoglobin (Hb) and heme into the supernatant. These degraded blood products increase of toxicity associated with transfusion of stored RBCs.17,18 The therapeutic efficacy and safety of stored RBC transfusions remains a key problem in transfusion medicine.19 Current methods to evaluate stored RBC quality require invasive specimen collection from blood bag segments followed by biochemical processing. There are no existing non-invasive methods available to evaluate the state of RBCs within the blood bag after donation.
Over the years, Raman has established its applicability for the study of RBCs. For example, Raman has been used for screening single erythrocytes for malaria infection, discerning changes in Hb ligation, and oxidation and conformation state in RBCs from patients with sickle-cell disease and diabetes.20–22 Storage time-dependent changes in Hb oxygenation have been shown to track with morphological changes in the RBC structure, and lactate accumulation.23–25 To date, however, there have been no reports of methods for the non-invasive spectral analysis of the extent of RBC hemolysis within sealed blood bags during storage.
To address this issue, we propose the development of an approach using diffuse resonance Raman spectroscopy (DRRS) to study RBCs within sealed blood bags. A resonance enhancement to the Raman effect occurs when the photon energy of the laser excitation wavelength is closely matched to the energy of a molecular electronic transition.26 In these cases, vibrations associated with ligands at the chromophoric active site can be selectively enhanced, with resonance contributions to the Raman intensity as high as 106.27 Hb in RBCs were some of the earliest experimental examples used to illustrate the resonance Raman effect, and have been extensively studied.27,28 We recently showed that changes in the resonance Raman spectra of oxyhemoglobin (oxyHb) and methemoglobin (metHb) offer a new label-free modality to assess RBC hemolysis during cold storage.14
The DRRS method for detection of sub-surface constituents that we describe here incorporates two features: (i) illumination of the sample with a defocused, larger diameter laser beam, and (ii) inclusion of CCD (charge-coupled device) pixels adjacent to those pixels aligned with the optical path of the spectrometer to augment detection of the diffusely scattered photons. This method takes advantage of the principle that as the diameter of the defocused laser beam increases, and/or the numerical aperture of the focusing lens decreases, the penetration depth will increase. An advantage of this approach is that an increase in the diameter of the excitation laser reduces the photon density, which in turn reduces the potential risks of photodamage. Another advantage of this methodology is that it can be implemented on existing conventional Raman systems without significant instrumental modification.
The present study describes the development of DRRS to investigate the Raman spectral markers correlated with storage-dependent changes in RBCs. The data show that this method holds promise as a non-invasive method to evaluate the quality of RBCs as a function of storage time within blood bags, aiding in better inventory management of stored RBCs.
Materials and methods
Chemicals
Chloro(protoporphyrinato)iron(III) (Hemin) and NaOH were purchased from Sigma Aldrich (St Louis, MO). Milli-Q water (18 MΩ cm, Millipore Corp., Burlington MA) was used to prepare 10 mM hemin solution in 0.1 M aqueous NaOH. Blood-collection bags (4R1582) were purchased from Fenwal Inc. (Lake Zurich, IL).Human stored RBC collection and processing
Blood bag segments containing RBCs stored for 6–8 days (hereafter denoted as D7) or 35–40 days (denoted as D35) were collected from the University of Alabama at Birmingham (UAB) blood bank. All protocols were approved by the UAB Institutional Review Board (IRB) following guidelines for the protection of human subjects published by the US National Institutes of Health. Blood bag segments from nine donors (for each class, without donor identifiable information) were collected and analyzed to characterize RBCs as a function of storage time.Raman spectroscopy
Raman spectra were recorded using a Renishaw InVia micro-spectrometer (Renishaw Inc., West Dundee, IL). The excitation laser, either a 633 nm HeNe or 785 nm diode, was directed on to the sample using a 5× (NA = 0.12) objective. The system was calibrated to the 520.5 cm−1 line using an internal Si reference before acquiring the sample spectra. An external Si wafer placed on the microscope stage was used for optimization of instrument parameters.Background spectra of the blood bag and its segments were recorded using the empty segment/bag that was washed thoroughly with Milli-Q water using 633 nm, 5 mW power, with a 5× objective and 80 s (10 s × 8 accumulations) and 30 s (10 s × 3 accumulations) integration times respectively. Raman spectra of RBCs outside of the blood bag segment were obtained from a drop cast on a glass coverslip as previously described,14 using ∼0.5 mW power, 50× L objective and 15 s integration. DRRS spectra for RBCs inside the segment were recorded using 633 nm, ∼5 mW laser power, 5× objective and 30 s integration time. SORS spectra acquired at 633 nm were recorded at ∼5 mW power, 5× objective, 80 s integration time, and a 100 μm lateral offset. DRRS and SORS spectra acquired at 785 nm were recorded at ∼25 mW power, 5× objective, 80 s and 160 s integration times respectively, and a 200 μm lateral offset. A sample of the standard hemin solution was a drop cast onto a glass coverslip, and its spectrum was acquired using 633 nm, ∼0.5 mW power, a 5× objective, and 10 s integration Hemin solution (10 mM in 0.1 M NaOH) was placed in a washed, empty blood bag and DRRS spectra recorded through the polymer bag wall using 633 nm, 5 mW power, 5× objective, and 80 s integration.
Data preprocessing
Spectra were analyzed and plotted using Origin 2016 (Origin Lab Corporation, MA, USA). Multivariate analysis was carried out using the MATLAB (2016, Math Works, Inc., MA) version of PLS-Toolbox (v8.0 Eigenvector Research Inc., WA). First derivative and smoothing was done for all the spectra by the Savitzky–Golay (SG) method using a 2nd order polynomial with a 9 point data window. All spectra were normalized using the standard normal variate method and mean centered before applying multivariate analysis. Partial Least Squares-Discriminant Analysis (PLS-DA) was performed on the preprocessed data and the robustness of the model was verified by cross-validation using Venetian blinds algorithm with 10 data splits, which calibrates the classification model based on 90% of the data, tests the remaining 10% against that model, and repeats the process through ten iterations to assess its predictive power.Results and discussion
Adaptation of a Raman microscope to diffuse sampling
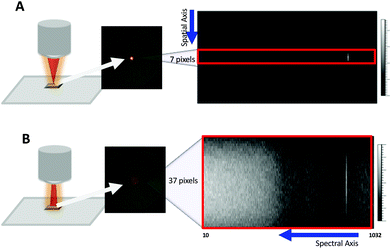
In its conventional configuration, the Renishaw InVia Raman microscope uses a beam expander to collimate and expand the input laser to a suitable diameter that fills the back aperture of the objective lens on the microscope body. For a 5× objective, this design generates a focused beam ∼25 μm in diameter at the sample (Fig. 1A). For initial design comparisons, we used ∼5 mW from a 633 nm HeNe and an external Si wafer at the sample focus. Under standard microscope sampling conditions, the scattering resulted in a ∼25 μm focused spot that occupied 7 pixels along the spatial axis of a 256 × 1040 CCD pixel array (Fig. 1A). These 7 pixels are binned together to generate a spectrum of the illuminated spot.In the Renishaw instrument, a second lens in the beam expander is configurable through a software-controlled motor. The position of this lens can be adjusted to focus the laser halfway to the microscope objective, thereby producing a converging rather than a parallel beam at the back aperture of the objective lens. This gives rise to a defocused spot ∼100 μm in diameter at the sample (Fig. 1B). This setting is normally used for global imaging to cover a larger area of the sample in a single measurement. Noticeably, the defocused spot covers ∼37 pixels along the spatial axis of the CCD (Fig. 1B). Coverage along the spectral axis is similar to the conventional focused beam setting.
Optimization of diffuse sampling parameters using RBCs in blood bag segments
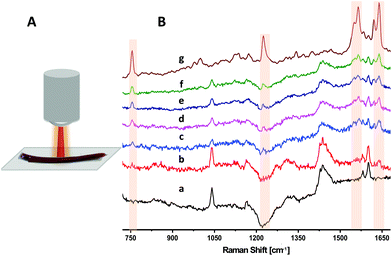
In order to avoid breaking the sterile barrier provided by the blood bag, blood from segments attached to the blood unit is often used for quality control procedures needed before transfusion. However, recent studies show that segment blood may not accurately represent overall blood bag contents, thus arguing for the development of non-invasive sampling methods.19,29Fig. 2 illustrates the DRRS spectra of RBCs inside a blood bag segment. Using a defocused excitation beam, we performed a series of experiments in order to optimize the instrumental parameters used to acquire the DRRS spectra. In these experiments, spectra were acquired using 633 nm excitation, ∼5 mW laser power, a 30 s integration time, with a fixed 50 μm slit. First, we optimized the number of CCD pixels used to collect the Raman scattering from the excitation beam. As shown in Fig. 1B, scattering from the defocused beam is spread to a larger number of pixels along the spatial axis of the CCD. Therefore, it was important to optimize the number of pixels to maximize the SNR while minimizing detector read-out noise. We collected spectra consisting of (i) the polymer blank, (ii) standard RBC spectra from outside the segment, and (iii) a series of DRRS spectra of RBCs from inside the segment that differed in the number of pixels binned. The number of pixels binned varied from 7 to 37.
Fig. 2B presents unprocessed Raman spectra of a blood bag segment acquired with different focusing and binning conditions. The top spectrum in Fig. 2B(g) reflects the Raman spectrum of an RBC drop acquired outside the segment, using conditions previously described.14 The strong bands that are highlighted at 755, 1225, 1545, 1565, 1620 and 1638 cm−1 are assigned to (pyrrole breathing) stretch (ν15), (CmH) in plane deformation (ν13), (CβCβ) stretch (ν11), (CβCβ) stretch (ν2), (Ca = Cb) of vinyl groups, and the (CαCm) asymmetric stretch (ν10) of Hb, respectively.20,21,23,30 The bottom spectrum in Fig. 2B(a) is that of the empty PVC segment. The major feature in this spectrum is the broad profile above 1425 cm−1, due to the unresolved CH2 scissoring vibration doublet in PVC, a major material component of the bag.31 Additional bands in the spectrum in Fig. 2B(a) at ∼1040, 1580 and 1600 cm−1 have been attributed to the phthalate plasticizer in PVC blood bags.24Fig. 2B(b) is the spectrum of a blood-filled segment acquired using conventional settings, i.e. a focused beam and 7 pixels binning. Under these conditions, the Raman spectrum is clearly dominated by the surface polymer bands. However, by using a defocused beam, sub-surface signals from the RBCs appear more prominently in Fig. 2B(c–f), demonstrating a deeper penetration of the diffused beam into the segment. Increasing the number of binned pixels from 7 (Fig. 2B[c]) to 37 (Fig. 2B[f]) results in an increase in the number of bands attributable to the RBCs in the segment, while suppressing the surface polymer bands, and increasing the signal-to-noise ratio (SNR) of the resulting spectra. This agrees with previous SORS and micro-SORS studies showing that the sub-surface Raman signal is spread over a wider area compared to surface layer.8,9,13 The optimum number of binned pixels that provided the best SNR in the RCB spectra was 37 (Fig. 2B[f]).
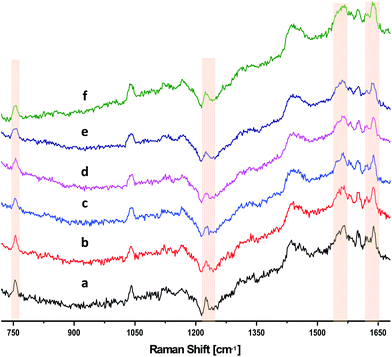
We investigated the effect of changing the slit width on the resulting SNR of the DRRS spectra of RBCs, while holding the pixel binning constant. Fig. 3 shows that there was no significant improvement in SNR with increase the slit width from 50 μm (Fig. 3[a]) to 150 μm (Fig. 3[f]), while holding the number of binned pixels constant at 37. A sudden increase in background was observed when increasing slit width above 150 μm due to detector saturation. Therefore, a 50 μm slit width was used for all subsequent DRRS measurements of RBCs in segments.
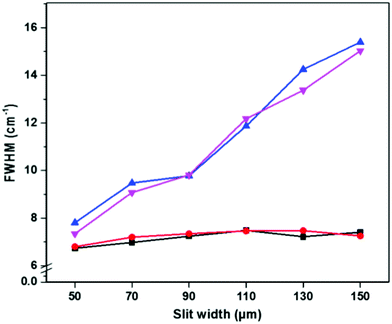
The effect of diffuse sampling on spectral bandwidth was analyzed by comparing the full width at half maximum (FWHM) of the 520.5 cm−1 band of Si at different instrument settings (Fig. 4). Using standard on-sample focusing optics, the Si FWHM was unaffected by increasing the number of extra pixels along the spatial axis of the CCD, or by increasing the slit width (Fig. 4, black squares and red circles). When using diffuse sampling with a 100 μm spot size, a small increase in bandwidth (<1 cm−1) was observed when using a defocused instead of a focused beam with a 50 μm slit width, regardless of the number of binned pixels (Fig. 4, blue and magenta triangles). This effect is likely because the slit width, grating and pixel size (bin = 1) parameters along the spectral axis, which determines the spectral resolution, were identical in both the focused and defocused settings.32,33 While the Si FWHM did not appreciably change using a 50 μm slit, it did rapidly increase with increasing slit width in the case of a defocused beam (Fig. 4).
The conservation of spectral bandwidth at 50 μm slit width in the case of diffuse sampling is critical for identification of storage dependent spectral changes in RBCs, as the interconversion of oxyHb with deoxyHb and metHb is associated with band shifts of only several wavenumbers.14 While spatial resolution is also degraded by the increase in pixel size (binning) along the spatial axis of the CCD, it is primarily determined by the spot size on the sample.34–36 However, spatial resolution is not a critical parameter for measurement of RBCs inside segments or blood bags.
Comparison of DRRS with SORS
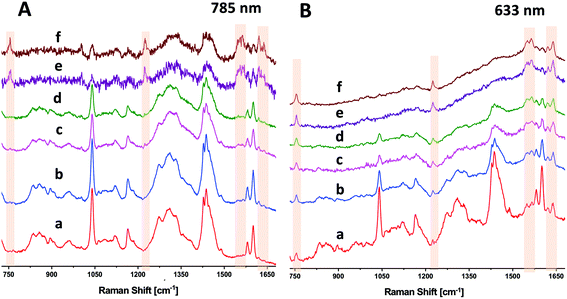
As seen above in Fig. 2, DRRS enables collection of sub-surface spectra of RBCs in blood bag segments. The DRRS spectra using 633 nm excitation show significantly reduced contributions from the surface polymer layer when the sample contains electronic transitions in resonance with the excitation laser wavelength, e.g. Hb. For comparison purposes, we acquired more traditional SORS spectra of RBCs in segments using a lateral offset along the focal plane of the excitation laser. These SORS spectra were recorded on the Renishaw InVia Raman micro-spectrometer using a similar experimental arrangement to that previously described by Buckley et al.24 Briefly, implementation of a SORS experiment with this particular microscope uses the spectrometer's software to move the laser spot along the focal plane by adjusting the instrument's alignment mirrors. We employed either a 633 nm HeNe or 785 nm diode laser, along with a 5× objective. The focused laser spot was moved across the focal plane, away from the optical axis, using software-controlled, beam-steering alignment mirrors to introduce an offset of 100 μm–200 μm without losing spot brightness. Specific areas for binning CCD pixels were defined in software.Due to the larger penetration depth available at longer wavelengths, SORS has been generally used with near-IR lasers, e.g. 785 or 830 nm. We first evaluated the signals from RBCs in segments using a near-infrared 785 nm line focus laser, with a beam size at the sample of ∼40 × 300 μm (Fig. 5A). Fig. 5A(a) and (b) are the zero-offset, normal Raman spectra of the segment acquired by binning 20 (a) or 40 (b) pixels in the spatial direction. These spectra were recorded at ∼25 mW power with 80 s integration. As expected, both Fig. 5A(a) and (b) are dominated by surface polymer bands. Fig. 5A(c) and (d) are spectra acquired with DRRS sampling at 785 nm with 20 (c) or 40 (d) pixels binned. These spectra also primarily reflect the PVC polymer segment, and did not significantly change with the inclusion of extra binning pixels. The SORS spectra of the RBCs in segments in Fig. 5A(e) and (f) were recorded with a lateral offset of 200 μm and an integration time (160 s) twice that used for Fig. 5A(a–d). Nevertheless, the SNR in the SORS spectra at 785 nm is relatively low in spite of increased integration time. To further enhance the SORS SNR at 785 nm, we attempted to use ∼80 mW incident power, but observed a black spot burning through the 1 mm thick polymer segment.
We performed an identical set of experiments to those describe above using a 633 nm HeNe laser. Fig. 5B(a) and (b) are the zero-offset normal Raman spectra of the PVC polymer segment acquired by binning 7 (a) or 37 (b) pixels in the spatial direction. These spectra were recorded at ∼5 mW power with 80 s integration time. While both Fig. 5B(a) and (b) are dominated by surface polymer bands, there are small but noticeable contributions from the sub-surface RBC bands, especially in Fig. 5B(b), which uses 37 pixel binning. Fig. 5B(c) and (d) are DRRS spectra acquired using diffuse sampling with 7 (c) or 37 (d) pixels binned. These spectra are increasingly dominated by bands associated with the sub-surface RBCs, with surface polymer bands suppressed. Finally, Fig. 5B(e) and (f) are the SORS spectra of the segments, recorded using a 100 μm lateral offset and a focused laser, with either 7 (e) or 37 (f) pixel binning.
Fig. 5B(c) through (f) directly compares DRRS with SORS using 633 nm excitation where each spectrum was acquired using the same laser power (∼5 mW) and integration time (80 s). The SNR found in the DRRS diffused beam (reduced photon density) spectra is comparable with focused beam SORS at this wavelength. However, DRRS spectra of RBCs in segments obtained with 633 nm excitation used 5× less incident laser power (5 vs. 25 mW), were obtained in half the time (80 vs. 160 s), and with much higher SNR, than the SORS spectra acquired at 785 nm. It is more likely that the increase in spectral SNR seen with 633 nm excitation is due to the effect of this excitation wavelength being in resonance with the metHb charge transfer band at >600 nm than it is due to a simple increase in 1/λ4 scattering efficiency. This interpretation is supported by the appearance of additional characteristic metHb bands at 633 nm (Fig. 5B) that are absent at 785 nm (Fig. 5A).
Multivariate analysis
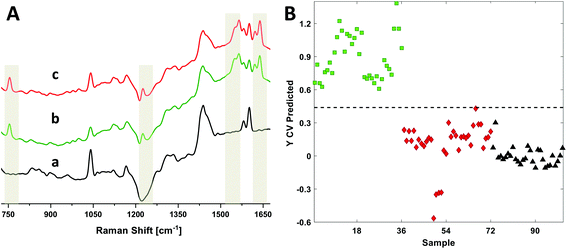
We recently published a Raman longitudinal study of RBCs using 633 nm excitation to identify detailed oxyHb and metHb diagnostic markers.14 This study used ex situ single cells and blood drops to report on the extent of hemolysis over a 42 day period. We have extended this work here by using DRRS to directly acquire RBC spectra from nine blood bag segments that were stored 6–8 days (D7) and 35–40 days (D35). Representative DRRS spectra from the polymer segments, as well as D7 and D35 RBCs, are presented in Fig. 6A. The Raman wavenumbers most representative of RBCs are highlighted. Detailed band assignments are as described above.Due to the high similarity between the D7 and D35 spectra, we used methods of multivariate analysis, in particular partial least squares-discriminant analysis (PLS-DA), to develop classification models to determine whether the DRRS method could identify segments by storage age. PLS-DA reduces a set of high dimensional variables (i.e. a spectrum) into a smaller set of diagnostically significant latent variables.37,38 We have previously employed this method using Raman spectra for classification purposes.39,40 In the present case, 101 DRRS spectra (36 D7, 36 D35 and 29 polymer) in the range 1680 to 720 cm−1 were used to generate a classification model to distinguish storage-age in RBC polymer segments where each spectrum is average of three spectra recorded from adjacent positions from the segment, each integrated for 80 s. The spectra of the empty polymer segment were used as a separate class to generate a 3-classifier model; three latent variables captured 86% of all the variance. Cross-validation using the Venetian blinds method with 10 data splits was used to establish the calibration model, which was then used for the class predictions in the test data set.
Fig. 6B presents the prediction plot for the 3-class PLS-DA classification model, while the statistical details are presented in Table 1. The data show that the D7 (green squares,  ) and D35 (red diamond
  ) segments were differentiated from one another with 100% sensitivity and >98% specificity in the cross validated data set. These values indicate that all the DRRS spectra in a particular class were correctly classified as true positives, while only 1.5% of the spectra were mis-classified as false negatives. Polymer spectra were separated from both the classes (D7 and D35) with 100% accuracy.
| Modeled class | D7 | D35 | Polymer |
|---|---|---|---|
| a CV, cross-validation based on Venetian blinds method with 10 splits. b Class error, classification error after cross-validation. c RMSECV, root-mean square error after cross-validation. | |||
| Sensitivity (CV)a | 100 | 100 | 100 |
| Specificity (CV)a | 100 | 98.5 | 100 |
| Class Error (CV)b | 0 | 0.008 | 0 |
| RMSECVc | 0.197 | 0.229 | 0.102 |
| Captured variance (x/y) | Three latent variables were used: 92/86 | ||
DRRS of Hemin inside blood-bag
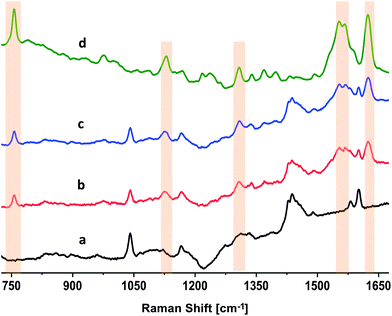
The results of the DRRS spectra of RBCs inside polymer segments of ∼1 mm thickness (Fig. 2, 5 and 6) indicate that this technique also has the potential to directly characterize RBCs in a commercial PVC polymer blood bag. To verify this, we examined a 10 mM aqueous solution of a model compound, hemin. Hemin is ferrous protoporphyrin IX, a degradation product formed from the heme groups in Hb.41Fig. 7 presents the unprocessed Raman spectra of hemin under different conditions. The top spectrum in Fig. 7(d) reflects the normal, focused Raman spectrum of a 10 mM hemin solution in 0.1 NaOH, acquired outside the blood bag as a drop cast on a glass coverslip using 633 nm, 0.5 mW power, 5× objective, and 10 s integration. Fig. 7(d) is the average of twelve individual spectra. This spectrum depicts features that are strongly similar to that of Hb in RBCs (Fig. 2B[g]). The bands that are highlighted in Fig. 7(d) at 754, 1122, 1308, 1551, 1570, and 1628 cm−1 are assigned to the (pyrrole breathing) stretch, ν(CαN), δ(CmH), ν(CβCβ) (A1g), ν(CβCβ) (B1g), and the ν(CαCm) asymmetric of hemin, respectively.41 The bottom spectrum in Fig. 7(a) is the spectrum of the empty PVC blood bag acquired using diffuse sampling methods. The DRRS spectrum of the blood bag (Fig. 7[a]) is identical to those of the polymer segments (Fig. 2B[a] and 6A[a]). A washed, empty commercial blood bag was filled with 100 mL of 10 mM hemin solution. The DRRS spectra of hemin inside the bag (∼500 μm thickness) were recorded using 633 nm, 5 mW power, 5× objective, and 80 s integration. Fig. 7(b) and (c) are the averaged (n = 6) DRRS spectra of hemin in the blood bag. Fig. 7(b) used a diffused beam with 7 pixel integration, while Fig. 7(c) used 37 pixels. In both cases, the DRRS spectra reflect enhanced intensity from the hemin contents of the bag, and suppressed the bands arising from the polymer bag surface itself.Conclusions
A method of acquiring the spectra of sub-surface analytes using diffusely focused radiation in a Raman microscope configuration is described. The method measures spectra at various sample depths by producing a converging rather than a parallel beam at the back aperture of the microscope objective lens. This effectively defocuses the laser illumination in the sample, resulting in the collection of Raman scattered photons from sub-surface layers. This method incorporates two features: (i) illumination of the sample with a defocused, larger diameter laser beam, and (ii) an increase in the number of CCD pixels that are binned along the spatial axis to detect the diffusely scattered photons. A defocused laser beam, and/or a lower numerical aperture objective, increases the penetration depth, thereby increasing the Raman sensitivity to underlying sample components.We have applied this diffuse sampling method to the analysis of storage-induced hemolysis in red blood cells. There are no existing non-invasive methods available to evaluate the state of RBCs within the blood bag, or its attached segments, after blood donation. Ex vivo changes in the resonance Raman spectra of oxyhemoglobin (oxyHb) and methemoglobin (metHb) have been shown to assess the state of RBC hemolysis during cold storage; however, no direct non-invasive Raman sampling methods have been demonstrated. Here, we used diffuse resonance Raman spectroscopy (DRRS) to non-invasively study RBCs in blood storage bag segments.
Fig. 2 shows the applicability of the DRRS method to RBCs within sealed blood bag segments. A diffused incoming beam was able to directly detect the Raman bands of Hb in RBCs through the 1 mm wall thickness of the polymer segment with high selectivity. We compared the DRRS method to the widely used SORS method with both 785 nm and 633 nm excitation (Fig. 5). At longer excitation wavelengths (785 nm) the DRRS method did not highlight the RBCs in the segments to the same extent as SORS. However, at 633 nm, the resonance effect significantly increased the sensitivity to the Hb RBC components in the segment and allowed for a high degree of discrimination of the underlying Hb modes, when compared with the surface polymer bands. At 633 nm, DRRS resulted in comparable spectral discrimination as SORS spectra at this wavelength, with somewhat high SNR. However, DRRS spectra of RBCs in segments obtained with 633 nm excitation used 5× less incident laser power (5 vs. 25 mW), were obtained in half the time (80 vs. 160 s), and with much higher SNR, than the SORS spectra of RBCs in segments acquired at 785 nm.
The DRRS spectra obtained here can be compared with previously published results on the use of Raman and SORS to determine oxygenation levels in stored RBCs.23–25 These previous studies used an excitation wavelength of 785 nm to acquire the data, a wavelength that readily distinguishes spectroscopic markers of oxyHb and deoxyHb, but is less sensitive to metHb.20,42 We have recently published data that indicates that storage-induced hemolysis in RBCs can be ascertained using Raman spectroscopy with 633 nm excitation.14 At this wavelength, the most significant results were increased concentrations of oxyHb and metHb, and decreased membrane fluidity with storage age. In particular, increased intensities of metHb bands were strongly correlated with storage-dependent hemolysis. The ability of DRRS at 633 nm excitation to identify diagnostic markers of metHb provides an enhanced approach to assess the oxidation state of Hb in RBCs during cold storage, which is not possible using standard biochemical approaches, or using SORS at 785 nm.
DRRS spectra were used in a multivariate model for classification of RBC spectra based on storage times after donation. Fig. 6 and Table 1 presents the data for the 3-class PLS-DA classification model. The analysis showed that relatively young (D7, 6–8 day) and old (D35, 35–40 day) segments were differentiated from one another with 100% sensitivity and >98% specificity. Finally, the Raman spectrum of a 10 mM hemin solution inside a commercial blood bag was obtained (Fig. 7). The DRRS spectra were highly selective for the hemin contents inside the bag, and effectively discriminated against Raman vibrations arising from the polymer bag.
These results indicate that DRRS is a promising, non-invasive, method for acquiring the spectra of sub-surface components. It is particularly appropriate for applications in which the underlying sample can be resonantly enhanced at the wavelength of the excitation laser. This is the case for RBCs in polymer segments or blood bags using 633 nm excitation, in which DRRS appears to be a better choice than standard SORS methods. An advantage of this methodology is that any increase in the laser spot diameter at the focal plane reduces the incoming photon density, which also reduces any potential risks of sample photodamage. Another advantage is that it is easily adaptable to existing conventional Raman microscope systems.
Conflicts of interest
There are no conflicts to declare.Acknowledgements
This research project was supported by the U.S. Public Health Service through grant GM102546 from the National Institutes of Health.References
- P. Matousek, M. D. Morris, N. Everall, I. P. Clark, M. Towrie, E. Draper, A. Goodship and A. W. Parker, Appl. Spectrosc., 2005, 59, 1485–1492 CrossRef PubMed.
- P. Matousek, I. P. Clark, E. R. C. Draper, M. D. Morris, A. E. Goodship, N. Everall, M. Towrie, W. F. Finney and A. W. Parker, Appl. Spectrosc., 2005, 59, 393–400 CrossRef PubMed.
- Z. Di, B. H. Hokr, H. Cai, K. Wang, V. V. Yakovlev, A. V. Sokolov and M. O. Scully, J. Mod. Opt., 2015, 62, 97–101 CrossRef.
- K. Buckley and P. Matousek, J. Pharm. Biomed. Anal., 2011, 55, 645–652 CrossRef PubMed.
- S. Sil and S. Umapathy, Sci. Rep., 2014, 4, 5308 CrossRef PubMed.
- K. Khan Mohammad, G. Nirmalya and M. Shovan Kumar, J. Opt., 2016, 18, 095301 CrossRef.
- S. K. V. Sekar, S. Mosca, A. Farina, F. Martelli, P. Taroni, G. Valentini, R. Cubeddu and A. Pifferi, Opt. Express, 2017, 25, 4585–4597 CrossRef PubMed.
- P. Matousek, Chem. Soc. Rev., 2007, 36, 1292–1304 RSC.
- P. Matousek and N. Stone, J. Biophotonics, 2013, 6, 7–19 CrossRef PubMed.
- C. Conti, C. Colombo, M. Realini, G. Zerbi and P. Matousek, Appl. Spectrosc., 2014, 68, 686–691 CrossRef PubMed.
- C. Conti, M. Realini, C. Colombo, K. Sowoidnich, N. K. Afseth, M. Bertasa, A. Botteon and P. Matousek, Anal. Chem., 2015, 87, 5810–5815 CrossRef PubMed.
- M. Realini, A. Botteon, C. Conti, C. Colombo and P. Matousek, Analyst, 2016, 141, 3012–3019 RSC.
- P. Matousek, C. Conti, M. Realinii and C. Colombo, Analyst, 2016, 141, 751–759 RSC.
- R. Gautam, J.-Y. Oh, M. B. Marques, R. A. Dluhy and R. P. Patel, Lab. Med., 2018, lmy018 Search PubMed.
- E. Almac and C. Ince, Best Pract. Res., Clin. Anaesthesiol., 2007, 21, 195–208 CrossRef.
- L. van de Watering, Vox Sang., 2011, 100, 36–45 CrossRef PubMed.
- R. Stapley, B. Y. Owusu, A. Brandon, M. Cusick, C. Rodriguez, M. B. Marques, J. D. Kerby, S. R. Barnum, J. A. Weinberg, J. R. Lancaster and R. P. Patel, Biochem. J., 2012, 446, 499–508 CrossRef PubMed.
- J. A. Weinberg, S. R. Barnum and R. P. Patel, Transfusion, 2011, 51, 867–873 CrossRef PubMed.
- J.-Y. Oh, R. Stapley, V. Harper, M. B. Marques and R. P. Patel, Transfusion, 2015, 55, 2967–2978 CrossRef PubMed.
- B. R. Wood, B. Tait and D. McNaughton, Biochim. Biophys. Acta, 2001, 1539, 58–70 CrossRef.
- B. R. Wood, L. Hammer, L. Davis and D. McNaughton, J. Biomed. Opt., 2005, 10, 014005–01400513 CrossRef PubMed.
- D. Perez–Guaita, M. de Veij, K. M. Marzec, A. R. D. Almohammedi, D. McNaughton, A. J. Hudson and B. R. Wood, ChemistrySelect, 2017, 2, 3342–3346 CrossRef.
- C. G. Atkins, K. Buckley, D. Chen, H. G. Schulze, D. V. Devine, M. W. Blades and R. F. B. Turner, Analyst, 2016, 141, 3319–3327 RSC.
- K. Buckley, C. G. Atkins, D. Chen, H. G. Schulze, D. V. Devine, M. W. Blades and R. F. B. Turner, Analyst, 2016, 141, 1678–1685 RSC.
- C. G. Atkins, H. G. Schulze, D. Chen, D. V. Devine, M. W. Blades and R. F. B. Turner, Analyst, 2017, 142, 2199–2210 RSC.
- D. A. Long, The Raman Effect, J. Wiley & Sons, Chichester, 2002 Search PubMed.
- P. R. Carey, in Biochemical Applications of Raman and Resonance Raman Spectroscopes, Academic Press, 1982, pp. 99–153 Search PubMed.
- B. R. Wood and D. McNaughton, in Biomedical Vibrational Spectroscopy, ed. P. Lasch and J. Kneipp, John Wiley & Sons, Inc., Chichester, UK, 2008, pp. 181–208 Search PubMed.
- J. D. R. Kurach, A. L. Hansen, T. R. Turner, C. Jenkins and J. P. Acker, Transfusion, 2014, 54, 451–455 CrossRef PubMed.
- R. Liu, Z. Mao, D. L. Matthews, C.-S. Li, J. W. Chan and N. Satake, Exp. Hematol., 2013, 41, 656–661.e651 CrossRef PubMed.
- J. L. Koenig and D. Druesedow, J. Polym. Sci., Part A-2, 1969, 7, 1075–1084 CrossRef.
- C. Liu and R. W. Berg, Appl. Spectrosc., 2012, 66, 1034–1043 CrossRef.
- A. Ghita, P. Matousek and N. Stone, J. Biophotonics, 2018, 11, e201600260 CrossRef PubMed.
- R. Kiselev, I. W. Schie, S. Aškrabić, C. Krafft and J. Popp, Biomed. Spectrosc. Imaging, 2016, 5, 115–127 Search PubMed.
- N. Everall, J. Lapham, F. Adar, A. Whitley, E. Lee and S. Mamedov, Appl. Spectrosc., 2007, 61, 251–259 CrossRef PubMed.
- R. Gautam, Curr. Sci., 2015, 108, 341–356 Search PubMed.
- D. Ballabio and V. Consonni, Anal. Methods, 2013, 5, 3790–3798 RSC.
- M. Barker and W. Rayens, J. Chemom., 2003, 17, 166–173 CrossRef.
- P. Negri and R. A. Dluhy, Analyst, 2013, 138, 4877–4884 RSC.
- S. L. Hennigan, J. D. Driskell, R. A. Dluhy, Y. Zhao, R. A. Tripp, K. B. Waites and D. C. Krause, PLoS One, 2010, 5, e13633 CrossRef PubMed.
- B. R. Wood, S. J. Langford, B. M. Cooke, J. Lim, F. K. Glenister, M. Duriska, J. K. Unthank and D. McNaughton, J. Am. Chem. Soc., 2004, 126, 9233–9239 CrossRef PubMed.
- B. R. Wood and D. McNaughton, J. Raman Spectrosc., 2002, 33, 517–523 CrossRef.
| This journal is © The Royal Society of Chemistry 2018 |

