 Open Access Article
Creative Commons Attribution 3.0 Unported Licence
An interdigitated electrode with dense carbon nanotube forests on conductive supports for electrochemical biosensors†
Hisashi
Sugime‡
 *a,
Takuya
Ushiyama‡
b,
Keita
Nishimura
b,
Yutaka
Ohno
bc and
Suguru
Noda
 de
de
aWaseda Institute for Advanced Study, Waseda University, 1-6-1 Nishi Waseda, Shijuku-ku, Tokyo 169-8050, Japan. E-mail: sugime@aoni.waseda.jp
bGraduate School of Engineering, Nagoya University, Furo-cho, Chikusa-ku, Nagoya 464-8603, Japan
cInstitute of Materials and Systems for Sustainability, Nagoya University, Furo-cho, Chikusa-ku, Nagoya 464-8603, Japan
dDepartment of Applied Chemistry, School of Advanced Science and Engineering, Waseda University, 3-4-1 Okubo, Shinjuku-ku, Tokyo 169-8555, Japan
eWaseda Research Institute for Science and Engineering, Waseda University, 3-4-1 Okubo, Shinjuku-ku, Tokyo 169-8555, Japan
First published on 12th June 2018
Abstract
A highly sensitive interdigitated electrode (IDE) with vertically aligned dense carbon nanotube forests directly grown on conductive supports was demonstrated by combining UV lithography and a low temperature chemical vapor deposition process (470 °C). The cyclic voltammetry (CV) measurements of K4[Fe(CN)6] showed that the redox current of the IDE with CNT forests (CNTF-IDE) reached the steady state much more quickly compared to that of conventional gold IDE (Au-IDE). The performance of the CNTF-IDE largely depended on the geometry of the electrodes (e.g. width and gap). With the optimum three-dimensional electrode structure, the anodic current was amplified by a factor of ∼18 and ∼67 in the CV and the chronoamperometry measurements, respectively. The collection efficiency, defined as the ratio of the cathodic current to the anodic current at steady state, was improved up to 97.3%. The selective detection of dopamine (DA) under the coexistence of L-ascorbic acid with high concentration (100 μM) was achieved with a linear range of 100 nM–100 μM, a sensitivity of 14.3 mA mol−1 L, and a limit of detection (LOD, S/N = 3) of 42 nM. Compared to the conventional carbon electrodes, the CNTF-IDE showed superior anti-fouling property, which is of significant importance for practical applications, with a negligible shift of the half-wave potential (ΔE1/2 < 1.4 mV) for repeated CV measurements of DA at high concentration (100 μM).
Introduction
Electrochemical label-free sensing using redox reactions is one of the powerful and simple methods to detect analytes with high sensitivity. To achieve high sensitivity, a pair of closely spaced electrodes is effective to obtain a steady-state current by “redox cycling”,1 and the downsizing of the electrodes leads to better performance because of the enhanced diffusion of the analytes.2 Furthermore, an interdigitated electrode (IDE) realizes even higher sensitivity by utilizing the redox cycling efficiently by placing an array of electrode pairs.3 Redox cycling occurs when the analytes oxidized (or reduced) at one electrode (called the “generator”) diffuse and then get reduced (or oxidized) at the other electrode (called the “collector”).4,5 The efficiency of redox cycling largely depends on the geometry of the electrodes; electrodes with a smaller distance show better performance in general.6–10 In addition, both experimental and theoretical studies revealed that an IDE with three-dimensional electrodes (electrodes with height) showed better performance than the conventional IDE with planar electrodes.11–14 This is because the analytes are confined in the space between the electrodes without diffusing away; therefore the number of redox cycling increases.Compared to conventional metals (e.g. Au, Pt, etc.) used as electrodes in electrochemistry, carbon has several advantages due to its fast electron transfer kinetics with a wide potential window,15–21 and anti-fouling property.22–25 In the past, preparation of electrodes with as-made carbon materials such as carbon fibers,26,27 glassy carbon,28–30 carbon paste,31 highly oriented pyrolytic graphite,32 graphene,33–35 and carbon nanotubes (CNTs)22,35–44 has been intensively studied. The drawback of these methods is the difficulty of precise control of the position and/or the morphology of the carbon electrodes. To overcome this problem, pyrolyzed carbon thin films from organic resists were patterned by UV lithography for IDE usage. However, high temperature (i.e. ∼1000 °C) and a long process time, typically several hours, are required to obtain carbon electrodes with high electrical conductivity.10,45–49 On the other hand, CNTs have good electrical conductivity and can be grown at a temperature as low as ∼400 °C with a shorter process time (i.e. several minutes) by chemical vapour deposition (CVD).50–52 In addition, by engineering the catalyst design, we showed that direct growth of dense CNT forests on conductive supports at 450 °C in 3 min is possible.53–56 They are suitable as electrode materials in IDEs as the CNTs have a highly packed morphology and good electrical contact with supports, which is different from the conventional CNT forests grown on insulators (e.g. SiO2, Al2O3, etc.).57–59 In this paper, we applied dense CNT forests to the IDE combined with patterning of the catalysts and supports by UV lithography. The performance as an electrochemical biosensor was assessed by measuring the redox reaction of K4[Fe(CN)6], and dopamine (DA), which is an important neurotransmitter in the human brain.60,61
Experimental
Fabrication of interdigitated electrodes with carbon nanotube forests
Fig. 1a shows a schematic of the fabrication process of the IDE with CNT forests (CNTF-IDE) with UV lithography followed by thermal CVD. A lift-off resist (LOR, MicroChem Corp.) and another resist (S-1813G, MicroChem Corp.) were sequentially spin-coated on SiO2(200 nm)/Si substrates and patterned. Then Au(100 nm, top)/Ti(10 nm, adhesion layer) electrodes were deposited by electron-beam evaporation. Each device consists of a “generator” and “collector” both of which are used as working electrodes. On 10 × 15 mm2 substrates, 30 devices with different combinations of electrode width (We = 2, 3, or 4 μm) and gap width (Wg = 2, 3, 4, or 5 μm) were fabricated as shown in Fig. 1b. The total sensing area of each device was fixed at 0.5 mm2 with Wtotal = 0.5 mm and Ltotal = 1 mm (Fig. 1a), and thus the number of digitated electrodes in one device depends on We and Wg. As a catalyst, a Co(10 nm, top)/Nb(5 nm)/Ti(5 nm) multilayer was deposited by RF magnetron sputtering at an Ar pressure of 1.3 Pa followed by removal of the resists. The catalyst design in this study is similar to that of our previous reports except for using Nb instead of Mo.53,54 The resists were again patterned and the catalyst layer in unnecessary regions was etched by Ar ion milling. Then, an SiO2 layer was deposited by e-beam evaporation as an insulating layer, and the resists were lifted off. A schematic of the detailed fabrication process is shown in Fig. S1.† As a reference, an IDE without CNT forests (Au-IDE) was fabricated by skipping the catalyst deposition and the CVD process.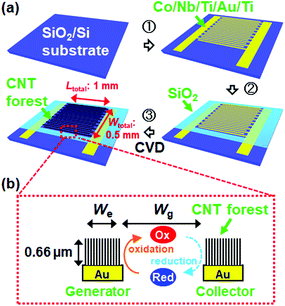 | ||
| Fig. 1 Schematics of (a) the fabrication process of the IDE with CNT forests and (b) the redox cycling of analytes in dual-mode cyclic voltammetry (CV). | ||
Growth of carbon nanotube forests by chemical vapor deposition
CNT forests were grown by thermal CVD at ambient pressure. The samples were loaded into a thermal CVD apparatus, which consists of a quartz tube reactor and an electric furnace.62 Then, the samples were heated up at a ramping rate of ∼2 °C s−1 under a H2 atmosphere (11 vol%)/Ar (89 vol%) with a total flow rate of 475 sccm. Upon reaching 470 °C, 25 sccm of C2H2 (20 vol%)/Ar (80 vol%) was added as a carbon source to grow CNTs. The gas conditions during CNT growth were C2H2 (1 vol%)/H2 (10 vol%)/Ar (89 vol%) with a total flow rate of 500 sccm. After the growth period (150–300 s), C2H2 and H2 were turned off while retaining the Ar flow. At the same time, the furnace was turned off and the samples were cooled down to room temperature. The samples were characterized using a scanning electron microscope with an acceleration voltage of 3 kV (SEM, Hitachi, S-4800), a transmission electron microscope with an acceleration voltage of 200 kV (TEM, JEOL, JEM-2100F) equipped with an energy dispersive X-ray spectrometer (EDS, JEOL JED-2300T), and Raman spectrometer with an excitation wavelength of 488 nm (Horiba, HR800). To obtain the mass density of the CNT forests, samples with the same catalyst/support were prepared uniformly without patterning by UV lithography. The mass density was calculated by dividing the mass gain of the sample before and after the CNT growth by the height of the CNT forests obtained with SEM observation.53Electrochemical characterization of the IDE with and without CNT forests
We performed electrochemical measurements of the redox reaction of aqueous solutions prepared using ultra-pure water (Millipore, Milli-Q). K4[Fe(CN)6], DA, and L-ascorbic acid (AA) purchased from Sigma-Aldrich, and KCl, HCl, and phosphate buffered saline (PBS) purchased from Kanto Chemical Co., Inc. were used as-received. K4[Fe(CN)6] (100 μM) in KCl (100 mM) or DA (100 μM) in PBS (pH 7.4) were used to assess and compare the CNTF-IDE with the Au-IDE. Before the measurement, the devices were sequentially dipped into iso-propanol and water to replace the air inside the CNT forests with solution. A droplet of the solution (∼150 μL), which has enough volume to cover all 30 devices on one substrate, was placed onto the electrodes, and then the counter-electrode (Pt) and the reference electrode (Ag/AgCl) were brought into contact with the solution. We note that if we placed the solution onto the device without dipping into iso-propanol, air bubbles remained on the surface of the CNT forests, and thus the current during the electrochemical measurements was not stable. This is because the as-grown CNTs were hydrophobic. After touching down the probes to the working electrodes of one device (the generator and the collector, see Fig. 1b), the potential was then applied with a potentiostat (Metrohm, PGSTAT128N). We note that only one device with a sensing area of 0.5 mm2 contributed to each electrochemical measurement. In single-mode cyclic voltammetry (CV), both the generator and the collector were swept with the same potential. On the other hand, in dual-mode CV, the potential of the generator was swept with the potential of the collector fixed at −0.1 V. We also performed chronoamperometry (CA) measurements in the dual mode by stepping the collector potential repeatedly between 0 and 0.4 V with the generator potential fixed at 0.4 V. With the optimum design of the electrodes, by dual-mode CV, we performed the selective detection of DA in PBS with the coexistence of AA (100 μM). For this measurement, the pH of PBS was adjusted to 6.0 by adding HCl to stabilize AA. The anti-fouling property of the CNTF-IDE was assessed by repeated dual-mode CV of DA (100 μM) in PBS (pH 7.4). The generator potential was swept for 30 times between 0 and 0.7 V at a scan rate (v) of 10 mV s−1 at a fixed collector potential of −0.1 V.Results and discussion
Characterization of CNT forests
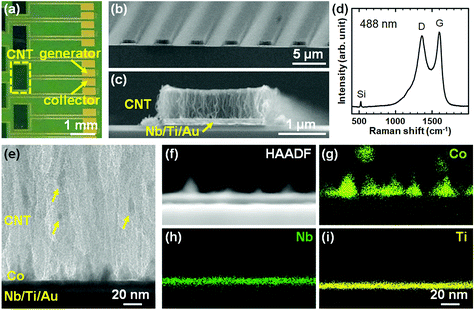
We first characterized the CNT forests in the IDE by SEM, Raman spectroscopy, and TEM. Fig. 2a shows the top-view optical image of a part of the substrate where the arrays of CNTF-IDE exist. The CNT forests were grown in the area (0.5 × 1.0 mm2) shown with a dashed rectangle. As shown in the SEM images (We = 2 μm and Wg = 3 μm), the CNT forests have a packed morphology which is the same as the CNT forests we showed in previous reports with a Co/Mo catalyst on Ti-coated Cu support (Fig. 2b and c).53,54 Since the densities of the CNT forests change with their heights,53 in this study, the mass density of the as-grown CNT forests was adjusted to ∼0.6 g cm−3 by controlling the forest height to 0.66 ± 0.026 μm (mean ± standard deviation). As shown in Fig. 2c and the side-view SEM images of the CNT forests with different electrode designs (Fig. S2†), the edge of the CNT forests is slightly higher (up to 17%) than the centre. The mass density is lower than the highest value we have shown (1.6 g cm−3),53 and similar to the CNT forests on insulating supports (i.e. Al2O3) after densification by liquid (0.56 g cm−3).63 We note that densification by liquid is almost negligible with the CNT forest herein because of the as-grown packed morphology. The Raman spectrum showed the G-peak at ∼1600 cm−1 and the D-peak at ∼1360 cm−1 with an intensity ratio (IG/ID) of 1.1, which is also a value similar to that of our previous multi-walled CNTs (Fig. 2d).53,56 The IG/ID of CNTs grown at low process temperature (470 °C) is comparable with that of pyrolyzed carbon at ∼1000 °C,46,48,64 indicating a similar degree of graphitization of the catalysed growth of CNTs by CVD. The side-view TEM image of the bottom part of the CNT forests shows Co particles, which mainly exist on the substrate surface with some being detached and incorporated into the CNT forests as shown with arrows in Fig. 2e. The detaching mechanism of the Co particles was discussed in detail in our previous report; most of the lifted Co particles were embedded in CNTs.54 Therefore, Co catalyst particles did not have direct contact with the analyte solution during the electrochemical measurements, and thus the side reactions were avoided. TEM-EDS analysis shows that the Nb (5 nm) and Ti (5 nm) layer exists on the substrate surface and holds Co catalyst nanoparticles (Fig. 2f–i).Performance of the IDE with and without CNT forests as an electrochemical sensor
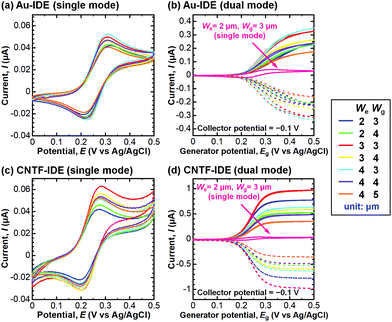
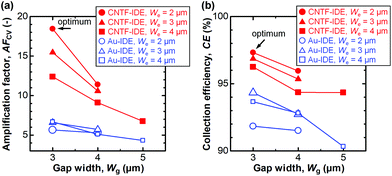
We next compared the performance of the CNTF-IDE and the Au-IDE by electrochemical measurements. Fig. 3 shows the CV results of different electrode designs (We and Wg) with a solution of K4[Fe(CN)6] (100 μM) in KCl (100 mM) at a scan rate (v) of 10 mV s−1. The potential of the generator and the collector was the same during the linear sweep in the single-mode CV (Fig. 3a and c), while the potential of the generator was swept with the potential of the collector fixed at −0.1 V (Fig. 3b and d). In Fig. 3b and d, the solid lines show the anodic current (Ia) at the generator, and the dashed lines show the cathodic current (Ic) at the collector. In single-mode CV for Au-IDE, the anodic peak current (Ipa) was 0.040–0.053 μA at the anodic peak position (Epa) of ∼0.31 V with a peak separation (ΔEp) of ∼97 mV (Fig. 3a). Both Ia and Ic were amplified in dual-mode CV by redox cycling,3 showing 0.17–0.36 μA at a generator potential of 0.5 V (Fig. 3b). In this study, [Fe(CN)6]3− is generated by the oxidization of [Fe(CN)6]4− at the generator; it diffuses to the collector, and then gets reduced immediately on the collector fixed at −0.1 V, which is low enough to reduce [Fe(CN)6]3−. In the case of CNTF-IDE, Ipa was 0.042–0.064 μA at an Epa of ∼0.28 V with a ΔEp of ∼85 mV in the single-mode CV (Fig. 3c). The increase of Ipa (up to 30% with the same We and Wg) is mainly attributable to the larger electric double-layer (EDL) capacitance of the CNTF-IDE (i.e. 5–10 times larger compared to that of Au-IDE, Fig. S3†). In addition, since the redox reaction of Fe(CN)63−/4− is known to be an outer sphere electron transfer (i.e., less dependent on the electrode materials), it is reasonable that both the shift of Epa (∼30 mV) and the decrease of ΔEp (∼12 mV) are small. The small difference can also be attributable to the change in diffusional characteristics that stems from the different electrode heights due to the CNT forests.13In dual-mode CV, as observed with the Au-IDE, Ia was amplified to 0.36–0.99 μA at the generator potential of 0.5 V (Fig. 3d). In addition to the pronounced amplification of Ia which is mainly attributable to the change in diffusional characteristics due to the different electrode heights due to the CNT forests,13 both Ia and Ic with the CNTF-IDE reached the steady state more rapidly compared to the case with the Au-IDE showing the faster electron transfer kinetics on the CNT surface (Fig. 3b and d). Here, we defined two indices to assess the performance of the IDE by CV. The first one is the “amplification factor in CV (AFCV)”, which is the ratio of Ia at 0.5 V in dual-mode CV to Ipa at ∼0.3 V in single-mode CV. AFCV shows how much Ia is amplified by the redox cycling. The second one is the “collection efficiency (CE)”, which is the ratio of the absolute value of Ic to that of Ia in dual-mode CV at the generator potential of 0.5 V. A high CE means high efficiency of the redox cycling without the analytes diffusing away. Fig. 4a summarizes AFCV, and Fig. 4b summarizes CE with different electrode structures (We and Wg). AFCV and CE with the Au-IDE ranged from 4.3 to 6.7 and from 90.3% to 94.3%, while those with the CNTF-IDE ranged from 6.8 to 18.4 and from 94.3% to 97.3%, respectively. With both the Au-IDE and the CNTF-IDE, a smaller Wg showed a higher AFCV and CE, which is in good agreement with previous reports.7,10,49,65 As for We, the same dependence was observed with the CNTF-IDE, but it was not clearly observed with the Au-IDE. The performance of the IDE was significantly improved by growing the CNT forests on the electrodes; AFCV was 1.6–3.2 times higher than that with the Au-IDE with the same We and Wg. We note that the performance of the Au-IDE herein is reasonably good compared to those in the previous reports in terms of the high collection efficiency of over 90%.7 The improvement by the growth of the CNT forests comes not only from the fast electron transfer kinetics of the CNT surface related to the increase of the effective surface area,36,42 but also from the change of the electrode geometry from two-dimensional to three-dimensional structures.11,13,14,49 With the electrode of We = 2 μm and Wg = 3 μm, the highest AFCV (18.4) and CE (97.3%) were obtained, which are comparable to the reported values (shown with arrows in Fig. 4a and b).7,10,14,49 We note that the devices did not work properly in dual-mode CV when the generator and the collector had a short circuit. The yield of the devices, which largely depended on Wg rather than We, were 0% for Wg = 2 μm, ∼90% for Wg’ = 3 μm and 4 μm, and 100% for Wg = 5 μm.
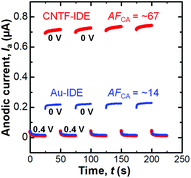
We next performed dual-mode CA by repeatedly stepping the collector potential at 0.4 and 0 V every 25 s at a fixed generator potential of 0.4 V (We = 2 μm and Wg = 3 μm, Fig. 5). When the collector potential is 0.4 V, Ia exponentially decays with time as the diffusion layer extends which is expressed with the Cotrell equation in the case of planar electrodes.66 When the collector potential was 0 V, which is low enough to reduce [Fe(CN)6]3−, redox cycling occurred and thus Ia was amplified. The amplification factor in the CA (AFCA) was defined as the ratio of Ia at the collector potential of 0 V to that at the collector potential of 0.4 V. When we used the values 0.1 s before the switching of the collector potential, the Au-IDE shows an AFCA of ∼14 while the CNTF-IDE shows an AFCA of ∼67. This value with the CNTF-IDE is comparable to the value shown as the highest AFCA with the IDE by Dam et al.11 We observed a gradual increase (∼5% in 150 s) of Ia both with the Au-IDE and the CNTF-IDE, which is possibly attributable to the increase of the analyte concentration due to the evaporation of the solvent (water).
Selective detection of DA
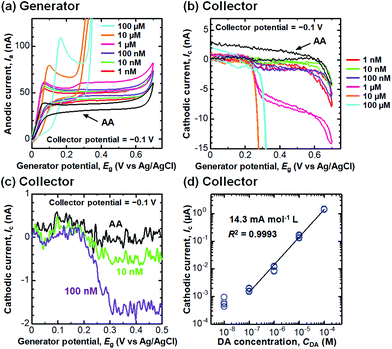
We then performed selective detection of DA, an important neurotransmitter in the human brain,60,61 under the coexistence of AA (100 μM) in PBS (10 mM, pH 6.0) to assess the performance of the CNTF-IDE (We = 2 μm and Wg = 3 μm) as a biosensor. To decide the potential range for dual-mode CV, we first measured the single-mode CV of DA only (without AA) with the CNTF-IDE (Fig. 6a). The reversible redox reaction was observed with an Epa of ∼0.35 V and a small ΔEp of ∼48 mV showing the fast electron transfer kinetics of the CNTF-IDE. A schematic of the redox reaction of DA and the interference by AA in dual-mode CV with the CNTF-IDE is shown in Fig. 6b. Because DA and AA have similar redox potentials, and the basal concentration of DA in the human body is much lower (<∼1000 times) than that of AA,67–69 selective detection of DA with low concentration suppressing the interference from AA is of significant importance for medical applications.70–73 In addition, as AA acts as a reductant of oxidized DA (o-dopamine quinine, DQ), the quantitative detection of DA by Ic is interfered. As the oxidized AA (dehydroascorbic acid, DHA) is rapidly hydrolysed, AA which exists around the electrode surface is consumed if Wg is small enough compared to the diffusion layer thickness of AA. This means that quantitative detection of DA, which undergoes a reversible redox reaction, is possible by measuring Ic by redox cycling in dual-mode CV.71 We observed Ia with a peak at around 0.05–0.20 V coming from the oxidation of AA followed by the steady-state current coming from the oxidation of both AA and DA (Fig. 7a). Although both Ia and Ic increased with a higher concentration of DA, Ic is attributable to the reduction of DQ (Fig. 7b). As shown with the enlarged graph of a part of Fig. 7b focusing on only the forward scans of AA (background), 10 nM DA, and 100 nM DA, the larger Ic was observed clearly with increasing DA concentration (Fig. 7c). The linear range of Ic for DA concentration was found to be 100 nM–100 μM with a sensitivity of 14.3 mA mol−1 L and a high coefficient of determination (R2 = 0.9993, Fig. 7d). We note that the sensitivity becomes 14.8 mA mol−1 L with a lower R2 of 0.978 if the lower concentration range without 100 μM is considered (i.e., 100 nM–10 μM). We determined the root mean square (RMS) noise as 2.0 × 10⁻¹⁰ A from the signal of AA (Fig. 7c), and the limit of detection (LOD, S/N = 3) was calculated to be 4.2 × 10⁻⁸ M. The linear range and LOD are comparable with the highly sensitive IDE, despite the much higher concentration ratio of AA to DA in this study (>1000).46,71 With 10 nM DA, the CNTF-IDE showed a cathodic current density of ∼1 nA mm−2 (Ic of ∼0.5 nA with a total sensing area of 0.5 mm2), which is ∼16 times larger than that obtained with the IDE previously reported (∼0.1 nA with a total sensing area of 1.6 mm2).71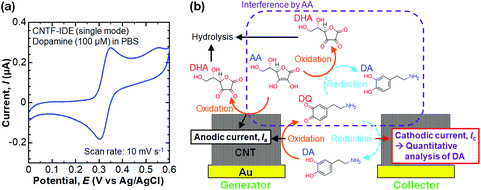 | ||
| Fig. 6 (a) A typical CV result of the CNTF-IDE (single mode) with DA (100 μM) in PBS. (b) A schematic of the redox reaction of DA and the interference by AA in dual-mode CV. | ||
Anti-fouling property of the CNTF-IDE
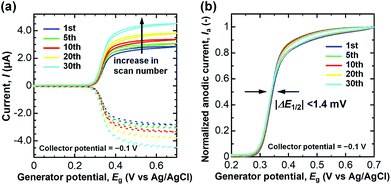
Finally, we assessed the anti-fouling property of the CNTF-IDE (We = 2 μm and Wg = 3 μm) by repeated measurement of DA with high concentration (100 μM) in PBS (pH 7.4). It is known that DQ (oxidized DA) forms melanin by the following cyclization and oxidation, and then deposits on the surface of the electrodes as an insulating layer.24 The degradation of the electrodes by the insulating layer appears as a shift of the half-wave potential (ΔE1/2) since the electron transfer rate decreases.30,66,74 As shown in Fig. 8a, an increase of both Ia and Ic, possibly because of the evaporation of the solution, was observed during the 30 cycles of dual-mode CV as is the case for CA shown in Fig. 5. When Ia is normalized by that at 0.7 V, ΔE1/2 was almost negligible (<1.4 mV, Fig. 8b). Unlike the case of the conventional carbon electrodes including CNT electrodes where the decrease of Ia accompanied by a significant ΔE1/2 is observed,23,24,44,75 the CNTF-IDE herein has superior anti-fouling properties which are of great importance for its practical use. The good anti-fouling properties of the CNTF-IDE possibly stem from the decreased binding affinity of the insulating film to the CNT surface.24 However, this mechanism does not explain the difference between our results with other CNT electrodes without the forest structure.23,44 Therefore, another possible mechanism is that because defective MWCNTs (IG/ID = 1.1 in the Raman spectrum, Fig. 2d) grown at low temperature (470 °C) have larger numbers of reaction sites with different reactivities; the fouling rate should decrease if the deactivation occurs one site at a time.Conclusions
Highly sensitive IDEs with vertically aligned dense CNT forests on conductive supports are demonstrated by combining UV lithography and a low temperature CVD process (470 °C). The dual-mode CV of K4[Fe(CN)6] showed that the redox current of the CNTF-IDE reached the steady state much more quickly compared to that of the Au-IDE. With the optimum three-dimensional electrode structure, CE was improved up to 97.3%, and Ia was amplified by a factor of ∼18 and ∼67 in the CV and CA measurements, respectively. The selective detection of DA under the coexistence of AA with high concentration (100 μM) was achieved with a linear range of 100 nM–100 μM, a sensitivity of 14.3 mA mol−1 L, and the limit of detection (LOD, S/N = 3) of 42 nM. The CNTF-IDE showed superior anti-fouling property with a negligible ΔE1/2 (<1.4 mV) for repeated CV measurements of DA at high concentration (100 μM).Conflicts of interest
There are no conflicts to declare.Acknowledgements
This work was supported by the JSPS KAKENHI Grant Number JP17K14859, Waseda University Grant for Special Research Projects (Project number: 2017K-398), and the Joint Research Program of the Institute of Materials and Systems for Sustainability, Nagoya University. The authors thank Mr Shinpei Enomoto at Kagami Memorial Research Institute for Materials Science and Technology, Waseda University for TEM observation, and Mr Rei Nakagawa at Waseda University for his help in editing this manuscript.References
- L. B. Anderson and C. N. Reilley, J. Electroanal. Chem., 1965, 10, 295–305 Search PubMed.
- R. M. Wightman, Anal. Chem., 1981, 53, 1125A–1134A CrossRef.
- D. G. Sanderson and L. B. Anderson, Anal. Chem., 1985, 57, 2388–2393 CrossRef.
- A. J. Bard, J. A. Crayston, G. P. Kittlesen, T. Varco Shea and M. S. Wrighton, Anal. Chem., 1986, 58, 2321–2331 CrossRef.
- E. O. Barnes, G. E. M. Lewis, S. E. C. Dale, F. Marken and R. G. Compton, Analyst, 2012, 137, 1068–1081 RSC.
- K. Aoki, M. Morita, O. Niwa and H. Tabei, J. Electroanal. Chem., 1988, 256, 269–282 CrossRef.
- O. Niwa, M. Morita and H. Tabei, Anal. Chem., 1990, 62, 447–452 CrossRef.
- I. Streeter, N. Fietkau, J. del Campo, R. Mas, F. X. Mũnoz and R. G. Compton, J. Phys. Chem. C, 2007, 111, 12058–12066 CrossRef.
- E. D. Goluch, B. Wolfrum, P. S. Singh, M. A. G. Zevenbergen and S. G. Lemay, Anal. Bioanal. Chem., 2009, 394, 447–456 CrossRef PubMed.
- F. Liu, G. Kolesov and B. A. Parkinson, Anal. Chem., 2014, 86, 7391–7398 CrossRef PubMed.
- V. A. T. Dam, W. Olthuis and A. van den Berg, Analyst, 2007, 132, 365–370 RSC.
- J. I. Heo, Y. Lim and H. Shin, Analyst, 2013, 138, 6404–6411 RSC.
- M. Morita, K. Hayashi, T. Horiuchi, S. Shibano, K. Yamamoto and K. J. Aoki, J. Electrochem. Soc., 2014, 161, H178–H182 CrossRef.
- R. R. Kamath and M. J. Madou, Anal. Chem., 2014, 86, 2963–2971 CrossRef PubMed.
- J. M. Nugent, K. S. V. Santhanam, A. Rubio and P. M. Ajayan, Nano Lett., 2001, 1, 87–91 CrossRef.
- J. Wang, Electroanalysis, 2005, 17, 7–14 CrossRef.
- J. J. Gooding, Electrochim. Acta, 2005, 50, 3049–3060 CrossRef.
- I. Heller, J. Kong, H. A. Heering, K. A. Williams, S. G. Lemay and C. Dekker, Nano Lett., 2005, 5, 137–142 CrossRef PubMed.
- C. E. Banks and R. G. Compton, Analyst, 2006, 131, 15–21 RSC.
- I. Dumitrescu, P. R. Unwin and J. V. Macpherson, Chem. Commun., 2009, 45, 6886–6901 RSC.
- C. B. Jacobs, M. J. Peairs and B. J. Venton, Anal. Chim. Acta, 2010, 662, 105–127 CrossRef PubMed.
- B. E. K. Swamy and B. J. Venton, Analyst, 2007, 132, 876–884 RSC.
- I. Dumitrescu, J. P. Edgeworth, P. R. Unwin and J. V. Macpherson, Adv. Mater., 2009, 21, 3105–3109 CrossRef.
- W. Harreither, R. Trouillon, P. Poulin, W. Neri, A. G. Ewing and G. Safina, Anal. Chem., 2013, 85, 7447–7453 CrossRef PubMed.
- L. Xiang, P. Yu, J. Hao, M. Zhang, L. Zhu, L. Dai and L. Mao, Anal. Chem., 2014, 86, 3909–3914 CrossRef PubMed.
- J. L. Ponchon, R. Cespuglio, F. Gonon, M. Jouvet and J. F. Pujol, Anal. Chem., 1979, 51, 1483–1486 CrossRef PubMed.
- F. G. Gonon, C. M. Fombarlet, M. J. Buda and J. F. Pujol, Anal. Chem., 1981, 53, 1386–1389 CrossRef.
- C. Bourdillon, J. P. Bourgeois and D. Thomas, J. Am. Chem. Soc., 1980, 102, 4231–4235 CrossRef.
- H. J. Wieck, G. H. Heider and A. M. Yacynych, Anal. Chim. Acta, 1984, 158, 137–141 CrossRef.
- S. H. DuVall and R. L. McCreery, Anal. Chem., 1999, 71, 4594–4602 CrossRef.
- K. M. Millan, A. Saraullo and S. R. Mikkelsen, Anal. Chem., 1994, 66, 2943–2948 CrossRef PubMed.
- A. N. Patel, M. G. Collignon, M. A. O'Connell, W. O. Y. Hung, K. McKelvey, J. V. Macpherson and P. R. Unwin, J. Am. Chem. Soc., 2012, 134, 20117–20130 CrossRef PubMed.
- Y. Y. Shao, J. Wang, H. Wu, J. Liu, I. A. Aksay and Y. H. Lin, Electroanalysis, 2010, 22, 1027–1036 CrossRef.
- D. Chen, H. B. Feng and J. H. Li, Chem. Rev., 2012, 112, 6027–6053 CrossRef PubMed.
- K. Ariga, K. Minami and L. K. Shrestha, Analyst, 2016, 141, 2629–2638 RSC.
- P. J. Britto, K. S. V. Santhanam and P. M. Ajayan, Bioelectrochem. Bioenerg., 1996, 41, 121–125 CrossRef.
- H. X. Luo, Z. J. Shi, N. Q. Li, Z. N. Gu and Q. K. Zhuang, Anal. Chem., 2001, 73, 915–920 CrossRef PubMed.
- M. Musameh, J. Wang, A. Merkoci and Y. H. Lin, Electrochem. Commun., 2002, 4, 743–746 CrossRef.
- Z. H. Wang, J. Liu, Q. L. Liang, Y. M. Wang and G. Luo, Analyst, 2002, 127, 653–658 RSC.
- K. B. Wu, J. J. Fei and S. S. Hu, Anal. Biochem., 2003, 318, 100–106 CrossRef PubMed.
- F. Valentini, A. Amine, S. Orlanducci, M. L. Terranova and G. Palleschi, Anal. Chem., 2003, 75, 5413–5421 CrossRef PubMed.
- I. Dumitrescu, P. R. Unwin, N. R. Wilson and J. V. Macpherson, Anal. Chem., 2008, 80, 3598–3605 CrossRef PubMed.
- N. X. Viet, Y. Ukita, M. Chikae, Y. Ohno, K. Maehashi, K. Matsumoto, P. H. Viet and Y. Takamura, Talanta, 2012, 91, 88–94 CrossRef PubMed.
- P. E. Sharel, T. S. Miller, J. V. Macpherson and P. R. Unwin, Phys. Chem. Chem. Phys., 2015, 17, 26394–26402 RSC.
- H. Tabei, M. Morita, O. Niwa and T. Horiuchi, J. Electroanal. Chem., 1992, 334, 25–33 CrossRef.
- O. Niwa and H. Tabei, Anal. Chem., 1994, 66, 285–289 CrossRef.
- R. Kostecki, X. Song and K. Kinoshita, Electrochem. Solid-State Lett., 1999, 2, 465–467 CrossRef.
- S. Ranganathan, R. McCreery, S. M. Majji and M. Madou, J. Electrochem. Soc., 2000, 147, 277–282 CrossRef.
- J. I. Heo, D. S. Shim, G. T. Teixidor, S. Oh, M. J. Madou and H. Shin, J. Electrochem. Soc., 2011, 158, J76–J80 CrossRef.
- M. Nihei, A. Kawabata and Y. Awano, Jpn. J. Appl. Phys., 2003, 42, L721–L723 CrossRef.
- M. Cantoro, S. Hofmann, S. Pisana, V. Scardaci, A. Parvez, C. Ducati, A. C. Ferrari, A. M. Blackburn, K. Y. Wang and J. Robertson, Nano Lett., 2006, 6, 1107–1112 CrossRef PubMed.
- G. D. Nessim, M. Seita, K. P. O'Brien, A. J. Hart, R. K. Bonaparte, R. R. Mitchell and C. V. Thompson, Nano Lett., 2009, 9, 3398–3405 CrossRef PubMed.
- H. Sugime, S. Esconjauregui, J. W. Yang, L. D'Arsié, R. A. Oliver, S. Bhardwaj, C. Cepek and J. Robertson, Appl. Phys. Lett., 2013, 103, 073116 CrossRef.
- H. Sugime, S. Esconjauregui, L. D'Arsié, J. W. Yang, T. Makaryan and J. Robertson, ACS Appl. Mater. Interfaces, 2014, 6, 15440–15447 CrossRef PubMed.
- N. Na, D. Y. Kim, Y. G. So, Y. Ikuhara and S. Noda, Carbon, 2015, 81, 773–781 CrossRef.
- H. Sugime, S. Esconjauregui, L. D'Arsié, J. Yang, A. W. Robertson, R. A. Oliver, S. Bhardwaj, C. Cepek and J. Robertson, ACS Appl. Mater. Interfaces, 2015, 7, 16819–16827 CrossRef PubMed.
- S. S. Fan, M. G. Chapline, N. R. Franklin, T. W. Tombler, A. M. Cassell and H. J. Dai, Science, 1999, 283, 512–514 CrossRef PubMed.
- K. Hata, D. N. Futaba, K. Mizuno, T. Namai, M. Yumura and S. Iijima, Science, 2004, 306, 1362–1364 CrossRef PubMed.
- Y. Murakami, S. Chiashi, Y. Miyauchi, M. H. Hu, M. Ogura, T. Okubo and S. Maruyama, Chem. Phys. Lett., 2004, 385, 298–303 CrossRef.
- W. Schultz, Nat. Rev. Neurosci., 2000, 1, 199–207 CrossRef PubMed.
- K. Jackowska and P. Krysinski, Anal. Bioanal. Chem., 2013, 405, 3753–3771 CrossRef PubMed.
- H. Sugime, S. Noda, S. Maruyama and Y. Yamaguchi, Carbon, 2009, 47, 234–241 CrossRef.
- D. N. Futaba, K. Hata, T. Yamada, T. Hiraoka, Y. Hayamizu, Y. Kakudate, O. Tanaike, H. Hatori, M. Yumura and S. Iijima, Nat. Mater., 2006, 5, 987–994 CrossRef PubMed.
- M. K. Zachek, P. Takmakov, B. Moody, R. M. Wightman and G. S. McCarty, Anal. Chem., 2009, 81, 6258–6265 CrossRef PubMed.
- H. R. Zafarani, K. Mathwig, E. J. R. Sudhölter and L. Rassaei, J. Electroanal. Chem., 2016, 760, 42–47 CrossRef.
- A. J. Bard and L. R. Faulkner, Electrochemical Methods, Wiley, New York, 2nd edn, 2001 Search PubMed.
- T. Zetterstrom, T. Sharp, C. A. Marsden and U. Ungerstedt, J. Neurochem., 1983, 41, 1769–1773 CrossRef PubMed.
- C. Amatore, R. S. Kelly, E. W. Kristensen, W. G. Kuhr and R. M. Wightman, J. Electroanal. Chem., 1986, 213, 31–42 CrossRef.
- L. H. Parsons and J. B. Justice, J. Neurochem., 1992, 58, 212–218 CrossRef PubMed.
- L. Falat and H. Y. Cheng, Anal. Chem., 1982, 54, 2108–2111 CrossRef.
- O. Niwa, M. Morita and H. Tabei, Electroanalysis, 1991, 3, 163–168 CrossRef.
- A. J. Downard, A. D. Roddick and A. M. Bond, Anal. Chim. Acta, 1995, 317, 303–310 CrossRef.
- E. Rozniecka, M. Jonsson-Niedziolka, A. Celebanska, J. Niedziolka-Jonsson and M. Opallo, Analyst, 2014, 139, 2896–2903 RSC.
- F. J. del Campo, L. Abad, X. Illa, E. Prats-Alfonso, X. Borrisé, J. M. Cirera, H.-Y. Bai and Y.-C. Tsai, Sens. Actuators, B, 2014, 194, 86–95 CrossRef.
- F. Bernsmann, J. C. Voegel and V. Ball, Electrochim. Acta, 2011, 56, 3914–3919 CrossRef.
Footnotes |
| † Electronic supplementary information (ESI) available. See DOI: 10.1039/c8an00528a |
| ‡ These authors contributed equally to this work. |
| This journal is © The Royal Society of Chemistry 2018 |

