 Open Access Article
A 2-aza-Cope reactivity-based platform for ratiometric fluorescence imaging of formaldehyde in living cells†
Thomas F.
Brewer
a,
Guillermo
Burgos-Barragan
b,
Niek
Wit
b,
Ketan J.
Patel
bc and
Christopher J.
Chang
 *ade
*ade
aDepartment of Chemistry, University of California, Berkeley, California 94720, USA. E-mail: chrischang@berkeley.edu
bMRC Laboratory of Molecular Biology, University of Cambridge, Francis Crick Avenue, Cambridge CB2 0QH, UK
cDepartment of Medicine, University of Cambridge, Addenbrooke’s Hospital, Cambridge CB2 2QQ, UK
dDepartment of Molecular and Cell Biology, University of California, Berkeley, California 94720, USA
eHoward Hughes Medical Institute, University of California, Berkeley, California 94720, USA
First published on 7th April 2017
Abstract
Formaldehyde (FA) is a major reactive carbonyl species (RCS) that is naturally produced in living systems through a diverse array of cellular pathways that span from epigenetic regulation to the metabolic processing of endogenous metabolites. At the same time, however, aberrant elevations in FA levels contribute to pathologies ranging from cancer and diabetes to heart, liver, and neurodegenerative diseases. Disentangling the complex interplay between FA physiology and pathology motivates the development of chemical tools that can enable the selective detection of this RCS in biological environments with spatial and temporal fidelity. We report the design, synthesis, and biological evaluation of ratiometric formaldehyde probe (RFAP) indicators for the excitation-ratiometric fluorescence imaging of formaldehyde production in living systems. RFAP-1 and RFAP-2 utilize FA-dependent aza-Cope reactivity to convert an alkylamine-functionalized coumarin platform into its aldehyde congener with a ca. 50 nm shift in the excitation wavelength. The probes exhibit visible excitation and emission profiles, and high selectivity for FA over a variety of RCS and related reactive biological analytes, including acetaldehyde, with up to a 6-fold change in the fluorescence ratio. The RFAP indicators can be used to monitor changes in FA levels in biological samples by live-cell imaging and/or flow cytometry. Moreover, RFAP-2 is capable of visualizing differences in the resting FA levels between wild-type cells and models with a gene knockout of ADH5, a major FA-metabolizing enzyme, establishing the utility of this ratiometric detection platform for identifying and probing sources of FA fluxes in biology.
Introduction
Formaldehyde (FA) is a reactive carbonyl species (RCS) that plays diverse roles in human health and disease. FA is a common environmental toxin, and is produced by a broad range of natural (e.g., forest fires, solar degradation of humic substances, and emissions from vegetation and microbes) and anthropogenic (e.g., industrial FA production, plywood manufacturing, and vehicle exhaust) sources.1 Indeed, FA is classified as a human carcinogen by the EPA, as environmental exposure to FA has long been associated with the initiation and progression of several types of cancer.2 Moreover, elevated levels of FA and other RCS have also been implicated in other disease states including neurodegenerative diseases, diabetes, and chronic liver and heart disorders.3–5 As such, environmental FA presents a significant risk to human health, and the permissible exposure level is set to 0.75 ppm by the OSHA.Despite its toxicity, FA is also a ubiquitous and essential metabolite in biological systems, where it is produced through diverse pathways including one-carbon metabolism,6,7 epigenetic N-demethylation of DNA, RNA, and histones,8–10 and small molecule metabolism.11 Indeed, FA production in the human body has been estimated to be as high as 1.4 mmol min−1.12 Compensatory FA metabolism by ADH5 (also known as FA dehydrogenase or ADH3) and ALDH2![[thin space (1/6-em)]](https://www.rsc.org/images/entities/char_2009.gif) 13 leads to steady-state FA concentrations ranging from 50–100 μM in blood to 200–500 μM intracellularly, although concentrations can reach as high as 800 μM in certain disease states.3,14–16
13 leads to steady-state FA concentrations ranging from 50–100 μM in blood to 200–500 μM intracellularly, although concentrations can reach as high as 800 μM in certain disease states.3,14–16
The signal/stress dichotomy of FA and its small, transient nature motivates the development of new chemical methods to enable its detection in living systems. However, traditional methods for FA analysis in biological samples17–22 typically involve extensive sample processing and/or destruction, leading to a loss of spatiotemporal resolution and an inability to follow FA fluxes in situ. Recent efforts by our laboratory23 and others24–33 have produced fluorescence-based probes for selective FA bioimaging using reactivity approaches,34–37 based largely on either 2-aza-Cope rearrangement or formimine formation as an FA-responsive reaction. These reagents have been found useful for FA detection in living cells,23–27 tissues,28–31 and food samples.32
Despite this notable progress in FA detection, several key challenges remain unresolved. In particular, the vast majority of the above-mentioned chemical tools for FA imaging rely on a turn-on response, which is useful for preserving spatial resolution for qualitative comparative studies but can limit quantitative measurements due to the potential variations in sample illumination and/or collection as well as non-homogeneous probe loading, particularly when the experimental conditions may alter the probe localization.38 An additional concern is the pH sensitivity of current fluorescence-based probes, which can lead to difficulty in interpreting results.
A potential solution to these issues is ratiometric imaging, a widely-used imaging modality which relies on a fluorescence ratio rather than intensity, where two signals can be used in concert to provide an internal calibration.38,39 Our laboratory has exploited this strategy for small-molecule and metal detection.40–42 Only one example of a ratiometric FA probe has been reported, but this dye relies on UV excitation (318 nm), which can have potential limitations due to spectral overlap with the absorption and autofluorescence of native biological chromophores like NADH.26
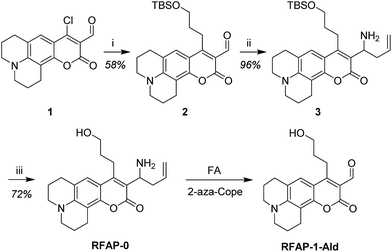
We now present the design, synthesis, and biological applications of a ratiometric formaldehyde probe (RFAP) platform of indicators that feature selective and sensitive FA detection in living systems with visible excitation and emission profiles. These probes act as chemodosimeters, in which the total signal can be accumulated over time and measured at various times as end point assays. As such, these reagents can increase signal-to-noise responses to transient molecules like FA even with the relatively high efficiency of FA metabolism in biological systems, thus allowing one to utilize relatively slow reactivity triggers that do not perturb and buffer the endogenous FA pools. Such irreversible probes complement reversible chemosensors, such as those employed by Lin and colleagues,27,28,31 in which a higher real-time resolution could be obtained. RFAP-0, RFAP-1, and RFAP-2 utilize aminocoumarin as the excitation-ratiometric fluorophore with an appended homoallylamine as the FA-responsive trigger. Condensation with FA triggers a 2-aza-Cope rearrangement with subsequent hydrolysis to release an aldehyde product with a red-shifted excitation wavelength, giving rise to a ratiometric readout (Scheme 1). Iterative synthetic designs to improve the FA reactivity via a gem-dimethyl substitution as well as cellular localization provide a first-generation ratiometric FA probe with visible excitation and emission profiles, RFAP-2, which enables the detection of differences in the resting levels of FA between wild-type and knockout models lacking ADH5, a major FA-metabolizing enzyme which regulates the endogenous FA pools in the cell.
Results and discussion
Synthesis and in vitro characterization of RFAP-0
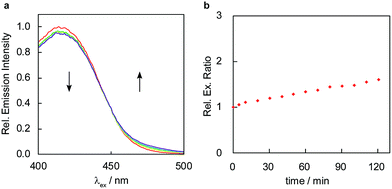
To develop a ratiometric FA indicator, we set out to incorporate the parent unsubstituted homoallylamine trigger that was independently developed by our lab and Chan’s group23,24 onto a julolidine-based coumarin indicator and to synthesize RFAP-0 in three steps from known compound 1.43 In this design, we envisioned that the push–pull nature of the product fluorophore bearing an electron-withdrawing aldehyde group would be electronically distinct from the masked probe bearing a more electron-rich homoallylamine functionality. The reaction with FA would enable the conversion of this electron-rich group into an electron-poor one via an aza-Cope rearrangement.The homoallylamine trigger was installed by an allylboronic acid pinacol ester-mediated aminoallylation (Scheme 2). We evaluated the reactivity of RFAP-0 toward 100 μM FA in aqueous solution at physiological pH (PBS, pH 7.4) and found that upon its reaction with FA it displays the predicted 50 nm shift in the excitation wavelength from 420 nm to 470 nm (Fig. 1a) as it forms the aldehyde product RFAP-1-Ald. However, the reaction rate was found to be sluggish, with a bimolecular rate constant of 0.017 M−1 s−1 (Fig. S1†), limiting its application in the detection of FA in biological systems. Indeed, after a 2 hour incubation of 10 μM RFAP-0 with 100 μM FA, only a 1.6-fold excitation ratio change was observed (Fig. 1b).
To accelerate the kinetics of the FA detection reaction, we redesigned the RFAP platform to include a geminal dimethyl group in the homoallylamine trigger (Scheme 3). It is well-established that such geminal dialkyl substituents accelerate reactions with cyclic transition states via the Thorpe–Ingold effect,44 so we reasoned that this substitution may significantly increase the rate of the aza-Cope rearrangement. In particular, we hypothesized that the increased thermodynamic stabilization on going from a monosubstituted alkene to a trisubstituted alkene during the course of the reaction could further bias the aza-Cope rearrangement toward the desired product.
 | ||
| Scheme 3 Installation of a geminal dimethyl group is designed to accelerate the 2-aza-Cope rearrangement and thermodynamically bias the reaction toward the desired product. | ||
Synthesis and in vitro characterization of RFAP-1
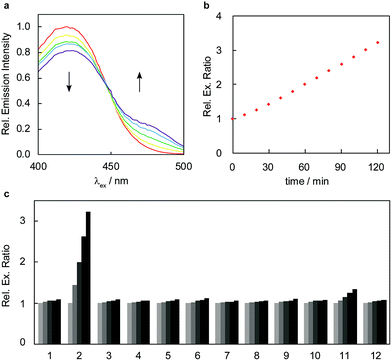
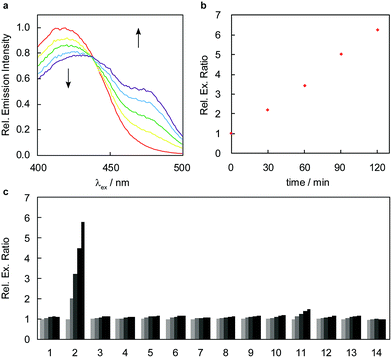
With these design considerations in mind, RFAP-1 was synthesized in two steps from compound 2. The key functionalization step involved a prenylboronic acid-mediated aminoallylation (Scheme 4).45,46 With RFAP-1 in hand, we evaluated its properties in aqueous solution buffered to physiological pH (PBS, pH 7.4). Similar to RFAP-0, the probe shows a 50 nm-shift in the excitation wavelength upon its incubation with 100 μM FA in vitro (Fig. 2a). Gratifyingly, this occurs with a bimolecular rate constant of 0.12 M−1 s−1, showing a ca. 7-fold rate increase relative to RFAP-0 (Fig. S1†). Accordingly, RFAP-1 displays an improved 3.2-fold excitation ratio change after its incubation with 100 μM FA for 2 hours (Fig. 2b). This ratiometric shift is also observed in the UV/visible absorbance spectra (Fig. S2†), and matches the excitation profile of the independently prepared RFAP-1-Ald (Fig. S3†). Based on the excitation spectra of RFAP-1 and RFAP-1-Ald, the minimum in vitro 470/420 nm excitation ratio Rmin is 0.1 and the maximum excitation ratio Rmax is 3.1. Additionally, the emission profiles of RFAP-1 and RFAP-1-Ald suggest that RFAP-1 could be used in an emission ratiometric mode (Fig. S3†). To verify that the observed ratiometric FA response was the result of the proposed 2-aza-Cope reaction, the reaction between RFAP-1 and FA was monitored by LC-MS, which shows the clean conversion of RFAP-1 to a product with the expected mass of RFAP-1-Ald (Fig. S4†). | ||
| Scheme 4 Synthesis of RFAP-1. Reagents and conditions: (i) NH3, MeOH, 0 °C, then prenylboronic acid, rt, 10 h; (ii) AcOH, H2O, rt, 14 h. | ||
The high optical brightness of both RFAP-1 (ϕfl = 0.61, ε420 = 2 × 10³ M−1 cm−1) and its aldehyde product RFAP-1-Ald (ϕfl = 0.45, ε470 = 4 × 10⁴ M−1 cm−1) results in a large change in absolute intensity upon the conversion of an electron-donating amine pendant to a more electron-withdrawing aldehyde functionality. Moreover, RFAP-1 also displays no pH-dependent variations within the physiological range, showing a consistent excitation ratio from pH 4–8 (Fig. S5†). Owing to its aza-Cope trigger, RFAP-1 exhibits a high selectivity for FA over an array of potentially competing RCS and carbonyl-containing molecules (Fig. 2c). Only methylglyoxal added at superphysiological concentrations (100 μM) gives a slight ratio response, but no background reactivity is observed with 10 μM methylglyoxal, which is patently above its single-digit micromolar physiological range.47
Application of RFAP-1 to imaging FA in living cells
We next evaluated the ability of RFAP-1 to detect changes in FA levels in living cells using confocal microscopy to monitor the FA-dependent fluorescence signals in ratiometric mode (Fig. 3). HEK293T cells were loaded with 10 μM RFAP-1 for 30 minutes and then washed to remove excess probe. Different concentrations of FA were then added. The data show a significant, dose-dependent excitation ratio change in the cells treated with FA compared to the control cells (Fig. 3). We verified, using a Sytox Red exclusion assay, that neither RFAP-1 nor the aldehyde product RFAP-1-Ald of the 2-aza-Cope reaction have a significant impact on the cell viability (Fig. S6†). Additionally, HEK293T cells incubated in buffer alone show negligible autofluorescence under our imaging conditions, verifying that the observed signal is from RFAP-1 (Fig. S7†). Importantly, the fluorescence ratio change was statistically significant for the concentrations of exogenously added FA down to 50 μM (Fig. 3k), which represents a ca. 10-fold improvement in the FA sensitivity in the cells for this ratiometric indicator over the previously-reported turn-on fluorescent probe FAP-1 that also relies on a 2-aza-Cope reaction trigger.23 We determined the maximum possible in cellulo ratio change ΔRmax to be 470 ± 10 by comparing HEK293T cells loaded with RFAP-1 to cells loaded with RFAP-1-Ald (Fig. S8†). However, more detailed analyses showed the subcellular localization of RFAP-1 to be uneven and it adopted a punctate staining pattern (Fig. S9†), which may pose a potential limitation for its use in other cell types.Design, synthesis, and in vitro characterization of RFAP-2, a second-generation ratiometric FA indicator
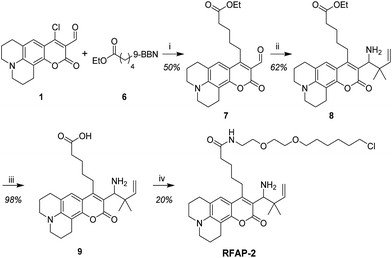
To design a fluorescent FA probe that exhibits more homogeneous staining and subcellular localization over diverse cell types while maintaining a high FA selectivity and responsiveness in a ratiometric mode, we focused our attention on retaining the same gem-dimethyl homoallylamine coumarin core with a modification of the pendant hydroxypropyl sidechain. In particular, we decided to install a carboxylic acid moiety as a general and hydrophilic synthetic handle to provide access to a variety of modified RFAPs through standard amide coupling approaches. To this end, an ester side chain was installed on the coumarin core through an sp2–sp3 Suzuki coupling reaction,48 followed by aminoallylation and saponification, furnishing the carboxylic acid-functionalized coumarin intermediate 9 (Scheme 5). We then surveyed a variety of amines to couple to this RFAP building block; one representative example is RFAP-2, which contains an amide with an ethylene glycol-hexyl chloride moiety reminiscent of the HaloTag substrate.49 This side chain was initially installed to facilitate the labeling of the HaloTag protein, but instead, it was found to display a substantially improved staining in the cells and was carried forward as a second-generation ratiometric FA probe.RFAP-2 shows similar photophysical properties (ϕfl = 0.69, ε420 = 1.1 × 10⁴ M−1 cm−1) and in vitro reactivity to FA compared with RFAP-1, with a 6-fold excitation ratio change to 100 μM FA observed in 2 hours (Fig. 4a and b). This ratiometric change is also reflected in the corresponding UV/visible absorbance spectra upon the conversion of the homoallylamine probe to the aldehyde product RFAP-2-Ald (Fig. S2†), and matches the excitation profile of the independently-prepared RFAP-2-Ald (Fig. S3†). Similar to RFAP-1 and RFAP-1-Ald, RFAP-2 and RFAP-2-Ald also display emission profiles that suggest RFAP-2 could be used in an emission ratiometric mode (Fig. S3†). Based on the excitation spectra of RFAP-2 and RFAP-2-Ald, the minimum in vitro 470/420 nm excitation ratio Rmin is 0.1 and the maximum excitation ratio Rmax is 3.1. At a 10 μM concentration of RFAP-2 and at a 2 hour cutoff, the in vitro detection limit for FA was found to be 0.3 μM (Fig. S10†). Owing to its 2-aza-Cope reactivity switch, RFAP-2 retains the high selectivity of RFAP-1 for FA (Fig. 4c) over a variety of potential biologically relevant RCS competitors (4-hydroxynonenal, dehydroascorbate, glucosone, oxaloacetate, acrolein, and methylglyoxal), various carbonyl-containing molecules (acetaldehyde, pyruvate, and glucose), as well as oxidizing and reducing reagents/conditions that could be encountered in the cell (H2O2 and glutathione). Similar to RFAP-1, superphysiological levels of methylglyoxal (100 μM) can provide a minor background response, but the addition of methylglyoxal at physiological concentrations (10 μM) gives no significant fluorescence ratio change.
Application of RFAP-2 to ratiometric fluorescence imaging changes in FA levels in living cells
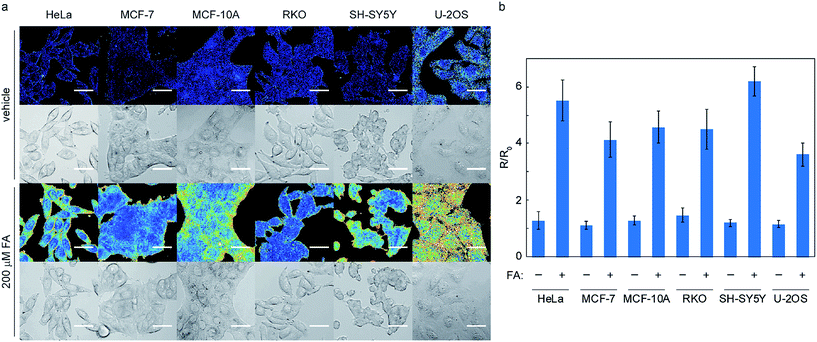
With data establishing that RFAP-2 can selectively detect FA in aqueous solution with high sensitivity, we next evaluated its ability to detect changes in FA levels in cellulo by ratiometric fluorescence imaging using confocal microscopy. HEK293T cells were treated with 10 μM RFAP-2 for 30 min, followed by washing them to remove excess probe and then the addition of FA at various doses (50 to 200 μM). The cells show a significant and FA dose-dependent excitation ratio change similar to what is observed for RFAP-1 (Fig. 5). Moreover, RFAP-2 displayed an even staining pattern in the HEK293T cells, in contrast to the punctate localization of RFAP-1 (Fig. S9†), indicating its broader utility for probing FA biology. We determined the maximum possible in cellulo ratio change ΔRmax to be 770 ± 20 by comparing the HEK293T cells loaded with RFAP-2 to the cells loaded with RFAP-2-Ald (Fig. S8†). We additionally found that incubation with 10 μM RFAP-2 had no significant impact on cell viability using a Sytox Red exclusion assay (Fig. S6†). To validate the use of RFAP-2 for FA detection in a wider range of biological models, we evaluated its performance in a variety of commonly-used cell lines, including HeLa, MCF-7, MCF-10A, RKO, SH-SY5Y, and U-2OS cells. In the cell lines tested, RFAP-2 displayed excellent FA responsiveness (Fig. 6), as well as generally diffuse cell staining (Fig. S11†), in all of the cell types tested with the exception of U-2OS cells, where the dye was FA-responsive but was localized with a punctate staining pattern.It is worth noting that the cells incubated with RFAP-2 alone show relatively small changes in the excitation ratio over time, indicating that the resting levels of intracellular FA may potentially be lower than estimated based on the bulk measurements on tissue and animal samples in the literature that place the FA levels on the order of 100–200 μM or more.3,14–16 From the RFAP-2 data collected, the predicted endogenous intracellular FA concentration estimated from a calibration curve under these conditions is in the range of ca. 25 μM (Fig. S12†). However, because FA can rapidly diffuse across cellular membranes,50 differences observed between the present measurements in a dissociated culture versus tissue and animal samples may be markedly influenced by the various media exchanges used in dissociated cell culture procedures that could wash out endogenously-produced FA.
Ratiometric fluorescence imaging identifies elevated FA levels in an ADH5 genetic knockout model
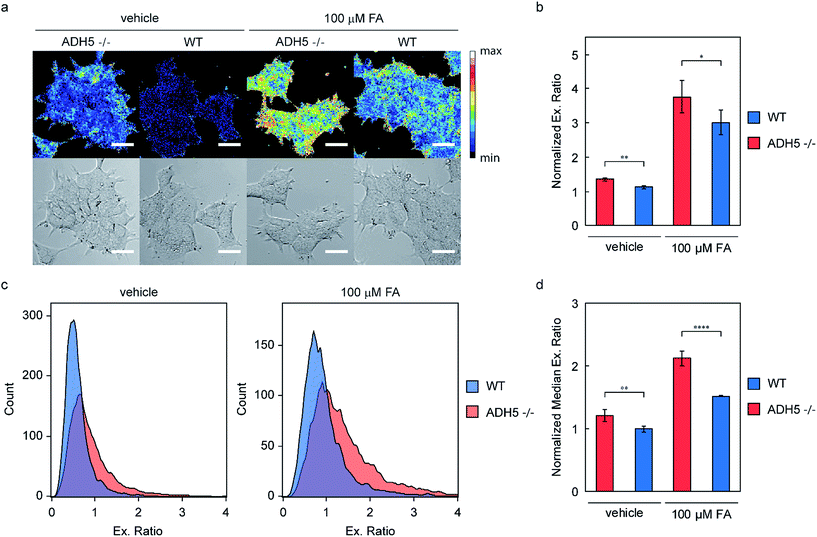
To demonstrate the use of RFAP-2 as a chemical tool beyond exogenous FA detection, we decided to investigate its potential for detecting changes in endogenous FA metabolism and thus turned our attention to an ADH5 genetic knockout model.51 Since ADH5 is the predominant FA-metabolizing enzyme in the cell and is central to regulating the resting levels of this one-carbon metabolite, we predicted that cells lacking ADH5 would have elevated levels of FA. Additionally, challenging these cells with exogenous FA should lead to increased levels of FA in ADH5 −/− cells relative to wild-type (WT) cells due to the impaired FA metabolism.Accordingly, we treated genetically matched HAP1 ADH5 −/− and WT cells with 500 nM RFAP-2 for 30 min, followed by washing them to remove excess probe and incubating them with either vehicle or 100 μM FA for 60 minutes. As predicted, the ADH5 −/− cells showed a statistically significant increase in the RFAP-2 excitation ratio relative to the WT cells under both vehicle and 100 μM FA treatment by confocal microscopy (Fig. 7a and b). The observed increase in the RFAP-2 excitation ratio observed in the ADH5 −/− cells treated with vehicle confirms our hypothesis that ADH5 is involved in regulating the resting levels of FA in cells and that ADH5 −/− cells have higher endogenous, basal levels of FA relative to the WT cells. Moreover, the data verify that RFAP-2 is capable of detecting changes in endogenous levels of FA. Along the same lines, the statistically significant difference in the RFAP-2 excitation ratio between the ADH5 −/− and WT cells challenged with 100 μM FA confirms the impaired ability of the ADH5 −/− cells to metabolize FA. Additionally, using a Sytox Red exclusion assay, we found that incubation of the ADH5 −/− or WT HAP1 cells with 10 μM RFAP-2 in the presence or absence of 100 μM FA showed no significant differences in the cell viability (Fig. S13†).
To further validate the ability of RFAP-2 to detect these changes in the endogenous FA concentration and metabolism in ADH5 −/− vs. WT HAP1 cells, we turned to flow cytometry, a high-throughput analytical technique that allows the analysis of far greater numbers of cells. We treated the ADH5 −/− and WT HAP1 cells with the same conditions as above and observed a statistically significant increase in the RFAP-2 excitation ratio for the vehicle-treated ADH5 −/− cells relative to the WT cells, as well as a statistically significant increase in the RFAP-2 excitation ratio for the 100 μM FA-treated ADH5 −/− cells relative to the WT cells (Fig. 7c and d). The flow cytometry results corroborate our confocal imaging results, establishing that RFAP-2 is capable of detecting changes in the endogenous levels and metabolism of FA, and indicate the potential utility of RFAP-2 in FACS-mediated screens for changes in FA levels.
Conclusions
To summarize, we have presented the design, synthesis, and biological evaluation of the RFAP series of excitation-ratiometric FA probes. These reagents feature visible excitation and emission profiles and show a high selectivity and sensitivity to changes in FA levels in vitro and in cellulo. The RFAP platform utilizes an aminocoumarin core with an appended FA-responsive homoallylamine, which upon condensation with FA and subsequent 2-aza-Cope rearrangement and hydrolysis, generates a resultant electron-withdrawing aldehyde moiety that causes an excitation wavelength shift of ca. 50 nm from 420 nm to 470 nm. Importantly, the introduction of a geminal dimethyl substituent increases the FA-dependent probe reactivity by ca. one order of magnitude. Utilizing dual excitation wavelengths, RFAP-1 and RFAP-2 enable the ratiometric imaging of FA fluxes in living cells, and the latter probe is also amenable to flow cytometry. RFAP-1 and RFAP-2 possess a variety of attractive photophysical characteristics, including visible excitation and emission profiles, high optical brightness for both the dye and product to enable highly sensitive FA detection, as well as a marked insensitivity towards changes in pH within physiological ranges spanning from acidic to basic conditions.While being sensitive and selective to FA, RFAP-1 displays uneven staining patterns that can limit its utility in certain applications, but the development of a next-generation RFAP-2 reagent alleviates this issue and allows for a more even staining in a wider variety of cell types. Indeed, the data showcase the broad applicability of RFAP-2 to image changes in FA levels in a variety of common cell lines. We further utilized this reagent to identify changes in the endogenous levels of FA in cells lacking the FA-metabolizing enzyme ADH5, as well as impairments in FA metabolism in these cells. Current efforts are focused on applying RFAP-2 to discover and study new sources in FA fluxes in biological systems, as well as on using this platform as a general starting point to develop probes for the molecular imaging of FA within specific subcellular locales, including mitochondrial and nuclear systems that are likely to utilize this one-carbon unit in various pathways spanning from signalling to metabolism.
Acknowledgements
We thank the NIH (GM 79465) for financial support for synthetic aspects of the work. C. J. C. is an investigator at the Howard Hughes Medical Institute. T. F. B. was partially supported by a Chemical Biology Training Grant from the NIH (T32 GM066698). We thank Alison Killilea and Carissa Tasto (UC Berkeley Tissue Culture Facility) as well as Hector Nolla (UC Berkeley Flow Cytometry Facility) for expert technical assistance.Notes and references
- R. G. Liteplo, R. Beauchamp, M. E. Meek and R. Chénier, in Formaldehyde (Concise International Chemical Assessment Documents), World Health Organization, Geneva, 2002 Search PubMed.
- R. Baan, Y. Grosse, K. Straif, B. Secretan, F. El Ghissassi, V. Bouvard, L. Benbrahim-Tallaa, N. Guha, C. Freeman, L. Galichet and V. Cogliano, Lancet Oncol., 2009, 10, 1143–1144 CrossRef PubMed.
- Z. Tong, C. Han, W. Luo, X. Wang, H. Li, H. Luo, J. Zhou, J. Qi and R. He, Age, 2013, 35, 583–596 CrossRef PubMed.
- J. Miao and R. He, Chronic Formaldehyde-Mediated Impairments and Age-Related Dementia, InTech, Shanghai, 2012 Search PubMed.
- K. Tulpule and R. Dringen, J. Neurochem., 2013, 127, 7–21 CAS.
- D. H. Porter, R. J. Cook and C. Wagner, Arch. Biochem. Biophys., 1985, 243, 396–407 CrossRef CAS PubMed.
- D. Leys, J. Basran and N. S. Scrutton, EMBO J., 2003, 22, 4038–4048 CrossRef CAS PubMed.
- T. P. Wu, T. Wang, M. G. Seetin, Y. Lai, S. Zhu, K. Lin, Y. Liu, S. D. Byrum, S. G. Mackintosh, M. Zhong, A. Tackett, G. Wang, L. S. Hon, G. Fang, J. A. Swenberg and A. Z. Xiao, Nature, 2016, 532, 329–333 CrossRef CAS PubMed.
- Y. Fu, D. Dominissini, G. Rechavi and C. He, Nat. Rev. Genet., 2014, 15, 293–306 CrossRef CAS PubMed.
- Y. Shi and J. R. Whetstine, Mol. Cell, 2007, 25, 1–14 CrossRef CAS PubMed.
- J. O’Sullivan, M. Unzeta, J. Healy, M. I. O’Sullivan, G. Davey and K. F. Tipton, NeuroToxicology, 2004, 25, 303–315 CrossRef.
- S. S. Dhareshwar and V. J. Stella, J. Pharm. Sci., 2008, 97, 4184–4193 CrossRef CAS PubMed.
- S. Teng, K. Beard, J. Pourahmad, M. Moridani, E. Easson, R. Poon and P. J. O’Brien, Chem.-Biol. Interact., 2001, 130–132, 285–296 CrossRef CAS PubMed.
- H. D. Heck, M. Casanova-Schmitz, P. B. Dodd, E. N. Schachter, T. J. Witek and T. Tosun, AIHA J., 1985, 46, 1–3 CrossRef CAS PubMed.
- M. E. Andersen, H. J. Clewell, E. Bermudez, D. E. Dodd, G. A. Willson, J. L. Campbell and R. S. Thomas, Toxicol. Sci., 2010, 118, 716–731 CrossRef CAS PubMed.
- Z. Tong, W. Luo, Y. Wang, F. Yang, Y. Han, H. Li, H. Luo, B. Duan, T. Xu, Q. Maoying, H. Tan, J. Wang, H. Zhao, F. Liu and Y. Wan, PLoS One, 2010, 5, e10234 Search PubMed.
- T. Szarvas, E. Szatlóczky, J. Volford, L. Trézl, E. Tyihák and I. Rusznák, J. Radioanal. Nucl. Chem., 1986, 106, 357–367 CrossRef CAS.
- S. E. Ebeler, A. J. Clifford and T. Shibamoto, J. Chromatogr., Biomed. Appl., 1997, 702, 211–215 CrossRef CAS.
- P. Španěl, D. Smith, T. A. Holland, W. Al Singary and J. B. Elder, Rapid Commun. Mass Spectrom., 1999, 13, 1354–1359 CrossRef.
- S. Kato, P. J. Burke, T. H. Koch and V. M. Bierbaum, Anal. Chem., 2001, 73, 2992–2997 CrossRef CAS PubMed.
- P. H. Yu, C. Cauglin, K. L. Wempe and D. Gubisne-Haberle, Anal. Biochem., 2003, 318, 285–290 CrossRef CAS PubMed.
- W. Luo, H. Li, Y. Zhang and C. Y. W. Ang, J. Chromatogr., Biomed. Appl., 2001, 753, 253–257 CrossRef CAS.
- T. F. Brewer and C. J. Chang, J. Am. Chem. Soc., 2015, 137, 10886–10889 CrossRef CAS PubMed.
- A. Roth, H. Li, C. Anorma and J. Chan, J. Am. Chem. Soc., 2015, 137, 10890–10893 CrossRef CAS PubMed.
- J. Xu, Y. Zhang, L. Zeng, J. Liu, J. M. Kinsella and R. Sheng, Talanta, 2016, 160, 645–652 CrossRef CAS PubMed.
- L. He, X. Yang, Y. Liu, X. Kong and W. Lin, Chem. Commun., 2016, 52, 4029–4032 RSC.
- Y. Tang, X. Kong, Z.-R. Liu, A. Xu and W. Lin, Anal. Chem., 2016, 88, 9359–9363 CrossRef CAS PubMed.
- Y. Tang, X. Kong, A. Xu, B. Dong and W. Lin, Angew. Chem., Int. Ed., 2016, 55, 3356–3359 CrossRef CAS PubMed.
- Z. Xie, J. Ge, H. Zhang, T. Bai, S. He, J. Ling, H. Sun and Q. Zhu, Sens. Actuators, B, 2017, 241, 1050–1056 CrossRef CAS.
- J.-B. Li, Q.-Q. Wang, L. Yuan, Y.-X. Wu, X.-X. Hu, X.-B. Zhang and W. Tan, Analyst, 2016, 141, 3395–3402 RSC.
- Y. H. Lee, Y. Tang, P. Verwilst, W. Lin and J. S. Kim, Chem. Commun., 2016, 52, 11247–11250 RSC.
- L. He, X. Yang, M. Ren, X. Kong, Y. Liu and W. Lin, Chem. Commun., 2016, 52, 9582–9585 RSC.
- C. Liu, X. Jiao, S. He, L. Zhao and X. Zeng, Dyes Pigm., 2017, 138, 23–29 CrossRef CAS.
- J. Chan, S. C. Dodani and C. J. Chang, Nat. Chem., 2012, 4, 973–984 CrossRef CAS PubMed.
- X. Chen, X. Tian, I. Shin and J. Yoon, Chem. Soc. Rev., 2011, 40, 4783–4804 RSC.
- D.-G. Cho and J. L. Sessler, Chem. Soc. Rev., 2009, 38, 1647–1662 RSC.
- Y. Yang, Q. Zhao, W. Feng and F. Li, Chem. Rev., 2013, 113, 192–270 CrossRef CAS PubMed.
- R. Y. Tsien, Trends Neurosci., 1988, 11, 419–424 CrossRef CAS PubMed.
- M. H. Lee, J. S. Kim and J. L. Sessler, Chem. Soc. Rev., 2015, 44, 4185–4191 RSC.
- D. Srikun, E. W. Miller, D. W. Domaille and C. J. Chang, J. Am. Chem. Soc., 2008, 130, 4596–4597 CrossRef CAS PubMed.
- A. E. Albers, V. S. Okreglak and C. J. Chang, J. Am. Chem. Soc., 2006, 128, 9640–9641 CrossRef CAS PubMed.
- A. T. Aron, M. O. Loehr, J. Bogena and C. J. Chang, J. Am. Chem. Soc., 2016, 138, 14338–14346 CrossRef CAS PubMed.
- D. R. Rooker and D. Buccella, Chem. Sci., 2015, 6, 6456–6461 RSC.
- M. E. Jung and G. Piizzi, Chem. Rev., 2005, 105, 1735–1766 CrossRef CAS PubMed.
- M. Raducan, R. Alam and K. J. Szabó, Angew. Chem., Int. Ed., 2012, 51, 13050–13053 CrossRef CAS PubMed.
- M. Sugiura, K. Hirano and S. Kobayashi, J. Am. Chem. Soc., 2004, 126, 7182–7183 CrossRef CAS PubMed.
- M. P. Kalapos, Diabetes Res. Clin. Pract., 2013, 99, 260–271 CrossRef CAS PubMed.
- C. Valente, S. Baglione, D. Candito, C. J. O’Brien and M. G. Organ, Chem. Commun., 2008, 735–737 RSC.
- G. V. Los, L. P. Encell, M. G. McDougall, D. D. Hartzell, N. Karassina, C. Zimprich, M. G. Wood, R. Learish, R. F. Ohana, M. Urh, D. Simpson, J. Mendez, K. Zimmerman, P. Otto, G. Vidugiris, J. Zhu, A. Darzins, D. H. Klauber, R. F. Bulleit and K. V. Wood, ACS Chem. Biol., 2008, 3, 373–382 CrossRef CAS PubMed.
- E. A. Hoffman, B. L. Frey, L. M. Smith and D. T. Auble, J. Biol. Chem., 2015, 290, 26404–26411 CrossRef CAS PubMed.
- L. B. Pontel, I. V. Rosado, G. Burgos-Barragan, J. I. Garaycoechea, R. Yu, M. J. Arends, G. Chandrasekaran, V. Broecker, W. Wei, L. Liu, J. A. Swenberg, G. P. Crossan and K. J. Patel, Mol. Cell, 2015, 60, 177–188 CrossRef CAS PubMed.
Footnote |
| † Electronic supplementary information (ESI) available: Experimental details, including general methods, synthetic details, NMR spectra, in vitro detection limit, and supplemental figures. See DOI: 10.1039/c7sc00748e |
| This journal is © The Royal Society of Chemistry 2017 |


