Continuous flow hydrogenations using novel catalytic static mixers inside a tubular reactor†
A.
Avril
,
C. H.
Hornung
 *,
A.
Urban
,
D.
Fraser
,
M.
Horne
,
J.-P.
Veder
,
J.
Tsanaktsidis
,
T.
Rodopoulos
,
C.
Henry
and
D. R.
Gunasegaram
CSIRO Manufacturing, Bag 10, Clayton South, Victoria 3169, Australia. E-mail: christian.hornung@csiro.au
First published on 20th December 2016
Abstract
This work describes a novel continuous flow reactor concept for organic synthesis using heterogeneous catalysts. The concept is based on static mixers coated with a catalytic metal layer, which can be inserted into standard stainless steel reactor tubing. The static mixers were prepared by 3D metal printing, allowing for maximum design flexibility and thus can be tailored to a large number of chemical synthesis applications. The nickel or platinum catalysts were deposited either by metal cold spraying or electrodeposition, which allows for potential scale up and mass production and these techniques are compatible with a range of different catalytic metals. The catalytic flow reactor was evaluated for a series of continuous flow hydrogenations of alkenes and carbonyls.
Introduction
Flow chemistry has attracted significant interest for many organic synthesis applications over the past decade because it embodies several principles of green chemistry and process intensification.1–5 Especially the field of heterogeneous catalysis has spawned a series of new reactor devices and concepts for laboratory scale continuous flow processing, which incorporate aspects of the well documented portfolio of flow chemistry benefits over classical batch procedures.6–12 Yet these reactors are significantly more complex and specialised than their homogeneous liquid phase or liquid–liquid phase counterparts, hence their impact in organic chemistry research and industrial chemical product development has not been as noticeable and widespread.Most continuous flow concepts for heterogeneous catalysis developed to date can be classified as variations of one of the following three inherently different reactor designs: a) fixed beds containing porous catalytic particles or beads, which can be made from inorganic materials or polymers,13–19 b) porous polymer or inorganic monoliths with embedded catalyst,20–25 c) porous catalytic layers deposited onto chip- or platelet-based devices.26–31 We are following a new approach by using simple, well established and evaluated tubular reactor technology, which we retrofitted with specially designed catalytic inserts, termed catalytic static mixers (CSMs). The metal scaffolds of these CSMs are made by additive manufacture and the catalyst can be deposited directly using a range of different metal deposition methods. Herein we have investigated the use of electroplating and cold spraying for the deposition of catalytic nickel(0) and platinum(0), but the general CSM approach is not limited to these two methods and metal catalysts. Metal scaffolds have good mechanical stability, they are much less brittle than ceramics and much harder and more scratch resistant than most plastics. They can easily be inserted into tubular reactor geometries and replaced multiple times without damage. They have superior temperature and solvent stability compared to most polymers and many other composite materials. The tubular channel geometry ensures that pressure drop is low and that the flow is regular. This is a big advantage over most monolithic type materials and particle- or bead-based solid support systems, which often suffer from high pressure drops and irregular flow.13–15,20–25 For most bed or monolith systems, temperature and concentration gradients are highly non-uniform along the cross section and to a lesser extend also in the longitudinal direction, and resulting temperature and concentration hotspots can be problematic. Additionally, the size of monoliths is often limited to small preparative or laboratory scales; e.g. Ingham et al.21 report that 15 mm is the largest diameter at which the temperature gradient across the column during synthesis still allows for an effective polymerization of their monolith; tubular reactors on the other hand are easily scalable devices. Both, supported polymer bead and monolith systems, are made by a complex, often multi-stage synthesis and require elaborate preparation and washing protocols, which are not necessary for the herein presented CSMs. One of the biggest advantages of a tubular reactor system is the large L/D ratio which results in superior control of heat and mass transfer along the length of the reactor device, avoiding issues with non-uniformity often plaguing conventional designs.
A similar approach to our metal CSMs, describing a tubular catalytic reactor was recently published by Elias and co-workers;32 here the porous tubular reactor, which was manufactured by selective laser sintering, was first coated with a metal-oxide layer before palladium nanoparticles were deposited onto said layer.
In tubular flow reactors with diameters of several millimetres and more, static mixers are classically used to ensure continuous mixing. Mixer designs vary depending on the flow conditions, laminar or turbulent, and the fluids, liquids, gases or mixtures, and can have a major impact on the performance of the reaction process. By using additive manufacture, i.e. 3D metal printing, limitations of classical sheet metal forming techniques can be overcome leading to complete freedom over design. The guiding principles we used for the CSM design were a) mixing performance for a given set of fluid flow conditions, b) maximum surface area and viability for catalyst deposition using cold spraying or electroplating, and c) structural integrity. Our concept was then evaluated using a prototype plug flow tubular reactor (PFTR) containing 6 mm ID stainless steel tubes, which were fitted with our CSMs. The catalytic reactor concept was evaluated for a series of metal-catalysed gas–liquid hydrogenations33–36 in continuous flow using the model organic compounds, vinyl acetate, oleic acid and cinnamaldehyde.
Experimental
Catalytic static mixers
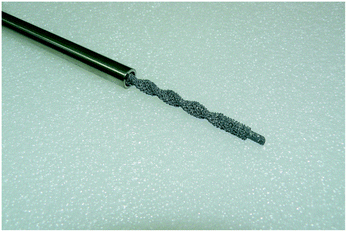
CSMs are derived from static mixer concepts, whereby an optimised mixer geometry is coated with catalyst and fitted inside a tubular flow reactor, as shown in Fig. 1. All CSMs were prepared at CSIRO using a combination of additive manufacturing and metal deposition techniques. The flow reactor contains four catalytic tube sections, hence one catalyst set consists of four identical CSMs. The set Pt-EP-Ti-D2 is an exception, as it consists only of three catalytic mixers coated with Pt, and a fourth uncoated, non-catalytic static mixer (see Table 1).| Catalyst | m CSM [g] | m cat [g] | V CSM [ml] | V R [ml] | ϕ [%] |
|---|---|---|---|---|---|
| a The set Pt-EP-Ti-D2 consisted only of three catalytic mixers coated with Pt, and a fourth uncoated, non-catalytic static mixer. | |||||
| X-X-Ti-D1 | 9.6 | 0.0 | 2.1 | 14.9 | 87.5 |
| Ni-EP-CoCr-D1 | 24.4 | 1.0 | 3.1 | 13.9 | 81.7 |
| Ni-EP-Ti-D1 | 11.5 | N/V | 2.7 | 14.3 | 84.3 |
| Ni-CS-Ti-D1 | 11.3 | 2.0 | N/V | N/V | N/V |
| Ni-CS-SS-D3 | 15.6 | 3.3 | 2.0 | 15.0 | 88.2 |
| Pt-EP-Ti-D2 | 16.2 | 0.4 | 2.9 | 14.1 | 83.2 |
A total of six catalyst sets were prepared for this work (see Table 1). The catalyst layers of three CSM sets were deposited by electroplating, Ni-EP-CoCr-D1, Ni-EP-Ti-D1 and Pt-EP-Ti-D2, and a further two sets were coated by cold spraying, Ni-CS-Ti-D1 and Ni-CS-SS-D3. For baseline comparison, one set of uncoated mixers was prepared, X-X-Ti-D1; this set was prepared from Ti, using design D1 and does not contain a catalytic layer.
Three different scaffold materials were investigated, a titanium alloy (Ti6Al4V), a cobalt chrome alloy (CoCr) and 316 L stainless steel (SS), and two different metal catalysts were deposited, Ni(0) and Pt(0). Three different mixer designs were used, D1, D2 and D3, shown in Fig. 2.
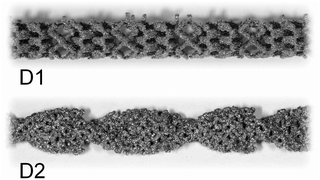 | ||
| Fig. 2 Photographic images of CSM designs D1 and D2; the design D3 cannot be disclosed due to commercial in confidence, it is available upon request from Cambridge Reactor Design.37 | ||
Two designs were developed at CSIRO specifically for 3D metal printing, D1 and D2, while D3 is a commercial design developed by Cambridge Reactor Design,37 which was manufactured using conventional sheet metal fabrication methods. D1 and D2 are optimised for laminar flow conditions, while D3 is mainly tailored for maximising heat transfer and mixing under transient and turbulent conditions.‡ While the 3D printed designs, D1 and D2, have significant amount of macroscopic porosity, D3, which is made from metal ribbon, has a smooth surface and no concealed internal volume. Hence, D3 is more applicable to a deposition method that requires line-of-sight access, such as cold spraying, while D1 and D2 are also applicable to immersion techniques such as electroplating. These design considerations and their impact on reaction performance will be discussed in the following, vide infra. The CSM sets were weighed before and after coating (mass after coating: mCSM) in order to determine the amount of catalyst deposited, mcat. Their combined displacement volume, VCSM, was determined in order to calculate the remaining reactor volume, VR, and porosity of the CSM, ϕ.
 | (1) |
Here, d is the diameter of the four identical catalytic tube sections – 6 mm ID, and l their length – 15 cm. The physical data of the CSMs is collated in Table 1.
Additive manufacture of CSM scaffolds
All 3D printed CSMs were manufactured on the Arcam A1 electron beam melting 3D printer using either TiAl64V powders (45–105 micrometre diameter range) or cobalt-chrome powders. The machine process parameters were set by trial and error for CoCr but were known for Ti6Al4V through previous experience with builds on that alloy. Apart from the fact that the manufacture of CSMs using the additive manufacturing route was novel, no IP is claimed in this area. Arcam Electron Beam Melting1 (EBM) uses an electron beam to melt and fuse metal powders, layer-by-layer, into three-dimensional parts. The process takes place in a powder bed where a rake feeds a layer of powder over a starting plate on a vertically movable table. Light sintering of the entire layer and melting of the cross section of the parts in the layer is achieved by electron beam. The table lowers into a tank and the process is repeated. The process is conducted in a vacuum at high bed temperatures during the entire build. A typical starting bed temperature for Ti64 is 730 °C. The starting bed temperature for CoCr is 850 °C. The electron beam used for melting is also used first to heat the start plate. Supports underneath the CSM designs are built using the electron beam. These are 0.5 mm diameter and 3 mm long support pillars that aid in the melting process to avoid swelling of the part above the plane of the powder layer. A ‘net’ theme is used for the melting of the mixers due to their fine cross-sections. At the end of the build the unfused powder is removed from the mixer by grit-blasting with the same powder material.Catalyst deposition using electroplating
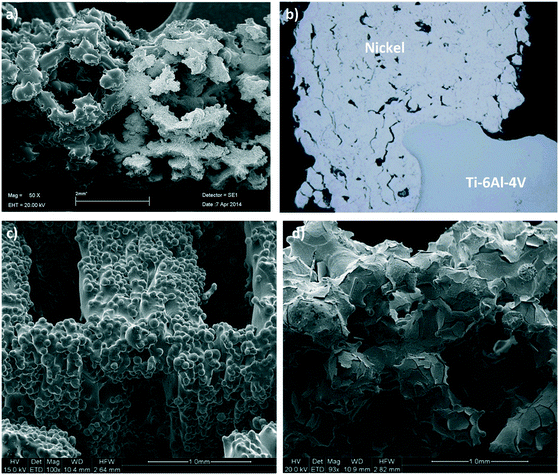
Thin adherent layers of metallic nickel and platinum were electroplated onto the static mixers using an axial flow cell and standard galvanostatic (constant current) procedures.38,39 The electrodes in this flow cell were arranged concentrically with the mixer as the central electrode to ensure an even current distribution. Prior to electrodeposition, the mixers were thoroughly cleaned and activated using published methods to ensure the deposits were uniform and adherent. The best cleaning and activation procedures vary according to which alloy the mixes are made from; for Ti alloy the procedures described in ASTM B481-68 (ref. 40) was used, while for the CoCr alloy a procedure described in the 81st Universal Metal Finishing Guidebook41 was adapted to suit our application. The deposited layers were analysed by SEM (see Fig. 3) and X-ray tomographic imaging at the Australian Synchrotron to ensure their distribution, thickness and surface morphologies were suitable for the application.Catalyst deposition using cold spraying
In the cold spray method the scaffold was held in a custom designed aluminium tube which was opened on one side. This arrangement allowed the scaffold to be cold sprayed effectively and at the same time prevented the force of the carrier gas from fracturing the scaffold. This prototype configuration is shown in Fig. S1 in the ESI.† A Plasma Giken PCS-1000 cold spray system, fitted with a water-cooled, one-piece, tungsten carbide nozzle with a 3 mm throat, was used to spray nickel powder (−20 to +10 micron spherical particles). Further details on the cold spray parameters can be found in the ESI.† The conditions described herein produced Ni coatings with high porosity and high metallurgical bonding, which was confirmed by the SEM and optical pictures of the cold sprayed 3D scaffolds shown in Fig. 3.Reactor design and operation
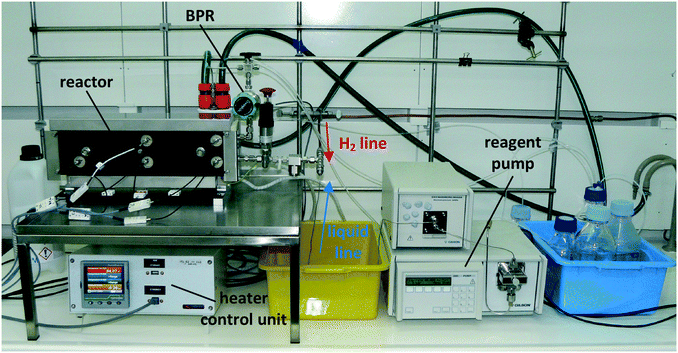
The continuous flow reactor set-up was designed by CSIRO and the reactor module was built by Cambridge Reactor Design37 to CSIRO's specifications. Fig. 4 shows a flow diagram of the reactor set-up and Fig. 5 shows a photograph.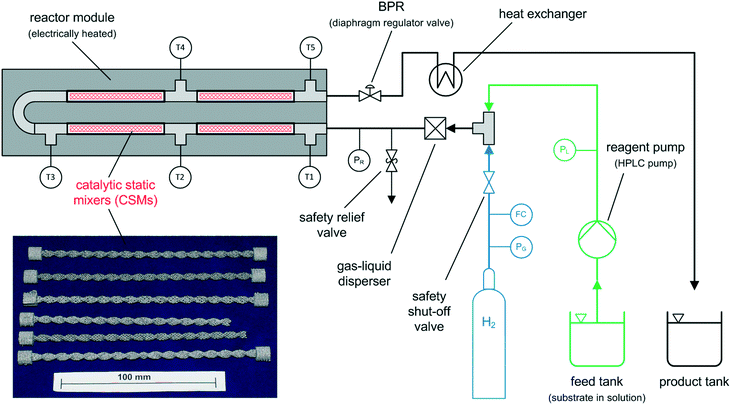 | ||
| Fig. 4 Simplified process flow diagram of the tubular flow reactor set-up for continuous flow hydrogenations; bottom left: series of CSMs after 3D printing. | ||
The set-up consists of the reactor module, housing the CSMs, a liquid feed line, including a liquid reagent pump (Gilson 305 HPLC pump), a gas feed line, and electronic process control and data logging. As depicted in Fig. 4, the reactor module contains four reactor zones, each of which are made from 15 cm long stainless steel tubing (Swagelok, 8 mm OD, 6 mm ID). It also contains five temperature probes (PT-100), situated before and after each reactor zone. The reactor module can be dismantled easily in order to facilitate change-over of the catalytic inserts. The reagent pump supplies the substrate feed stream, which contains a solution of the starting material substrate, neat or in a solvent. The hydrogen gas is supplied from a hydrogen cylinder (G-type cylinder) and mixed with the liquid stream in a T-piece. The combined stream then flows through a liquid–gas disperser (Swagelok SS-4TF-90) before it enters the reactor. The pressure inside the reactor is regulated by a diaphragm back pressure regulator (BPR, Swagelok KBP1J0A4D5A20000), which is situated at the outlet of the reactor. After passing through the BPR, the hot effluent can optionally be cooled in a coil type heat exchanger, which is operated with water as the coolant. The product stream is then collected in a bottle or flask for post processing and analysis. The following process control components are installed in the rig: safety pressure relief valve at reactor inlet (Swagelok, SS-4R3A); safety shut-down valve in the gas line (Bürkert, 2/2-way solenoid valve 6027-A03); flash-back arrestor in the gas line (Witt 85–10) and three pressure sensors (Gilson 806 Manometric Module, GE UNIK 5000 Series, Impress IMP-G1003-SA4-BEV-00-000) measuring the pressure in the liquid line, gas line and at the inlet of the reactor (pL, pG, pR). The flow of gas in the hydrogen line is controlled using a Bronkhorst MFC F-201CV-500 mass flow controller, which is measuring the normal gas flow rate, ![[V with combining dot above]](https://www.rsc.org/images/entities/i_char_0056_0307.gif) G,N (1 atm, 0 °C), from which the actual gas flow rate inside the reactor at reaction temperature and pressure,
G,N (1 atm, 0 °C), from which the actual gas flow rate inside the reactor at reaction temperature and pressure, ![[V with combining dot above]](https://www.rsc.org/images/entities/i_char_0056_0307.gif) G,R, can be calculated (see ESI†). The mean residence time of the combined liquid and gas flow inside the reactor, τ, can then be calculated using:
G,R, can be calculated (see ESI†). The mean residence time of the combined liquid and gas flow inside the reactor, τ, can then be calculated using:
 | (2) |
Here, ![[V with combining dot above]](https://www.rsc.org/images/entities/i_char_0056_0307.gif) L is the liquid flow rate through the reactor. The reaction occurs at the solid–liquid interface of the catalytic inserts, inside the four reactor zones. The operation of the reactor system is controlled via a LabView interphase, which is also measuring temperature, pressure and gas flow rate data. This configuration is tailored for hydrogenation reactions; with small changes to the apparatus, said reactor rig can also be used for metal catalysed C–C coupling reactions, reductive aminations, oxidations or other heterogeneous organic reactions, some of which are currently under investigation within our group.
L is the liquid flow rate through the reactor. The reaction occurs at the solid–liquid interface of the catalytic inserts, inside the four reactor zones. The operation of the reactor system is controlled via a LabView interphase, which is also measuring temperature, pressure and gas flow rate data. This configuration is tailored for hydrogenation reactions; with small changes to the apparatus, said reactor rig can also be used for metal catalysed C–C coupling reactions, reductive aminations, oxidations or other heterogeneous organic reactions, some of which are currently under investigation within our group.
Flow chemistry evaluation of CSMs
In order to evaluate this reactor for hydrogenation reactions, a series of experiments were conducted investigating the hydrogenation of oleic acid (OA), vinyl acetate (VAc), and cinnamaldehyde (CAL). A typical hydrogenation of VAc using the above reactor configuration was conducted as follows:First the CSMs inside the reactor were activated by flowing hydrogen over them at 16 bar, 180 °C and a gas flow rate of 200 mLN min−1. The activation was conducted for several hours (between 2.5 and 4 h). After activation the reactor was flushed with solvent, ethanol (EtOH), using the liquid reagent pump. The substrate, VAc, was dissolved in EtOH to a concentration of 2 mol L−1. Upon start-up of the reactor system, hydrogen gas was introduced, together with the washing solvent to prime the reactor, and the parameters for the reaction were adjusted to the following: reactor pressure, pR = 16 bar, liquid flow rate, ![[V with combining dot above]](https://www.rsc.org/images/entities/i_char_0056_0307.gif) L = 0.5 ml min−1, gas flow rate inside the reactor,
L = 0.5 ml min−1, gas flow rate inside the reactor, ![[V with combining dot above]](https://www.rsc.org/images/entities/i_char_0056_0307.gif) G,R = 2.5 mL min−1 (
G,R = 2.5 mL min−1 (![[V with combining dot above]](https://www.rsc.org/images/entities/i_char_0056_0307.gif) G,N = 25.9 mLN min−1, G/L = 5), reactor temperature, TR = 140 °C. Once pressure and temperature had stabilised, the liquid feed was changed from solvent to stock solution, thus starting the reaction. The combined flow rate through the reactor,
G,N = 25.9 mLN min−1, G/L = 5), reactor temperature, TR = 140 °C. Once pressure and temperature had stabilised, the liquid feed was changed from solvent to stock solution, thus starting the reaction. The combined flow rate through the reactor, ![[V with combining dot above]](https://www.rsc.org/images/entities/i_char_0056_0307.gif) , was 3 mL min−1, resulting in a hydraulic mean residence time, τ, of 5 min. The clear product was collected at the outlet of the reactor in several fractions, which were then analysed by 1H-NMR and GC. Further details on analysis methods and reagents can be found in the ESI.†
, was 3 mL min−1, resulting in a hydraulic mean residence time, τ, of 5 min. The clear product was collected at the outlet of the reactor in several fractions, which were then analysed by 1H-NMR and GC. Further details on analysis methods and reagents can be found in the ESI.†
Results and discussion
The performance of the CSM reactor system was tested for a series of different conditions, varying the process parameters reactor temperature, reactor pressure, substrate concentration, G/L, and total flow rate,![[V with combining dot above]](https://www.rsc.org/images/entities/i_char_0056_0307.gif) , (which determined τ, see eqn (2)). In addition, different substrates were subjected to hydrogenation, using different carrier solvents. Furthermore, several different CSM sets were used, with different designs, made from different scaffold metal alloys and containing different metal catalyst coatings (see Table 1). At first, initial screening experiments were conducted to find optimal conditions for TR, τ and substrate concentration. A temperature effect was observed for the catalysts investigated, showing a local maximum around 140 °C. This might be due to competing effects of hydrogen adsorption/desorption, hydrogen dissociation and the chemical reaction. For subsequent reactions, the reactor temperature was set to 140 °C, and the effect of temperature especially in combination with different catalyst materials will be studied in greater detail in future work. Residence times between 4.5 and 6.5 min gave good results and were also linked to practical flow rates through the reactor, hence this range was chosen for subsequent experiments. Substrate concentrations between 1 and 2 mol L−1, depending on substrate and chosen solvent, proved to be practical and thus these concentrations were used from then on. The parameters G/L and pR were found to have major impact on the performance of the reactor, hence these two parameters were studied in more detail.
, (which determined τ, see eqn (2)). In addition, different substrates were subjected to hydrogenation, using different carrier solvents. Furthermore, several different CSM sets were used, with different designs, made from different scaffold metal alloys and containing different metal catalyst coatings (see Table 1). At first, initial screening experiments were conducted to find optimal conditions for TR, τ and substrate concentration. A temperature effect was observed for the catalysts investigated, showing a local maximum around 140 °C. This might be due to competing effects of hydrogen adsorption/desorption, hydrogen dissociation and the chemical reaction. For subsequent reactions, the reactor temperature was set to 140 °C, and the effect of temperature especially in combination with different catalyst materials will be studied in greater detail in future work. Residence times between 4.5 and 6.5 min gave good results and were also linked to practical flow rates through the reactor, hence this range was chosen for subsequent experiments. Substrate concentrations between 1 and 2 mol L−1, depending on substrate and chosen solvent, proved to be practical and thus these concentrations were used from then on. The parameters G/L and pR were found to have major impact on the performance of the reactor, hence these two parameters were studied in more detail.
Fig. 6 presents a parameter study for the hydrogenation of OA on Ni CSMs, showing a linear increase of conversion with G/L, which is expected, as higher amounts of hydrogen should increase conversion. A similar trend was observed, when pR was varied for the hydrogenation of VAc (see Fig. 7). Here, three different catalyst sets were tested, two Ni and one Pt CSM set. The Pt CSMs resulted in very high conversions at pressures above 20 bar, where an asymptotic deviation from the otherwise linear behaviour was observed. Table 2 contains a condensed set of these experiments, conducted at varying conditions, and for the six different catalyst sets shown in Table 1. Entries 12 and 13 are control experiments using a set of non-catalytic mixers, X-X-Ti-D1; here no conversion was observed.
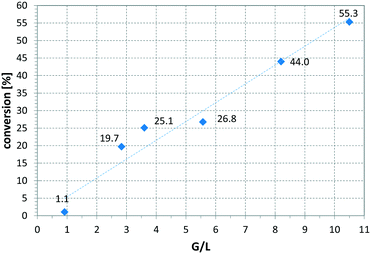 | ||
Fig. 6 Influence of gas-to-liquid ratio on conversion, using catalyst set Ni-CS-SS-D3 and oleic acid as substrate, solvent: EtOAc, pR = 16 bar, T = 140 °C, ![[V with combining dot above]](https://www.rsc.org/images/entities/i_char_0056_0307.gif) = 2.30 ml min−1, τ = 6.5 min. = 2.30 ml min−1, τ = 6.5 min. | ||
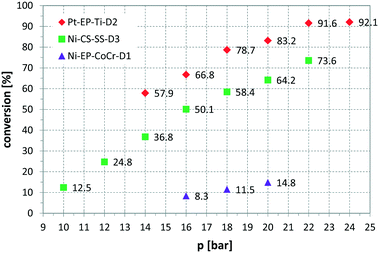 | ||
Fig. 7 Influence of reactor pressure, pR, on conversion, using three different catalyst sets and vinyl acetate as substrate, solvent: EtOH, T = 140 °C, ![[V with combining dot above]](https://www.rsc.org/images/entities/i_char_0056_0307.gif) = 2.30 ml min−1, G/L = 5.00, τ = 4.6 to 5 min. = 2.30 ml min−1, G/L = 5.00, τ = 4.6 to 5 min. | ||
| Entry | Substrate | Catalyst | p R [bar] |
![[V with combining dot above]](https://www.rsc.org/images/entities/i_char_0056_0307.gif) [ml min−1] [ml min−1] |
G/L [−] | τ [min] | Conv. [%] | TOF [h−1] | STY [g L−1 h−1] | Activation |
|---|---|---|---|---|---|---|---|---|---|---|
| a p R was varied between 16 and 20 bar resulting in conversions between 8.3 and 14.8% (see Fig. 7). b G/L was varied between 0.92 and 10.50 resulting in conversions between 1.1 and 55.3% (see Fig. 6). c p R was varied between 10 and 22 bar resulting in conversions between 12.5 and 73.6% (see Fig. 7). d p R was varied between 14 and 24 bar resulting in conversions between 57.9 and 92.1% (see Fig. 7). e Entry 9 was repeated multiple times with and without activation prior to reaction; with activation conversions were between 88.3 and 100.0%; without activation conversions were between 63.5 and 95.1% (see Fig. 8). f CAL was converted to 88.7%, giving a range of different hydrogenation products: HCOH 16.1%, COH 60.6%, HCAL 7.3%, CAL 11.3%, others 4.6% (see Scheme 1). | ||||||||||
| 1 | OA | Ni-EP-CoCr-D1 | 16 | 0.5 | 3.60 | 6.0 | 0.8 | 0.01 | 1.4 | N |
| 2a | VAc | Ni-EP-CoCr-D1 | 20 | 0.5 | 5.00 | 4.6 | 14.8 | 0.55 | 56 | N |
| 3 | OA | Ni-EP-Ti-D1 | 16 | 0.5 | 3.60 | 6.2 | 9.4 | 0.17 | 56 | Y |
| 4 | OA | Ni-CS-Ti-D1 | 16 | 0.5 | 3.60 | 6.4 | 16.1 | 0.14 | 93 | N |
| 5 | OA | Ni-CS-Ti-D1 | 16 | 0.3 | 6.67 | 6.4 | 19.8 | 0.11 | 69 | N |
| 6b | OA | Ni-CS-SS-D3 | 16 | 0.2 | 10.50 | 6.5 | 55.3 | 0.12 | 125 | N |
| 7c | VAc | Ni-CS-SS-D3 | 22 | 0.5 | 5.00 | 5.0 | 73.6 | 0.79 | 254 | N |
| 8d | VAc | Pt-EP-Ti-D2 | 24 | 0.5 | 5.00 | 4.7 | 92.1 | 35.93 | 336 | N |
| 9e | VAc | Pt-EP-Ti-D2 | 16 | 0.5 | 5.00 | 4.7 | 100.0 | 39.02 | 365 | Y |
| 10f | CAL | Pt-EP-Ti-D2 | 20 | 0.5 | 5.00 | 4.7 | 88.7 | 17.30 | 249 | N |
| 11 | OA | Pt-EP-Ti-D2 | 16 | 0.5 | 3.60 | 6.1 | 20.5 | 4.00 | 123 | N |
| 12 | OA | X-X-Ti-D1 | 16 | 0.3 | 6.67 | 6.5 | 0.0 | — | — | Y |
| 13 | VAc | X-X-Ti-D1 | 16 | 0.3 | 5.00 | 5.0 | 0.0 | — | — | Y |
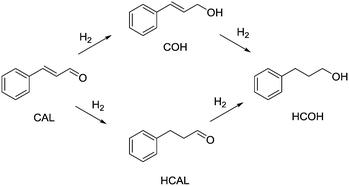 | ||
| Scheme 1 Hydrogenation pathway of cinnamaldehyde (CAL), yielding cinnamyl alcohol (COH), hydrocinnamaldehyde (HCAL) and hydrocinnamyl alcohol (HCOH). | ||
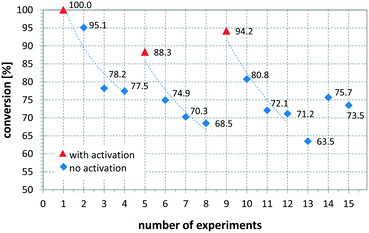
Another variable that influenced the performance of the CSMs is if a catalyst activation was carried out immediately before the reaction or not. Comparing entries 8 and 9 show that the same catalyst, operated under the same or slightly less forcing conditions, resulted in full conversion when freshly activated, while without activation the conversion was 92.1%. The influence of activation on conversion and long term performance was then studied by setting up a series of repeat reactions following an activation procedure. Here one set of conditions was chosen and the same reaction was performed multiple times, using a Pt CSM set. After a certain number of repeats, the catalyst was activated again before further experiments were conducted. Fig. 8 shows the results from this study, demonstrating what was mentioned before, namely that with a freshly activated catalyst, the conversions were higher, typically between 90 and 100%, while without, they dropped to between 65 and 80%. In general, it can be stated that the catalyst retained catalytic activity even after multiple runs, and generally produced moderate to high conversions generally ∼20% lower than a freshly activated catalyst. This concludes that each time after an activation protocol, the catalytic performance was artificially higher than when the catalyst was operated under steady state conditions, which needs to be taken into account when comparing the results in Table 2.
We then extended this set of experiments further to investigate catalytic performance under steady state conditions over longer periods of time and to quantify catalyst leaching. For this, a series of dedicated steady state operations were performed over several days, using a set of cold-sprayed Ni CSMs on a stainless steel substrate for the hydrogenation of VAc. A total of 1 L of product solution was processed during these reactions, while the reactor performance was checked frequently by NMR. No significant drop in conversion was observed over the entire period of operation with the majority of samples laying between 70 and 75%. The combined product solution was then concentrated and a sample was submitted for ICP-OES. The product stream from these steady state experiments contained on average 157 ppb Ni, 621 ppb Fe and 34 ppb Cr. These results show that the Ni catalyst is very well bound to the substrate, and that the majority of the soluble metal contamination was from the stainless steel (reactor tubing and/or CSM substrate) rather than from the catalytic layer itself, and that the total amount was very low. More extended operations and leaching tests need to be conducted on different combinations of catalyst, substrate and deposition method in order to get a robust understanding of potential catalyst contamination using CSMs. Leaching experiments on new CSM sets are currently underway and will be presented in future work.
Entry 10 shows the hydrogenation of cinnamaldehyde, a substrate containing two reactive moieties, namely a carbonyl group and a carbon–carbon double bond. Here Pt CSMs were used, investigating the selectivity of this catalyst system for the two reactive groups. The experiment resulted in a total conversion of CAL of 88.7%, whereby the majority, 60.6% was hydrogenated to the corresponding unsaturated alcohol, cinnamyl alcohol (COH). The hydrogenated aldehyde, hydrocinnamaldehyde (HCAL) was found in 7.3% and the fully hydrogenated product hydrocinnamyl alcohol (HCOH) was found in 16.1% (unreacted CAL: 11.3%, other unidentified products: 4.6%). This result shows that the Pt catalyst was more active towards reduction of the aldehyde than the double bond. Finally, Fig. 9 shows a comparison of the six different CSM sets used within this study for the two different substrates OA and VAc. While the conversions for OA under these comparative conditions was relatively low for all catalysts, the one that performed best was Ni-CS-SS-D3, which also was the CSM set containing the highest amount of nickel. This was followed by the platinum containing set Pt-EP-Ti-D2 and Ni-CS-Ti-D1, which contained the second highest amount of nickel. The main reason for the high conversions using Ni-CS-SS-D3, is believed to be the larger amount of catalyst supported on this set of CSMs. The reason for the high amount of Ni on this set of CSMs is twofold; firstly the applied catalyst deposition method, cold spraying, can produce relatively thick catalyst layers, and secondly the ribbon-like design, D3, allows for optimal coverage of the mixer. Compared to designs D1 and D2, which are porous 3D-printed structures, D3 is a flat, non-porous design, and therefore very well suited for line-of-sight deposition techniques such as cold spraying. In contrast, full coverage of the entire surface of porous designs, including the internal pores, is not feasible by cold spraying. Electroplating on the other hand, being a submersion-based deposition method, is believed to be able to cover even internal pores of these structures. However, the layers that were created by electroplating, where not as thick for the herein chosen conditions and also not as porous as the ones applied by cold-spraying, hence the activity of the electroplated sets Ni-EP-CoCr-D1 and Ni-EP-Ti-D1 were not as high as their cold spray counterparts. For the reactions with VAc, the Pt CSM set Pt-EP-Ti-D2 outperformed all others, including Ni-CS-SS-D3. Here we believe that the more active catalyst metal Pt increases the reactivity of the system significantly when compared to the Ni-based CSMs, even though the later contained a larger amount of catalyst.
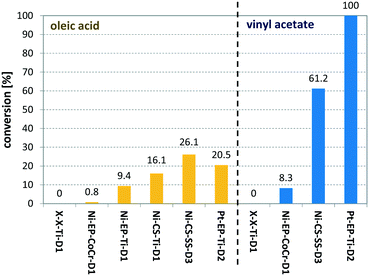 | ||
| Fig. 9 Comparison of six different catalyst sets (see Table 1) for the hydrogenation of oleic acid (yellow bars) and vinyl acetate (blue bars); for OA the following conditions were used: TR = 140 °C, pR = 16 bar, G/L = 3.6, τ = 6 min; for VAc the following conditions were used: TR = 140 °C, pR = 16 bar, G/L = 5, τ = 5 min. | ||
The Ti alloy mixers presented an initially unexpected complication as they were susceptible to hydrogen embrittlement, which is an effect documented in literature.42 After extended use with gaseous hydrogen, the mixers became porous, lost mechanical stability and started to disintegrate. This became apparent when mixers that have been used for a large number of experiments were removed from the reactor to replace them with fresh ones. In one incident, the mixers fell apart and could only be removed from the reactor pipe in form of coarse metal granules. In comparison, no embrittlement was observed with the CoCr alloy CSMs. Currently, we are investigating the possibility of replacing Ti for 316 stainless steel as material of construction for the mixer scaffold. For the use in hydrogenation reactions, this material has a much better stability towards hydrogen, and is therefore preferred. Initial results using 3D printed stainless steel mixers are very promising and will be presented in future work.
Conclusions
Herein we describe a novel continuous flow catalytic reactor system, using 3D printed static mixer technology. The CSMs were designed and printed in house, and the catalyst was deposited using either cold spraying or electroplating. The cost of manufacture of our 3D printed mixers are estimated to be lower by a factor of 10 to 100 compared to commercial metal static mixers of similar dimensions. This new approach has a series of interesting improvements over current state of the art chemical reactor systems for heterogeneous catalysis. Firstly, the tubular reactor geometry is simple, well understood and easy to implement in nearly all areas of chemical manufacture. Tubular reactors fitted with static mixers have well defined and characterised flow fields; and 3D printing allows for rapid design and manufacture of tailored solutions for any given chemical application. Depending on the nature of the chemical reaction, tailor-made 3D printed designs can be employed in order to optimise mixing of reagents at reactor entry, maximise heat and mass transfer during reaction, minimise dead zones and potential production of unwanted side-products or minimise pressure drop. The mixer geometry can be tailored to suit a wide variety of different reaction media with greatly varying material properties. For instance the CSM design for a viscous substrate stream would look inherently different from mixers for water-like media, as higher shear is needed to mix said viscous substrate, which in turn will also create a higher pressure drop and therefore needs a special mixer geometry. Secondly, the ease of manufacture of CSMs is a major benefit over existing catalyst systems. In this work simple and rapid coating technology such as metal cold spraying was used to achieve a catalytic layer onto the 3D printed mixers without the need for further treatment. Electroplating, another widely used industrial metal deposition technology, provides the opportunity to also coat the mixers with more precious catalyst materials such as Pt. Both these technologies avoid time-intensive wet chemical treatments such as hydrothermal deposition of metal oxide layers followed by solution phase impregnation of catalyst. In future work, the deposition of other catalytic metal layers is planned, including amongst others Au, Pd, Cu, and a series of bimetallic layers. Thirdly, due to the simple tubular concept, changeover of catalyst is straight forward and generates a versatile and easy to maintain continuous flow reactor system. The tubular concept also facilitates scale-up from discovery in the lab to production of kg or tonne quantities in fewer and less time and labour intensive steps than classical batch scale-up. A tubular hydrogenation reactor based on CSM technology is believed to provide substantial process intensification for numerous hydrogenation processes for manufacture of pharmaceuticals, fine chemicals, food products, polymers, agrochemicals and others.Acknowledgements
The authors thank Bashir Harji from Cambridge Reactor Design for supply of the reactor unit and technical support.Notes and references
- A. J. Blacker, J. R. Breen, R. A. Bourne and C. A. Hone, in The Growing Impact of Continuous Flow Methods on the Twelve Principles of Green Chemistry, 2016, ch. 12, pp. 140–155 Search PubMed.
- S. G. Newman and K. F. Jensen, Green Chem., 2013, 15, 1456–1472 RSC.
- C. Wiles and P. Watts, Green Chem., 2012, 14, 38–54 RSC.
- B. P. Mason, K. E. Price, J. L. Steinbacher, A. R. Bogdan and D. T. McQuade, Chem. Rev., 2007, 107, 2300–2318 CrossRef CAS PubMed.
- A. P. Harvey, M. R. Mackley and T. Seliger, J. Chem. Technol. Biotechnol., 2003, 78, 338–341 CrossRef CAS.
- T. Glasnov, Continuous-Flow Chemistry in the Research Laboratory, Springer New York, Dordrecht, Heidelberg, London, 2016 Search PubMed.
- S. V. Ley, D. E. Fitzpatrick, R. J. Ingham and R. M. Myers, Angew. Chem., 2015, 127, 3514–3530 CrossRef.
- B. Gutmann, D. Cantillo and C. O. Kappe, Angew. Chem., Int. Ed., 2015, 54, 6688–6728 CrossRef CAS PubMed.
- R. M. Myers, D. E. Fitzpatrick, R. M. Turner and S. V. Ley, Chem. – Eur. J., 2014, 20, 12348–12366 CrossRef CAS PubMed.
- V. Hessel, D. Kralisch, N. Kockmann, T. Noël and Q. Wang, ChemSusChem, 2013, 6, 746–789 CrossRef CAS PubMed.
- M. Baumann, I. R. Baxendale and S. V. Ley, Mol. Diversity, 2010, 15, 613–630 CrossRef PubMed.
- V. Hessel, S. Hardt and H. Löwe, Chemical Micro Process Engineering: Fundamentals, Modelling and Reactions, Wiley-VCH Verlag GmbH & Co. KGaA, 2004 Search PubMed.
- G. Eigenberger and W. Ruppel, in Ullmann's Encyclopedia of Industrial Chemistry, Wiley-VCH Verlag GmbH & Co. KGaA, 2000 Search PubMed.
- M. Herskowitz and J. M. Smith, AIChE J., 1983, 29, 1–18 CrossRef CAS.
- S. V. Ley, I. R. Baxendale, R. N. Bream, P. S. Jackson, A. G. Leach, D. A. Longbottom, M. Nesi, J. S. Scott, R. I. Storer and S. J. Taylor, Perkin 1, 2000, 3815–4195 RSC.
- D. E. Swaine and A. J. Daugulis, Biotechnol. Prog., 1988, 4, 134–148 CrossRef CAS.
- M. W. Losey, M. A. Schmidt and K. F. Jensen, Ind. Eng. Chem. Res., 2001, 40, 2555–2562 CrossRef CAS.
- S. Furuta, H. Matsuhashi and K. Arata, Catal. Commun., 2004, 5, 721–723 CrossRef CAS.
- C. Battilocchio, J. M. Hawkins and S. V. Ley, Org. Lett., 2014, 16, 1060–1063 CrossRef CAS PubMed.
- K. J. Barlow, X. Hao, T. C. Hughes, O. E. Hutt, A. Polyzos, K. A. Turner and G. Moad, Polym. Chem., 2013, 5, 722–732 RSC.
- R. J. Ingham, E. Riva, N. Nikbin, I. R. Baxendale and S. V. Ley, Org. Lett., 2012, 14, 3920–3923 CrossRef CAS PubMed.
- A. Sachse, A. Galarneau, B. Coq and F. Fajula, New J. Chem., 2011, 35, 259–264 RSC.
- P. D. I. Fletcher, S. J. Haswell, P. He, S. M. Kelly and A. Mansfield, J. Porous Mater., 2011, 18, 501–508 CrossRef CAS.
- P. He, S. J. Haswell, P. D. I. Fletcher, S. M. Kelly and A. Mansfield, Beilstein J. Org. Chem., 2011, 7, 1150–1157 CrossRef CAS PubMed.
- N. Nikbin, M. Ladlow and S. V. Ley, Org. Process Res. Dev., 2007, 11, 458–462 CrossRef CAS.
- P. L. Mills, D. J. Quiram and J. F. Ryley, Chem. Eng. Sci., 2007, 62, 6992–7010 CrossRef CAS.
- L. Kiwi-Minsker and A. Renken, Catal. Today, 2005, 110, 2–14 CrossRef CAS.
- G. M. Whitesides, Nature, 2006, 442, 368–373 CrossRef CAS PubMed.
- L. Y. Yeo, H.-C. Chang, P. P. Y. Chan and J. R. Friend, Small, 2011, 7, 12–48 CrossRef CAS PubMed.
- V. Sebastián, O. de la Iglesia, R. Mallada, L. Casado, G. Kolb, V. Hessel and J. Santamaría, Microporous Mesoporous Mater., 2008, 115, 147–155 CrossRef.
- E. V. Rebrov, G. B. F. Seijger, H. P. A. Calis, M. H. J. M. de Croon, C. M. van den Bleek and J. C. Schouten, Appl. Catal., A, 2001, 206, 125–143 CrossRef CAS.
- Y. Elias, P. Rudolf von Rohr, W. Bonrath, J. Medlock and A. Buss, Chem. Eng. Process., 2015, 95, 175–185 CrossRef CAS.
- G. Vilé, D. Albani, N. Almora-Barrios, N. López and J. Pérez-Ramírez, ChemCatChem, 2015, 8(1), 21–33 CrossRef.
- A. Rahman and S. S-Al-Deyab, Appl. Catal., A., 2014, 469, 517–523 CrossRef CAS.
- R. C. Hastert, J. Am. Oil Chem. Soc., 1979, 56, 732A–739A CrossRef CAS.
- L. L. Diosady, W. F. Graydon, S. S. Köseoḡlu and L. J. Rubin, Can. Inst. Food Sci. Technol. J., 1984, 17, 218–223 CrossRef CAS.
- Cambridge Reactor Design. [Online] Available: http://www.cambridgereactordesign.com/.
- Y. D. Gamburg and G. Zangari, Theory and Practice of Metal Electrodeposition, Springer New York, Dordrecht, Heidelberg, London, 2011 Search PubMed.
- C. R. K. Rao and D. C. Trivedi, Coord. Chem. Rev., 2005, 249, 613–631 CrossRef CAS.
- ASTM B481 - 68(2013) Standard Practice for Preparation of Titanium and Titanium Alloys for Electroplating.
- R. E. Tucker, 81st Universal Metal Finishing Guidebook, Elsevier Inc. Elsevier Inc., 360 Park Avenue South, New York, NY, USA, 2013 Search PubMed.
- E. Tal-Gutelmacher and D. Eliezer, JOM, 2005, 57, 46–49 CrossRef CAS.
Footnotes |
| † Electronic supplementary information (ESI) available. See DOI: 10.1039/c6re00188b |
| ‡ We are currently investigating the mixing performance of these CSM designs using experimental and computational methods. The results will be published in future work. |
| This journal is © The Royal Society of Chemistry 2017 |

