Particle activation/deactivation effect in RAFT emulsion polymerization of styrene†
Kun
Yan
ab and
Yingwu
Luo
*a
aThe State Key Laboratory of Chemical Engineering, College of Chemical and Biological Engineering, Zhejiang University, 38 Zhe Da Road, Hangzhou 310027, PR China. E-mail: yingwu.luo@zju.edu.cn
bKingfa Sci. & Tech. Co., Ltd., Guangzhou 510663, PR China. E-mail: yankunlmm@hotmail.com
First published on 6th December 2016
Abstract
The seeded RAFT emulsion polymerization of styrene at low initiator concentrations was modelled using population balance equations and Monte Carlo simulations. Without any adjusting parameter, the models accurately predicted the polymerization kinetics, particle size, particle size distribution (PSD), and the characteristic changing trend of molecular weight distribution (MWD) at various initiator concentrations. An initiator concentration-dependent particle activation/deactivation process (PADeP), which played a decisive role in PSD and MWD at very low initiator concentrations, was highlighted to account for the unexpected simultaneous increase in the dispersities of PSD (PDIPS) and MWD (PDIMW) with the decrease of the initiator concentration. It was concluded that at low initiator concentrations, both PDIPS and PDIMW should be mappings of the dispersity of the number of PADeP experienced by particles during the whole polymerization course. The random nature of PADeP caused the dramatic increases in both PDIPS and PDIMW with the decrease of the initiator concentration. However, in the cases of higher initiator concentrations where the average number of PADeP was above 15, the effect of PADeP became much weaker. In such cases, PDIMW should be mainly controlled by the RAFT reaction.
Introduction
Emulsion polymerization is widely used in industry for manufacturing rubbers and water-borne coatings, paints, and adhesives.1,2 With the increasing environmental concerns, emulsion polymerization has received much attention recently due to its environmentally benign polymerization conditions.1–3 Particle size distribution (PSD) and molecular weight distribution (MWD) of the product latex could significantly influence the mechanical strength, rheology and optical properties of the product.1,4 In emulsion polymerization, 1016–1018 particles Llatex−1 are in situ formed.1 PSD is mainly controlled by nucleation and particle growth processes. Extensive investigations have been carried out to control PSD in order to synthesize mono-dispersed particles or high solid content latex.3 The dispersity of PSD (PDIPS, defined as dv/dn) could be affected by many factors, such as nucleation, particle growth, monomer feeding policy and temperature.1,2More recently, reversible addition fragmentation chain transfer (RAFT) emulsion polymerization has aroused significant academic and industrial interest, since it enables the synthesis of high molecular weight polymers with pre-set molecular weight and narrow MWD, as well as nanostructured particles of block copolymers at high polymerization rates.5,6 In RAFT emulsion polymerization, the dispersity of MWD (PDIMW, defined as Mw/Mn) is not only determined by the rate of the RAFT reactions and the degree of the irreversible termination, but also affected by heterogeneous natures like the uneven distribution of the RAFT agent molecules among the particles and the particle size-dependent polymerization kinetics.7,8
In general, there is no apparent correlation between PDIPS and PDIMW since their controlling mechanisms are fundamentally irrelevant in emulsion polymerization.1 However, PDIPS and PDIMW were experimentally observed to be strongly correlated with each other in RAFT emulsion polymerization of styrene.9 In our recent study of seeded RAFT emulsion polymerization, both of them increased in a similar accelerating fashion as the initiator concentrations were reduced to much lower values than those of the conventional emulsion polymerization.9 An initiator concentration-dependent activation/deactivation process (PADeP) between active and dormant particles was ascribed to these observations. In this article, the effect of PADeP in seeded RAFT emulsion polymerization of styrene is investigated and verified via modelling. Some of the important characteristics are highlighted to give a comprehensive understanding of this process.
Model development
Emulsion polymerization is a heterogeneous polymerization system. 1016–1018 particles Llatex−1 are generated in situ in the early stage of the polymerization and then the polymerization mainly occurs in the particles. For simplicity, the current work focuses on the seeded RAFT emulsion polymerization. Particle population balance equations are used to model polymerization kinetics and PSD, and Monte Carlo simulation is used to predict MWD.RAFT polymerization mechanism
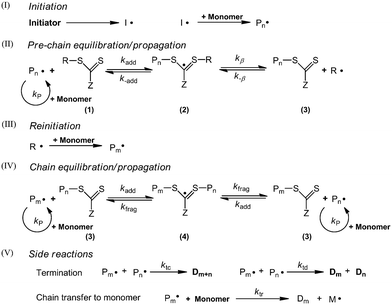
The mechanism of RAFT polymerization shown in Scheme 1 has been well accepted.10 Initiation (I in Scheme 1) and side reactions (V in Scheme 1) in RAFT polymerization are the same as those in the conventional radical polymerization. The RAFT reaction (II and IV in Scheme 1) is a reversible transfer process, where the polymer chains are activated and deactivated alternately. The transfer rate of the RAFT reaction is much higher than the propagation rate, thus a linear increase of molecular weight with monomer conversion and narrow MWD can be achieved. It needs to be noted that in the current work, the chain transfer to monomer reaction should be taken into consideration, since the desorption of the generated monomer radical had a significant impact on the polymerization kinetics and controlling features due to the low initiator concentrations.9Population balance equations (PBEs)
Polymerization kinetics and PSD in the current work are modelled by PBEs. The assumptions are as follows:• Zero-one kinetics is applied to the seeded RAFT emulsion polymerization of styrene, where the entry of a radical into a latex particle already containing a growing radical leads to instantaneous termination.1,11 The coagulation term is neglected in the current model for the computational efficiency.
• RAFT agent molecules are evenly distributed among particles.
• An intermediate radical is only formed by addition reaction of the RAFT agent with a polymer radical. The addition reaction of the RAFT agent molecules with a monomer radical can be neglected.1
According to these assumptions, four types of particles are identified. The corresponding PBEs are as follows:
Particle with no free radical:1
 | (1) |
Particle with a polymer radical:1
 | (2) |
Particle with a monomer radical:1
 | (3) |
Particle with an intermediate radical:
 | (4) |
The evolution of latex particles in RAFT emulsion polymerization is predicted by these partial differential equations as a function of particle radius and polymerization time. The calculation of the parameters used in the PBEs is summarized in Table 1.
According to the material balance for the monomer, the molar mass of the unreacted monomer can be calculated by:11
 | (5) |
When droplets exist (in intervals I and II) in the polymerization systems, the monomer concentration in the latex particle reaches its saturation value (CP = CsatP).11 When droplets do not exist (in interval III), CP is calculated based on the material balance for the monomer:11
 | (6) |
The average radical number per particle is calculated by:
 | (7) |
The finite volume method is applied to transform the PBEs (eqn (1)–(4)) into 4 × N ordinary differential equations (ODEs), in which N is the number of the discretized radius domain with a length of Δr. The obtained ODEs were solved along with the equations for the kinetics in the aqueous phase (see in the ESI†) and the monomer mass balance equations (eqn (5) and (6)) simultaneously. The model was programmed and calculated using MATLAB software (version R2015a). The parameters used in the model are listed in Table 2.
| Parameter | Value | Reference |
|---|---|---|
| k P | 1.259 × 10⁷ exp(−2900/RT) | 1 |
| k 1 P | 4kP | 1 |
| k tr |
k
P × 10−0.658 exp(−23![[thin space (1/6-em)]](https://www.rsc.org/images/entities/char_2009.gif) 400/RT) 400/RT) |
1 |
| d m | 923.6–0.887T | 11 |
| d p | 1050.1–0.621T | 11 |
| C satP | 5.8 | 1 |
| C satW | 0.0056 | 1 |
| D W | 1.5 × 10⁻⁷ | 1 |
| M 0 | 0.104 | |
| k pw | C satP/CsatW | 1 |
| k add | 1.0 × 10⁶ | 15 |
| k frag | 3.0 × 10⁵ | 15 |
| N P | 8.9 × 10¹⁷ | 9 |
![[n with combining macron]](https://www.rsc.org/images/entities/i_char_006e_0304.gif) 0
0
|
0.08 | 9 |
| PDI0PS | 1.07 | 9 |
| PDI0MW | 2.47 | 9 |
| x 0 | 0.35 | 9 |
Monte Carlo simulation
MWD in the current work is simulated by a Monte Carlo (MC) method proposed for RAFT mini-emulsion polymerization by Tobita.12 This MC simulation method is based on the competition technique, where the imaginary times of various events occurring in a latex particle are calculated and the event with the shortest imaginary time is chosen as a real event.13,14 Radical desorption should be considered in the current model since it had a significant influence on the polymerization kinetics and controlling features due to the low initiator concentrations.9The events considered here are as follows:
Event 1. Radical entry into a latex particle.
The average time interval between radical entry is given by:
 | (8) |
The imaginary time for radical entry follows the most probable distribution, and can be determined by:15
 | (9) |
Event 2. Radical desorption from the latex particle.
The average time for radical desorption to occur is given by:
 | (10) |
Since the monomer radical is formed though the radical transfer to monomer reaction and only this type of radical can desorb from the latex particle, the rate coefficient of radical desorption is calculated by:1
 | (11) |
The imaginary time for radical desorption is determined by:15
 | (12) |
Event 3. Monomer radical propagation.
The average time for this event to occur is given by:
 | (13) |
Compared with event 2, event 3 describes the other fate of the monomer radical formed by the radical transfer to monomer reaction. Thus, the rate coefficient of monomer radical propagation instead of desorption is calculated by:
 | (14) |
The imaginary time for radical propagation instead of desorption is determined by:15
 | (15) |
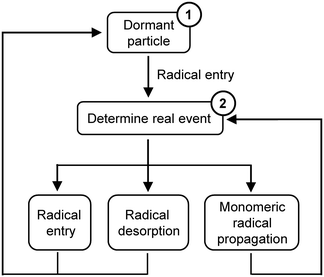
The outline of the MC simulation is shown in Scheme 2. The simulation starts with a dormant particle (1 in Scheme 2). Radical entry is the only event that would happen at the beginning. The time interval for radical entry is determined. After the particle is activated, the imaginary times of three events are calculated. The event with the shortest imaginary time is chosen as the real event. And the reaction time increases by Δt (for example, Δt = tentry as radical entry is the real event). Then the number of reacted monomer units ΔNM is calculated and added to randomly selected chains (see in the ESI†). If radical entry or radical desorption is chosen as the real event, the active latex particle turns into a dormant one. And the next simulation starts from the beginning (1 in Scheme 2). On the other hand, if monomer radical propagation is chosen as the real event, the latex particle stays active and the next simulation starts from the step of determining the real event (2 in Scheme 2). Either event would generate a dead chain. The process is repeated until the final reaction time is reached. The same parameters are used as shown in Table 2. The detailed calculation process can be found in the ESI.†
Experimental
A series of seeded RAFT emulsion polymerizations of styrene were conducted as described in ref. 9. The possible influence of the complicated nucleation process on PDIPS and PDIMW was ruled out in the seeded emulsion polymerization. Firstly, ab initio RAFT emulsion polymerization of styrene was carried out at 70 °C with a solid content of 20% to synthesize the seed latex. The molecular weight was targeted at 37 kg mol−1. The ratio of initiator concentration ([I]) to RAFT agent concentration ([R]) was set at 1/640. The polymerization was stopped at 35% monomer conversion where the nucleation was finished. Then the product was used as the seed latex. In the seeded RAFT emulsion polymerizations, only extra initiators were added to investigate the effect of the initiator concentrations. The total [I]/[R] ratios were adjusted from 1/5 to 1/640. All the seeded experiments were conducted at 70 °C. The experimental details can be found in ref. 9.Results and discussion
Polymerization kinetics
The experimental data can be found in the previous study.9 The model simulations were conducted using the parameters listed in Table 2. The comparisons of polymerization kinetics between model predictions and experimental results are shown in Fig. 1. The evolutions of monomer conversion with polymerization time are shown in case 1 (a) of Fig. 1. It is seen that the polymerization rates of the model predictions are slower than the experimental ones. Especially for the cases of [I]/[R] = 1/320 and [I]/[R] = 1/640, apparently negative deviations are observed between the model prediction curves and the experimental result dots. Case 1 (b) of Fig. 1 shows the evolutions of the average radical number per particle (![[n with combining macron]](https://www.rsc.org/images/entities/i_char_006e_0304.gif) ) with monomer conversion. Experimental
) with monomer conversion. Experimental ![[n with combining macron]](https://www.rsc.org/images/entities/i_char_006e_0304.gif) is the steady-state value where the curve of monomer conversion with polymerization time is almost a straight line.9 Both the experimental and simulated
is the steady-state value where the curve of monomer conversion with polymerization time is almost a straight line.9 Both the experimental and simulated ![[n with combining macron]](https://www.rsc.org/images/entities/i_char_006e_0304.gif) values are lower than 0.5 and decrease with the initiator concentration. It is suggested that the radical exit effect on
values are lower than 0.5 and decrease with the initiator concentration. It is suggested that the radical exit effect on ![[n with combining macron]](https://www.rsc.org/images/entities/i_char_006e_0304.gif) is significant in the current system. The model-predicted
is significant in the current system. The model-predicted ![[n with combining macron]](https://www.rsc.org/images/entities/i_char_006e_0304.gif) values are lower than the corresponding experimental values. This is why the predicted polymerization rates are slower than the corresponding experimental data, since the same particle concentration was used in all five runs.
values are lower than the corresponding experimental values. This is why the predicted polymerization rates are slower than the corresponding experimental data, since the same particle concentration was used in all five runs.
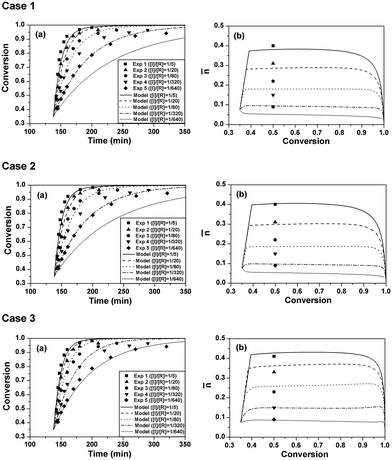 | ||
Fig. 1 Effect of initiator concentration on monomer conversion and average radical number per particle (![[n with combining macron]](https://www.rsc.org/images/entities/i_char_006e_0304.gif) ). Dots are experimental results and lines are model simulation results. Case 1 used the model described in the main text and parameters listed in Table 2. Case 2 used the same model and parameters as those in case 1, but the RAFT reaction term was removed. Case 3 used the same model and parameters as those in case 1, but ktr was set as 0.097 L mol−1 s−1. (a) Evolutions of monomer conversion with polymerization time. (b) Evolutions of ). Dots are experimental results and lines are model simulation results. Case 1 used the model described in the main text and parameters listed in Table 2. Case 2 used the same model and parameters as those in case 1, but the RAFT reaction term was removed. Case 3 used the same model and parameters as those in case 1, but ktr was set as 0.097 L mol−1 s−1. (a) Evolutions of monomer conversion with polymerization time. (b) Evolutions of ![[n with combining macron]](https://www.rsc.org/images/entities/i_char_006e_0304.gif) with monomer conversion. with monomer conversion. | ||
It was reported that in RAFT (mini)emulsion polymerization, the RAFT reaction could reduce ![[n with combining macron]](https://www.rsc.org/images/entities/i_char_006e_0304.gif) due to the existence of the RAFT intermediate radicals.16 However, the RAFT agent used in the current case (trithiocarbonate) has a much weaker retardation effect than those in the literature which used 1-phenylethylphenyl dithioacetate (PS-PEPDTA) and 2-cyanoprop-2-yl dithiobenzoate (PS-CPDB) as the RAFT agents.16,17 The effect of the RAFT reaction on
due to the existence of the RAFT intermediate radicals.16 However, the RAFT agent used in the current case (trithiocarbonate) has a much weaker retardation effect than those in the literature which used 1-phenylethylphenyl dithioacetate (PS-PEPDTA) and 2-cyanoprop-2-yl dithiobenzoate (PS-CPDB) as the RAFT agents.16,17 The effect of the RAFT reaction on ![[n with combining macron]](https://www.rsc.org/images/entities/i_char_006e_0304.gif) should be weakened. In case 2, the model simulations were conducted using the same parameters but without the RAFT reaction (nPXP1 was removed from the present model). As seen in case 2 of Fig. 1, the polymerization rates and
should be weakened. In case 2, the model simulations were conducted using the same parameters but without the RAFT reaction (nPXP1 was removed from the present model). As seen in case 2 of Fig. 1, the polymerization rates and ![[n with combining macron]](https://www.rsc.org/images/entities/i_char_006e_0304.gif) s only slightly increase compared with those in case 1, but still show apparent deviations from the experimental results, suggesting that the deviation should not be caused by the RAFT reaction.
s only slightly increase compared with those in case 1, but still show apparent deviations from the experimental results, suggesting that the deviation should not be caused by the RAFT reaction.
In cases 1 and 2, the well-accepted value of ktr in the conventional radical polymerization of styrene (0.0292 L mol−1 s−1) was used. However, in our previous study,18 the ktr in RAFT emulsion polymerization of styrene was estimated to be only 1/3 of the well-accepted value for the conventional radical polymerization. Considering that the desorption of the monomer radical should be a source of radical loss for the latex particles at low initiator concentrations,19 it is very likely that low ![[n with combining macron]](https://www.rsc.org/images/entities/i_char_006e_0304.gif) values might have resulted from the higher ktr value. So in case 3, ktr was reset at 0.097 L mol−1 s−1, which was recently estimated from RAFT emulsion polymerization of styrene.18 The simulation results are shown in case 3 of Fig. 1. Interestingly, the simulated evolutions of monomer conversion with polymerization time are in good agreement with the experimental results. The predicted
values might have resulted from the higher ktr value. So in case 3, ktr was reset at 0.097 L mol−1 s−1, which was recently estimated from RAFT emulsion polymerization of styrene.18 The simulation results are shown in case 3 of Fig. 1. Interestingly, the simulated evolutions of monomer conversion with polymerization time are in good agreement with the experimental results. The predicted ![[n with combining macron]](https://www.rsc.org/images/entities/i_char_006e_0304.gif) values are higher compared with those in cases 1 and 2, and agree well with the experimental data. It must be pointed out that no adjusting parameters were used in the model simulations. So it is evident that ktr in RAFT emulsion polymerization of styrene should be much lower than that in the conventional radical polymerization. The fact that RAFT reactions could suppress the radical chain transfer to monomer reaction is unexpected. However, it has been proposed that the RAFT reaction might suppress the radical transfer to poly(butyl acrylate) reaction.20–25 The value of 0.097 L mol−1 s−1 for ktr is used for the rest of the model simulations.
values are higher compared with those in cases 1 and 2, and agree well with the experimental data. It must be pointed out that no adjusting parameters were used in the model simulations. So it is evident that ktr in RAFT emulsion polymerization of styrene should be much lower than that in the conventional radical polymerization. The fact that RAFT reactions could suppress the radical chain transfer to monomer reaction is unexpected. However, it has been proposed that the RAFT reaction might suppress the radical transfer to poly(butyl acrylate) reaction.20–25 The value of 0.097 L mol−1 s−1 for ktr is used for the rest of the model simulations.
Particle size distribution
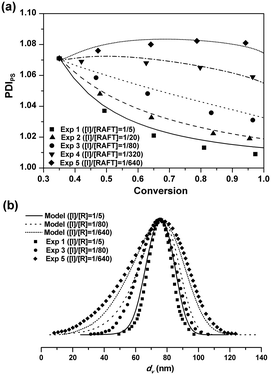
The five seeded RAFT emulsion polymerizations started with the same batch of the seed latex. The PDIPS of the seed latex is about 1.07. During the seeded emulsion polymerization, small particles could catch up with the larger ones due to the compartmentalization effect, leading to the narrowing of PSD.1 As![[n with combining macron]](https://www.rsc.org/images/entities/i_char_006e_0304.gif) increases, the decreasing rate of PDIPS in Exps 1–4 becomes faster as seen in Fig. 2(a). In Exp 5, in which no additional initiator is added, PDIPS increases slightly with the monomer conversion and finally reaches 1.08. It is possible that
increases, the decreasing rate of PDIPS in Exps 1–4 becomes faster as seen in Fig. 2(a). In Exp 5, in which no additional initiator is added, PDIPS increases slightly with the monomer conversion and finally reaches 1.08. It is possible that ![[n with combining macron]](https://www.rsc.org/images/entities/i_char_006e_0304.gif) might be so low that some small dormant particles could not be re-activated during the rest of the polymerization. The model simulations are in good agreement with the experimental data for all cases as shown in Fig. 2(a). Fig. 2(b) shows the results of the final PSD in Exps 1, 3 and 5. The average particle sizes are almost the same and the PSDs remain unimodal for all cases. But the distribution clearly broadens with the decrease of the initiator concentration. The model simulation curves match well with the experimental data.
might be so low that some small dormant particles could not be re-activated during the rest of the polymerization. The model simulations are in good agreement with the experimental data for all cases as shown in Fig. 2(a). Fig. 2(b) shows the results of the final PSD in Exps 1, 3 and 5. The average particle sizes are almost the same and the PSDs remain unimodal for all cases. But the distribution clearly broadens with the decrease of the initiator concentration. The model simulation curves match well with the experimental data.
Molecular weight distribution
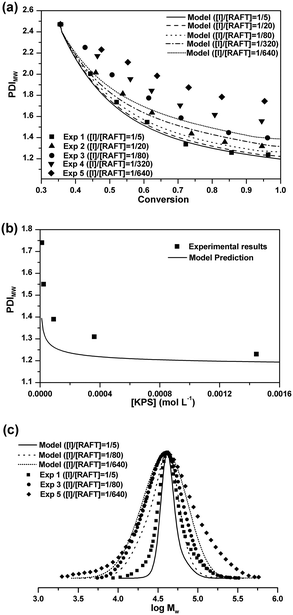
The experimental value of PDIMW at the beginning of the seeded RAFT emulsion polymerization is about 2.47 from GPC analysis. As shown in Fig. 3(a), after initiating the seeded polymerizations, the PDIMWs start to decrease rapidly for all cases. The decreasing rate of PDIMW increases with the initiator concentration. For the case of [I]/[RAFT] = 1/5, the model simulation result matches well with the experimental data. But as the initiator concentration is further reduced, the model predictions start to deviate from the experimental data. Fig. 3(b) shows the effect of the initiator concentration on the final PDIMW. The experimental PDIMW increases dramatically with decreasing the initiator concentration. The model simulation curve shows the same increasing pattern, even though it fails to exactly agree with the experimental data.The poor agreement between experimental data and model predictions at low initiator concentrations should be ascribed to the inaccuracy of the model input. It is noted that the MC simulations require the latex particles to be calculated one-by-one. However, it is impossible to acquire the accurate MWD for each particle from experimental methods. The MWD input in the simulation was obtained from the GPC result, which represented the polymer chains of all the latex particles in the polymerization systems. In the simulations, we had to assume that all particles should share an identical MWD. As a matter of fact, MWDs should be different among the particles. Particles nucleated at earlier time should be composed of longer chains, whereas the particles nucleated at later time should consist of shorter chains.
Comparisons of the final MWDs between the model predictions and the experimental results are shown in Fig. 3(c). It is seen that the differences between the model prediction curves and the experimental results mainly occur at low molecular weight ends and high molecular weight ends for all cases. These extremely short and long chains should originate from the differences of MWDs among the particles at the beginning of the seeded RAFT emulsion polymerizations.
Particle activation/deactivation process (PADeP)
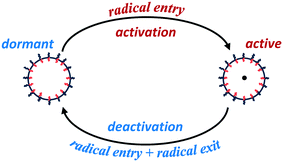
Analogous to RAFT reactions, latex particles in emulsion polymerization also experience a switching process between the active state and dormant state throughout the polymerization as illustrated in Scheme 3. PADeP is implemented by radical entry and radical exit. Dormant particles can be activated by radical entry. Active particles can be deactivated by radical entry, which leads to instantaneous termination (assuming zero-one kinetics should be effective), and radical exit.1In order to reveal how PADeP affects PSD and MWD, the number of activation/deactivation times (Nad) for each particle is counted along with the simulation. At the end of the polymerization, the average number of activation/deactivation times per particle (![[N with combining macron]](https://www.rsc.org/images/entities/i_char_004e_0304.gif) ad) is calculated. The radical entry rate decreases with the initiator concentration, which leads to the decrease in the rate of PADeP. As a consequence,
ad) is calculated. The radical entry rate decreases with the initiator concentration, which leads to the decrease in the rate of PADeP. As a consequence, ![[N with combining macron]](https://www.rsc.org/images/entities/i_char_004e_0304.gif) ad decreases with the initiator concentration as shown in Fig. 4.
ad decreases with the initiator concentration as shown in Fig. 4.
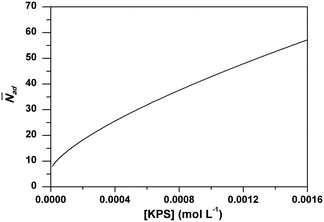 | ||
Fig. 4 Effect of initiator concentration on the average particle activation/deactivation times per particle (![[N with combining macron]](https://www.rsc.org/images/entities/i_char_004e_0304.gif) ad) from the model prediction. ad) from the model prediction. | ||
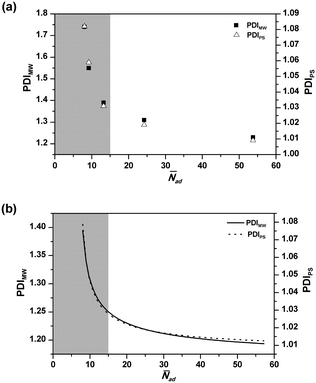
Fig. 5 shows the effect of ![[N with combining macron]](https://www.rsc.org/images/entities/i_char_004e_0304.gif) ad on the final PDIMW and PDIPS. It is seen in Fig. 5(a) that the experimental PDIMW and PDIPS are well correlated with each other and simultaneously increase as
ad on the final PDIMW and PDIPS. It is seen in Fig. 5(a) that the experimental PDIMW and PDIPS are well correlated with each other and simultaneously increase as ![[N with combining macron]](https://www.rsc.org/images/entities/i_char_004e_0304.gif) ad decreases. As shown in Fig. 5(b), the model predicts exactly the same behaviours. The changing patterns of the experimental results are well predicted by the models. It is noticed that PDIMW and PDIPS increase slightly as
ad decreases. As shown in Fig. 5(b), the model predicts exactly the same behaviours. The changing patterns of the experimental results are well predicted by the models. It is noticed that PDIMW and PDIPS increase slightly as ![[N with combining macron]](https://www.rsc.org/images/entities/i_char_004e_0304.gif) ad decreases when
ad decreases when ![[N with combining macron]](https://www.rsc.org/images/entities/i_char_004e_0304.gif) ad was over 15. However, when
ad was over 15. However, when ![[N with combining macron]](https://www.rsc.org/images/entities/i_char_004e_0304.gif) ad dropped below 15, the increases of PDIMW and PDIPS become significant (the grey part in Fig. 5).
ad dropped below 15, the increases of PDIMW and PDIPS become significant (the grey part in Fig. 5).
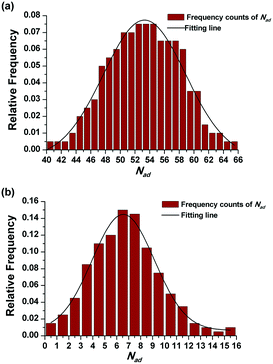
The effect of PADeP on PDIMW and PDIPS could be explained by the law of large numbers in probability theory. According to the law of large numbers, the average value of the results obtained from a large number of trials should be close to the expected value, and will tend to become closer as more trials are performed.26 For a specific particle, PADeP is a random event and ![[N with combining macron]](https://www.rsc.org/images/entities/i_char_004e_0304.gif) ad is the expected value of the number of PADeP the particle will experience in the polymerization. Fig. 6 shows the distributions of Nad in the typical cases of Exp 1 and Exp 5. It is seen that the distributions of Nad can be well fitted by Gaussian distribution. The effect of the initiator concentration on the coefficient of variation for Nad (CV) is presented in Fig. 7. The calculation of CV can be found in the ESI.† CV increases dramatically with the decrease of the initiator concentration. In other words, the distribution of Nad broadens as the initiator concentration decreases, which obeys the law of large numbers. Fig. 8 shows the relationships of PDIMW and PDIPS with CV. An approximately linear correlation is found between PDIMW/PDIPS and CV. It is clear that both PDIMW and PDIPS should be the mappings of the dispersity of Nad.
ad is the expected value of the number of PADeP the particle will experience in the polymerization. Fig. 6 shows the distributions of Nad in the typical cases of Exp 1 and Exp 5. It is seen that the distributions of Nad can be well fitted by Gaussian distribution. The effect of the initiator concentration on the coefficient of variation for Nad (CV) is presented in Fig. 7. The calculation of CV can be found in the ESI.† CV increases dramatically with the decrease of the initiator concentration. In other words, the distribution of Nad broadens as the initiator concentration decreases, which obeys the law of large numbers. Fig. 8 shows the relationships of PDIMW and PDIPS with CV. An approximately linear correlation is found between PDIMW/PDIPS and CV. It is clear that both PDIMW and PDIPS should be the mappings of the dispersity of Nad.
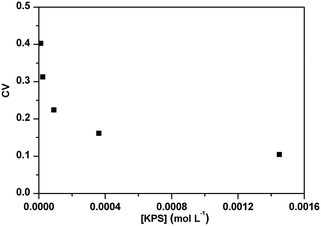 | ||
| Fig. 7 Effect of initiator concentration on the coefficient of variation for the number of the activation/deactivation times (CV). | ||
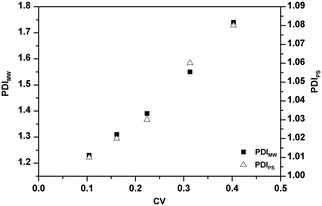 | ||
| Fig. 8 Effect of the coefficient of variation for the number of the activation/deactivation times (CV) on dispersities of molecular weight distribution (PDIMW) and particle size distribution (PDIPS). | ||
Conclusions
The seeded RAFT emulsion polymerization of styrene at low initiator concentrations was modelled using PBEs and MC simulations. Without any adjusting parameter, the model could present accurate predictions on the polymerization kinetics, PSD and the characteristic changing trend of MWD as the initiator concentration was reduced to extremely low levels. It was revealed that PADeP should exert a significant effect on RAFT emulsion polymerization of styrene in terms of PSD and MWD. At low initiator concentrations, both PDIPS and PDIMW should be the mappings of the dispersity of Nad. Controlled by the random nature of PADeP, both PDIPS and PDIMW would increase dramatically with decreasing the initiator concentration. However, in the cases of higher initiator concentrations, where![[N with combining macron]](https://www.rsc.org/images/entities/i_char_004e_0304.gif) ad was above 15, the effect of PADeP would become much weaker. And PDIMW should be mainly controlled by the RAFT reaction.
ad was above 15, the effect of PADeP would become much weaker. And PDIMW should be mainly controlled by the RAFT reaction.
Nomenclature
Symbols
| C P | Monomer concentration in the latex particle, mol L−1 |
| C W | Monomer concentration in the aqueous phase, mol L−1 |
| C XP | RAFT agent concentration in the latex particle, mol L−1 |
| CV | Coefficient of variation for the number of activation/deactivation times per particle |
| d m | Density of monomer, g L−1 |
| d n | Number average diameter, nm |
| d p | Density of polymer, g L−1 |
| d v | Volume average diameter, nm |
| D W | Diffusion coefficient for monomer radicals, dm2 |
| [E·] | Aqueous phase concentration of monomer radicals, mol L−1 |
| [I] | Initiator concentration, mol L−1 |
| [IMi·] | Aqueous phase concentration of oligomeric radicals, i = 1,2,...,z, mol L−1 |
| [R] | RAFT agent concentration, mol L−1 |
| GPC | Gel permeation chromatography |
| G(r) | Growth rate for latex particles, L s−1 |
| k des | Rate coefficient of radical desorption, s−1 |
| k dM | Desorption rate coefficient of monomer radicals, s−1 |
| k add | Addition rate coefficient, L mol−1 s−1 |
| k frag | Fragmentation rate coefficient, s−1 |
| k e | Entry rate coefficient of oligomeric radicals, L mol−1 s−1 |
| keE | Re-entry rate coefficient of monomer radicals, L mol−1 s−1 |
| k prop | Rate coefficient of the monomer radical propagation instead of desorption, s−1 |
| k P | Propagation rate, L mol−1 s−1 |
| k 1P | Monomer radical propagation rate, L mol−1 s−1 |
| k pw | Partition coefficient of the monomer between the water and polymer phases |
| k tr | Rate coefficient of radical chain transfer to monomer, L mol−1 s−1 |
| k tr,RAFT | Rate coefficient of RAFT reaction, L mol−1 s−1 |
| MWD | Molecular weight distribution |
| MC | Monte Carlo |
| M 0 | Molar mass of monomer unit, g mol−1 |
| M n | Number average molecular weight, g mol−1 |
| M w | Weight average molecular weight, g mol−1 |
| N ad | Number of activation/deactivation times per particle |
![[N with combining macron]](https://www.rsc.org/images/entities/i_char_004e_0304.gif) ad
ad
| Average number of activation/deactivation times per particle |
| ΔNM | Number of reacted monomer units |
| N P | Particle number, Llatex−1 |
![[n with combining macron]](https://www.rsc.org/images/entities/i_char_006e_0304.gif)
| Average radical number per particle |
| n M | Molar mass of the unreacted monomer, mol L−1 |
| n 0 | Population density function of particle with no free radical, mol L−1 dm−1 |
| n m1 | Population density function of particle with a monomer radical, mol L−1 dm−1 |
| n p1 | Population density function of particle with a polymer radical, mol L−1 dm−1 |
| n PXP1 | Population density function of particle with an intermediate radical, mol L−1 dm−1 |
| N A | Avogadro's number |
| PADeP | Particle activation/deactivation process |
| PBE | Population balance equation |
| PDIPS | Dispersity of particle size distribution |
| PDIMW | Dispersity of molecular weight distribution |
| r | Radius of unswollen latex particles, dm |
| Δr | Length of discretized radius domain, dm |
| r s | Radius of swollen latex particles, dm |
| t | Reaction time, s |
| Δt | Reaction time increment, s |
![[t with combining macron]](https://www.rsc.org/images/entities/i_char_0074_0304.gif) des
des
| Average time for radical desorption, s |
| t des | Imaginary time for radical desorption, s |
![[t with combining macron]](https://www.rsc.org/images/entities/i_char_0074_0304.gif) entry
entry
| Average time interval between the radical entries, s |
| t entry | Imaginary time for the radical entry, s |
![[t with combining macron]](https://www.rsc.org/images/entities/i_char_0074_0304.gif) prop
prop
| Average time for monomer radical propagation instead of desorption, s |
| t prop | Imaginary time for the radical propagation instead of desorption, s |
| V S | Swollen volume of the latex particle, L |
| V W | Volume of the aqueous phase, L |
| y | A homogeneous random number between 0 and 1 |
| z | Critical degree of polymerization |
Greek letters
| ρ | Overall entry rate, s−1 |
| ρ initiator | Entry rate for initiator-derived radicals, s−1 |
| ρ re-entry | Entry rate for monomer radicals, s−1 |
Acknowledgements
The authors would like to thank the financial support from the National Natural Science Foundation of China (Grant No. 21636008).References
- R. G. Gilbert, Emulsion Polymerization: A Mechanistic Approach, Academic Press, London, 1995 Search PubMed.
- J. M. Asua, J. Polym. Sci., Part A: Polym. Chem., 2004, 42, 1025–1041 CrossRef CAS.
- C. S. Chern, Prog. Polym. Sci., 2006, 31, 443–486 CrossRef CAS.
- P. F. Luckham and M. A. Ukeje, J. Colloid Interface Sci., 1999, 220, 347–356 CrossRef CAS PubMed.
- P. B. Zetterlund, Y. Kagawa and M. Okubo, Chem. Rev., 2008, 108, 3747–3794 CrossRef CAS PubMed.
- M. F. Cunningham, Prog. Polym. Sci., 2008, 33, 365–398 CrossRef CAS.
- J. Qiu, B. Charleux and K. Matyjaszewski, Prog. Polym. Sci., 2001, 26, 2083–2134 CrossRef CAS.
- P. B. Zetterlund, Polym. Chem., 2011, 2, 534 RSC.
- K. Yan, X. Gao and Y. Luo, J. Polym. Sci., Part A: Polym. Chem., 2015, 53, 1848–1853 CrossRef CAS.
- G. Moad, E. Rizzardo and S. H. Thang, Aust. J. Chem., 2012, 65, 985–1076 CrossRef CAS.
- J. Zeaiter, J. A. Romagnoli, G. W. Barton, V. G. Gomes, B. S. Hawkett and R. G. Gilbert, Chem. Eng. Sci., 2002, 57, 2955–2969 CrossRef CAS.
- H. Tobita and F. Yanase, Macromol. Theory Simul., 2007, 16, 476–488 CrossRef CAS.
- H. Tobita, Y. Takada and M. Nomura, Macromolecules, 1994, 27, 3804–3811 CrossRef CAS.
- H. Tobita, Y. Takada and M. Nomura, J. Polym. Sci., Part A: Polym. Chem., 1995, 33, 441–453 CrossRef CAS.
- H. Tobita, Macromol. Theory Simul., 2009, 18, 108–119 CrossRef CAS.
- Y. Luo, R. Wang, L. Yang, B. Yu, B. Li and S. Zhu, Macromolecules, 2006, 39, 1328–1337 CrossRef CAS.
- G. Moad, E. Rizzardo and S. H. Thang, Aust. J. Chem., 2009, 62, 1402–1472 CrossRef CAS.
- K. Yan, X. Gao and Y. Luo, Macromol. Rapid Commun., 2015, 36, 1277–1282 CrossRef CAS PubMed.
- K. Yan, X. Gao and Y. Luo, AIChE J., 2016, 62, 2126–2134 CrossRef CAS.
- N. M. Ahmad, B. Charleux, C. Farcet, C. J. Ferguson, S. G. Gaynor, B. S. Hawkett, F. Heatley, B. Klumperman, D. Konkolewicz, P. A. Lovell, K. Matyjaszewski and R. Venkatesh, Macromol. Rapid Commun., 2009, 30, 2002–2021 CrossRef CAS PubMed.
- S. Y. Yu-Su, F. C. Sun, S. S. Sheiko, D. Konkolewicz, H. I. Lee and K. Matyjaszewski, Macromolecules, 2011, 44, 5928–5936 CrossRef CAS.
- Y. Reyes and J. M. Asua, Macromol. Rapid Commun., 2011, 32, 63–67 CrossRef CAS PubMed.
- N. Ballard, S. Rusconi, E. Akhmatskaya, D. Sokolovski, J. C. de la Cal and J. M. Asua, Macromolecules, 2014, 47, 6580–6590 CrossRef CAS.
- D. Konkolewicz, S. Sosnowski, D. R. D'hooge, R. Szymanski, M. F. Reyniers, G. B. Marin and K. Matyjaszewski, Macromolecules, 2011, 44, 8361–8373 CrossRef CAS.
- D. Konkolewicz, P. Krys and K. Matyjaszewski, Acc. Chem. Res., 2014, 47, 3028–3036 CrossRef CAS PubMed.
- G. R. Grimmett and D. R. Stirzaker, Probability and Random Processes, Clarendon Press, Oxford, 2nd edn, 1992 Search PubMed.
Footnote |
| † Electronic supplementary information (ESI) available. See DOI: 10.1039/c6re00168h |
| This journal is © The Royal Society of Chemistry 2017 |

