Raman spectroscopy in microsurgery: impact of operating microscope illumination sources on data quality and tissue classification†
Joannie
Desroches
*a,
Audrey
Laurence
a,
Michael
Jermyn
bc,
Michael
Pinto
a,
Marie-Andrée
Tremblay
a,
Kevin
Petrecca
b and
Frédéric
Leblond
a
aDept. of Engineering Physics, Polytechnique Montreal, CP 6079, Succ. Centre-Ville, Montreal, QC H3C 3A7, Canada. E-mail: joannie.desroches@gmail.com
bMontreal Neurological Institute and Hospital, Dept. of Neurology and Neurosurgery, McGill University, 3801 University St, Montreal, QC H3A 2B4, Canada
cCentre de Recherche du Centre Hospitalier de l'Université de Montréal, 900 rue Saint-Denis, H2X 0A9, QC, Canada
First published on 31st October 2016
Abstract
Ambient light artifacts can confound Raman spectroscopy measurements performed in a clinical setting such as during open surgery. However, requiring light sources to be turned off during intraoperative spectral acquisition can be impractical because it can slow down the procedure by requiring surgeons to acquire data under light conditions different from the routine clinical practice. Here a filter system is introduced allowing in vivo Raman spectroscopy measurements to be performed with the light source of a neurosurgical microscope turned on, without interfering with the standard procedure. Ex vivo and in vivo results on calf and human brain, respectively, show that when the new filter system is used there is no significant difference between Raman spectra acquired under pitch dark conditions or with the microscope light source turned on. This is important for the clinical translation of Raman spectroscopy because of the resulting decrease in total imaging time for each measurement and because the surgeon can now acquire spectroscopic data with no disruption of the surgical workflow.
Introduction
Tissue interrogation using Raman spectroscopy has been exploited to develop surgical guidance tools that can help improve the safety of tissue resection procedures as well as minimize the volume of residual pathological tissue.1,2 This is especially important for applications involving microsurgical techniques where tissue information is typically required at the sub-millimetre scale in critical areas at or close to margins between normal and pathological tissue. Microsurgery involves the use of an operating microscope providing surgeons with a magnified view of the surgical field under white-light illumination using powerful incandescent arc lamps with spectral power densities in the visible as well as in the near-infrared regions of the electromagnetic spectrum. The level of visible light associated with these microscopes can be controlled by the surgeon up to ∼10 mW cm−2 nm−1 within the imaging plane. Microscopes with different technical specifications (e.g., spatial footprint, field of view, magnification, illumination sources) were made for specific medical applications including ophthalmology, orthopaedic surgery, gynaecological surgery, otolaryngology, neurosurgery, oral & maxillofacial surgery, plastic surgery and podiatric surgery.1,3–7 A difficulty associated with the seamless integration of Raman spectroscopy in the surgical workflow is that emission from the microscope lamps can introduce broad or sharp spectral artefacts depending on the illumination source, which is usually a LED, halogen or arc lamp. The artefacts in the detected signals can corrupt the inelastic scattering spectra, thus preventing Raman tissue information associated with amino acids, lipids, proteins and DNA to be used quantitatively. Those artefacts can either appear directly or indirectly in the spectra. Direct spectral corruption will be associated with visible or near-IR light from the microscope lamp resulting from wavelengths within the spectral window of detection of the Raman system. For example, fingerprint Raman systems with excitation lasers peaked around λex (typically 660, 785, 830 or 1064 nm for biomedical applications8) are susceptible to microscope lamp excitation peaks above λex since those spectral components are unaffected by the high-pass filters responsible for rejecting elastically scattered Rayleigh light. On the other hand, indirect Raman signal corruption can result from a microscope lamp wavelength below λex despite the presence of the high-pass filters. This can be attributable to the interplay between interference filter bleed-through associated with imperfect light attenuation (individual filters can typically have up to optical density OD = 6 attenuation) and the weak amplitude of the inelastic light contribution relative to the strong intensity of the illumination at wavelengths above λex.Herein the development and validation of a simple technique that can be implemented in any operating theatre is presented to allow intraoperative Raman spectroscopy to be performed under operating microscope illumination and thus facilitate integration into surgical workflows. The proposed method consists of a custom optical filter adapter seamlessly integrated on the front lens of an operating microscope to filter light emitted from the source with wavelengths above λex. The design of the adapter is presented as well as its detailed evaluation for different levels of operating microscope light intensities based on ex vivo calf brain measurements. The illumination conditions under which the distinguishing molecular features of white and gray matter can be detected are presented, as well as the conditions under which support vector machine (SVM) automated tissue classification can be realized with sensitivity and specificity comparable to ideal conditions when operating microscope lights are turned off. In vivo intraoperative measurements made during human glioma surgery are presented to further confirm the conditions under which Raman spectroscopy under operating microscope lights can be achieved.
Experimental
Design of the filter adapter
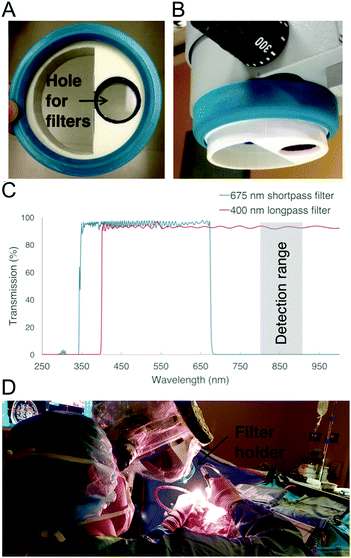
An adapter was designed to hold the filters in the light path of a Zeiss Pentero operating microscope (Carl Zeiss AG, Oberkochen, Germany). Two shortpass filters (cut-off at 675 nm, Edmund Optics, USA) of optical density (OD) 4 and one longpass (cut-off at 400 nm, Edmund Optics, USA) filter of OD 4 (all with a diameter of 25 mm and a thickness of 3 mm) were fixed under the microscope's head using a custom 3D printed holder (Fig. 1). The holder was positioned in front of the white-light source (xenon short-arc lamp, OSRAM, Germany) to ensure that light is filtered before illuminating the tissue. The adapter piece was printed using white ABS plastic and was designed not to interfere with the sterile drapes used during neurosurgical procedures (see the 3D modelisation in the ESI†). A rubber cap taken from an unused microscope drape (Ecolab, Mississippi) was glued to the 3D-printed part in order to stick it onto the microscope head as shown in Fig. 1. The operating microscope in Fig. 1 is equipped with a while-light lamp that can be operated at variable electronically-controlled output power values.Ex vivo experiments on a calf brain
The Raman spectroscopy system, described in detail previously,9,10 consists of a 785 nm excitation laser (Innovative Photonic Solutions, NH, USA), a hand-held fiber optic probe (EnVision LLC, FL, USA), and a spectrometer coupled to a high-resolution charged coupled device spectroscopic detector (ANDOR Technology, Belfast, UK). The probe was used to acquire spectra ex vivo on white and gray matter locations of a calf brain. For each measurement, an ambient light measurement was taken without the laser excitation source, and then three spectra were acquired each with an acquisition time T = 50 ms. For each probe location, the measurements were made with the probe in contact with tissue in the range of different light conditions summarized in Table 1. The measurements labelled “No lights” in the table (operating microscope light off) were acquired before and after the “white light” measurements to be used as controls. Overall 94 ex vivo control measurements were made on a calf brain (50% in gray matter, 50% in white matter), with the corresponding measurements made (at the same tissue location) under white light illumination (9, 22, 39 and 74 mW cm−2 at 800 nm) with and without the filter adapter.| Light condition | Gray matter (calf brain) n | White matter (calf brain) n | Human brain n |
|---|---|---|---|
| White light | |||
| 5% intensity | 5 | 5 | |
| 25% intensity | 5 | 5 | |
| 50% intensity | 5 | 5 | |
| 5% intensity with filter | 5 | 5 | 3 |
| 25% intensity with filter | 5 | 5 | |
| 50% intensity with filter | 5 | 5 | |
| 100% intensity with filter | 3 | ||
| No lights | 47 | 47 | 3 |
The reason for making measurements in white and gray matter with the microscope light turned off is that they will be used to evaluate the impact of the filter adapter on Raman spectra as well as tissue classification. For classification, a support vector machine (SVM) algorithm with principal component analysis (PCA) was used, which uses mathematical optimisation to find the hyperplane (in principal component space) maximizing the separation of spectra from different tissue types.11 A classifier was trained using the dataset consisting of all Raman spectra acquired with the operating microscope light turned off. The classification (white matter vs. gray matter) results were obtained using two testing datasets composed of all spectra acquired with the microscope light turned on with and without the filter adapter. Sensitivity, specificity and accuracy in detecting white or gray matter were computed for both testing datasets.
Intraoperative measurements
The Raman spectroscopy probe was used during brain tumor resection for one patient with an oligodendroglioma grade III tumor at the Montreal Neurological Institute and Hospital. The study was approved by the Ethics Review Board and informed consent was obtained. The filter adapter was installed on the operating microscope prior to covering the microscope with drapes isolating it from the sterile surgical environment. During the procedure, the probe was placed in contact with tissue at three different brain parenchyma locations and Raman spectra were acquired under tissue exposed with white-light (9 and 74 mW cm−2 at 800 nm) (Table 1).Data processing and analysis
The following data processing steps were applied to the raw spectroscopic probe measurements: (1) ambient light subtraction, which consists of the subtraction of the measurement acquired with the 785 nm laser source turned off, (2) spectral correction accounting for the instrument spectral response function of the system using a measurement made on a Raman standard (SRM2241, National Institute of Standards and Technology, Gaithersburg, USA), (3) removal of the intrinsic tissue fluorescence background with an iterative polynomial fit,12 (4) normalization with standard normal variate and (5) smoothing with a Gaussian filter.13 Principal component analysis was used on the calf brain dataset to quantitatively assess the differences between spectra acquired under different light conditions.14 The Pearson correlation coefficient was evaluated between spectra acquired with operating microscope lights turned off and every light condition was determined to evaluate quantitatively the correlation between them. The correlation coefficient was also calculated between spectra acquired with no light before and after the sets of measurements to be used as a reference correlation coefficient for two signals acquired under similar conditions.Results
Ex vivo experiments on a calf brain
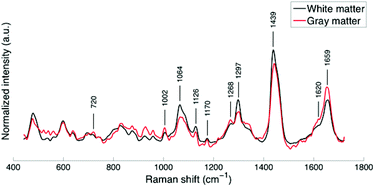
The average spectra of white and gray matter (“no lights” in Table 1) show the principal bands associated with cholesterol, sphingomyelin, saturated lipids and proteins (Fig. 2).15Compared with gray matter, the average white matter spectrum shows increased intensities of bands at 1064, 1297, and 1439 cm−1, which is a direct consequence of the differences in lipid contents. The spectrum of gray matter shows, in agreement with previous findings,15–19 an increased phenyl alanine peak at 1002 cm−1 as well as increased intensities of bands at 1602, 1620, 1640 and 1659 cm−1 that can be attributed to a higher protein content.
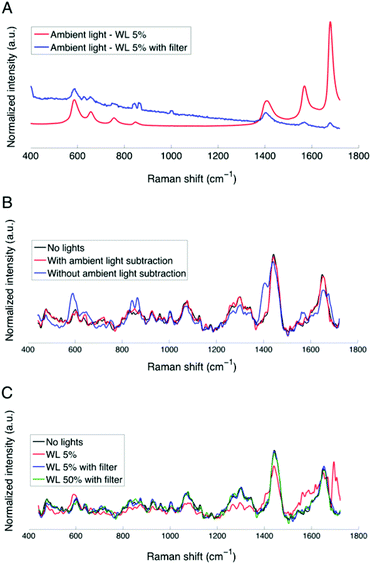
The spectral profile of the operating microscope white light source can be seen in Fig. 3A, showing sample ambient light measurements (5 mW cm−2 at 800 nm) corresponding to spectra acquired with the laser source turned off, with (blue curve) and without (red curve) the filter adapter inserted into the excitation light path. The spectra are amplitude-normalized so that they can be visualized on the same graph. The filter adapter attenuates by as much as 50 times the intensity associated with the principal arc lamp peaks, most noticeably those seen at 608 cm−1 (824 nm), 674.5 cm−1 (829 nm), 1579 cm−1 (896 nm) and 1694 cm−1 (905 nm).
However, Fig. 3A shows that the main arc lamp peaks are still present in the ambient light measurement despite the presence of the filter adapter. Fig. 3B shows the corresponding Raman spectra (with the filter adapter and with the laser activated) acquired under white light illumination with and without ambient light subtraction. This figure demonstrates that the residual lamp peaks have a measurable impact on the calf brain Raman spectra (blue curve) when background subtraction is not performed. However, when subtraction of the ambient light measurement is performed, Fig. 3B shows that the Raman spectrum (black curve) acquired under pitch dark conditions overlaps that associated with the spectrum where ambient light was subtracted (red curve). As a result, the combination of the filter adapter and the ambient light subtraction appears to efficiently remove the contributions from the operating microscope white light. Fig. 3C shows gray matter spectra acquired with and without the filter adapter with the white light at 5% intensity, with ambient light subtraction. This figure demonstrates that the microscope unfiltered white light, even at low intensities (red curve), will cause artefacts in the Raman spectra, especially in the spectral region associated with proteins (1558 to 1659 cm−1) (Fig. 3C).10 Higher operating microscope light intensities (>5 mW cm−2 at 800 nm) have a similar impact on the spectra and all subsequent analysis will be presented based on data that has been processed with ambient light subtraction.
In order to further the ex vivo analysis, the effect of operating microscope white light on classification – white matter vs. gray matter – was evaluated. Using the “no lights” measurements as the training dataset and the measurements under filtered or unfiltered microscope light as the testing sets, the SVM classification algorithm correctly identified 100% of the samples acquired under filtered light while the accuracy for the dataset with unfiltered light was 83.3%, with a sensitivity of 100% and a specificity of 66.7% (Table 2).
| Testing dataset | Sensitivity (%) | Specificity (%) | Accuracy (%) |
|---|---|---|---|
| White light | 100 | 66.7 | 83.3 |
| White light with filter | 100 | 100 | 100 |
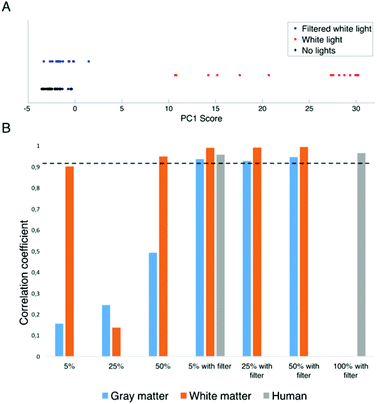
A principal component analysis was then performed on the calf brain gray and white matter datasets, in order to analyse the correlation between the spectra acquired under different light conditions. For conciseness, only the gray matter results are presented here since identical conclusions are reached based on white matter spectra. The scores of the first principal component, which captures 86.3% of the spectral variance in the data, are shown in Fig. 4A for the datasets associated with “No light”, “Unfiltered white light” and “Filtered white light”. The PCA plot of the first principal component shows that the spectra acquired under no lights and filtered white light are grouped in a cluster, whereas the ones from spectra acquired under unfiltered white light are separated, which suggests that the operating microscope light has a significant impact on the spectra. In order to substantiate this observation, Fig. 4B shows the correlation coefficient between spectra acquired under no lights and the other light conditions including: 5%, 25% and 50% of maximum intensity, with and without the optical adapter. The dotted line in the figure is a measure of the system noise measured as the mean correlation coefficient associated with the two “no lights” measurements made before and after each acquisition sequence. The histogram data demonstrate that the correlation coefficients associated with filtered light are – in all cases – within the system noise implying that potential residual effects of the operating microscope lights are smaller than those in the system noise. This is however not the case for data acquired under unfiltered lights, where the correlation coefficient is typically lower than the threshold. This effect is more pronounced for gray matter than for white matter.
Intraoperative in vivo measurements
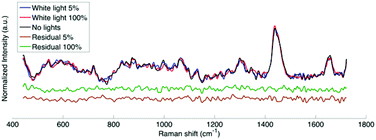
The hand-held probe was used during brain tumor resection to measure spectra under different light conditions. Fig. 5 shows the Raman spectra (averaged over 3 different cortex locations) under filtered white light at two intensities (5% and 100% of maximum intensity), as well as with the operating microscope lights turned off. The residuals between the average Raman spectra with lights at two intensities and the spectrum with no lights are also shown. Qualitatively it appears that the residuals are within the system noise which suggests that the filter adapter (combined with background subtraction) efficiently negates the impact of the operating microscope light source.As was done for calf brain measurements, the correlation coefficients were calculated for the human data between spectra acquired under no lights and spectra acquired with filtered white light (Fig. 4B). Similarly to ex vivo white and gray matter measurements in a calf brain, the correlation coefficients for human data are always above the system noise threshold.
Discussion
Clinical translation of Raman spectroscopy in microsurgery applications can be facilitated by the development of methodologies ensuring minimal disruption of the surgical workflow. For example, signal corruption from operating room light sources can prevent accurate tissue classification since information can be lost for characteristic spectral tissue bands associated with molecular constituents essential for distinguishing different tissue types (e.g. normal vs. cancer tissue). Here the development and validation of a technique where a custom optical filter adaptor is seamlessly integrated into a surgical microscope was presented, allowing intraoperative Raman spectroscopy to be achieved under the white light source of an operating microscope.In vivo Raman spectroscopy usually implies dealing with low signal to noise ratio (SNR) spectra due to restrictive constraints of laser exposure (time and power density) to comply with safe margins for both patients and the operating room staff. One way to correct ambient light artefacts in the Raman spectra consists of acquiring an ambient light measurement and subtracting it from the desired signal. This is efficient for removing broad, weak and repeatable peaks but it is insufficient for lights as strong as a conventional surgical microscope. Notably, the light from the microscope at full intensity is enough to saturate a detector sensitive enough for in vivo Raman spectroscopy and will introduce significant shot noise, drowning the weak spontaneous Raman signal of interest. Shot noise is the dominant noise source in Raman spectroscopy and is proportional to the amount of photons reaching the CCD detector. As such, the introduction of ambient/microscope light to the detector significantly increases the shot noise and brings the SNR to unusable levels. The addition of filters to the surgical microscope supresses light in the spectral region of interest making it possible to acquire Raman spectra with the operating light on without significantly impacting shot noise on the detector or risking saturation. One of the advantages of this filtering technique is that it is easy to implement, and it can be used with existing Raman spectroscopy systems without the need for complex system implementations such as for wavelength-modulated Raman spectroscopy or shifted excitation Raman difference spectroscopy.20,21
Specifically, it was demonstrated that near infrared Raman spectroscopy can be achieved under white light illumination during microsurgical procedures based on ex vivo and in vivo tissue measurements in calf and human brains, respectively. The use of interference filters attached to the head of a surgical microscope can sufficiently attenuate the near infrared peaks of arc lamps to allow the acquisition of tissue-specific Raman spectra. This was determined by computing a similar figure of merit (Fig. 5) comparing pure tissue spectra acquired under pitch dark conditions (no corruption from light sources other than the excitation laser) with spectra acquired with the microscope lights turned on. It was quantitatively demonstrated that the new filter adapter technique ensures that the differences between tissue Raman spectra with microscope lights on or off are within the noise characteristics of the system.
These findings are important because slight differences in the molecular composition of sampled areas lead to characteristic Raman spectra showing spectral information that can be used to distinguish different tissue structures. For example, in the case of white vs. gray matter in the calf brain, the measurements with the microscope light turned off (Fig. 2) show peaks associated with lipid and protein bands consistent with the literature. Using a machine learning technique, it was demonstrated that classification between white and gray matter can be achieved with 100% accuracy with the operating microscope lights on when the microscope is fitted with the filter adapter. However, when using measurements done with the operating microscope light turned on without the filter adapter, the residual light artefacts (Fig. 3) in the Raman signals lead to a 33% drop in specificity.
An important observation stemming from the ex vivo measurements is that the intrinsic tissue optical properties (absorption, elastic scattering) can significantly impact the relative contribution of the Raman signal when compared with the artefacts associated with the microscope white lights. For example, the correlation coefficients without the filter adapter in Fig. 5 are much lower for gray matter than for white matter. This can be attributed to the larger near infrared penetration depth of gray matter when compared with white matter. This is a direct consequence of the larger absorption and reduced scattering coefficients of gray matter in the near infrared.22 The reduced biomolecule concentration in gray matter, due to the higher water content, could intuitively lead to a decrease in the penetration depth. However, the optical properties of tissue depend on many parameters, and the overall measured optical properties show that the penetration depth is greater in gray matter. As a result, the near infrared components associated with the white light source penetrate into the tissue and diffuses into the detection cone of the probe. Since diffusion is less important for white matter, a smaller fraction of the near infrared light impinging on tissue reaches the probe.
Spectral differences between acquisitions on normal and cancerous tissue are far subtler than those between white and grey matter. Classification is therefore more sensitive to the introduction of artefacts and the presence of unfiltered microscope light would make sensitivity, specificity and accuracy drop to unusable levels. This brings to light the importance of reducing noise and external artefacts in in vivo clinical settings. Our preliminary results on in vivo human data acquired during brain tumour resection show next to no impact on measurements made under filtered microscope light compared to measurements made under “no lights”. However, a future larger scale clinical study is warranted in order to assess the impact of ambient light on tissue classification.
Competing financial interests
K. P. and F. L. are co-founders of ODS Medical Inc., a medical device company that seeks to commercialize the Raman spectroscopy system for real-time detection of tissue abnormalities.Acknowledgements
This work is supported by the Natural Sciences and Engineering Research Council of Canada (NSERC), the Canadian Institute of Health Research (CIHR), the Canadian Foundation for Innovation (CFI) and the Groupe de Recherche en Sciences et Technologies Biomedicales (GRSTB).References
- M. B. Fenn, et al., Raman spectroscopy for clinical oncology, Adv. Opt. Technol., 2011, 2011, 213783 Search PubMed.
- K. Kong, C. Kendall, N. Stone and I. Notingher, Raman spectroscopy for medical diagnostics—From in-vitro biofluid assays to in-vivo cancer detection, Adv. Drug Delivery Rev., 2015, 89, 121–134 Search PubMed.
- C. Kallaway, et al., Advances in the clinical application of Raman spectroscopy for cancer diagnostics, Photodiagn. Photodyn. Ther., 2013, 10, 207–219 Search PubMed.
- K. A. Antonio and Z. D. Schultz, Advances in biomedical raman microscopy, Anal. Chem., 2014, 86, 30–46 CrossRef CAS PubMed.
- H. Abramczyk and B. Brozek-Pluska, Raman Imaging in Biochemical and Biomedical Applications. Diagnosis and Treatment of Breast Cancer, Chem. Rev., 2013, 113(8), 5766–5781 Search PubMed.
- L. A. Austin, S. Osseiran and C. L. Evans, Raman Technologies in Cancer Diagnostics, Analyst, 2015, 141(2), 476–503 Search PubMed.
- A. Rae, R. Stosch, P. Klapetek, A. R. Hight Walker and D. Roy, State of the art Raman techniques for biological applications, Methods, 2014, 68, 338–347 Search PubMed.
- J. F. Kelly, T. a. Blake, B. E. Bernacki and T. J. Johnson, Design Considerations for a Portable Raman Probe Spectrometer for Field Forensics, Int. J. Spectrosc., 2012, 2012, 1–15 Search PubMed.
- J. Desroches, et al., Characterization of a Raman spectroscopy probe system for intraoperative brain tissue classification, Biomed. Opt. Express, 2015, 6, 2380 Search PubMed.
- M. Jermyn, et al., Intraoperative brain cancer detection with Raman spectroscopy in humans, Sci. Transl. Med., 2015, 7, 274ra19–274ra19 Search PubMed.
- E. Widjaja, W. Zheng and Z. Huang, Classification of colonic tissues using near-infrared Raman spectroscopy and support vector machines, Int. J. Oncol., 2008, 32, 653–662 Search PubMed.
- J. Zhao, H. Lui, D. I. McLean and H. Zeng, Automated Autofluorescence Background Subtraction Algorithm for Biomedical Raman Spectroscopy, Appl. Spectrosc., 2007, 61, 1225–1232 Search PubMed.
- M. Jermyn, et al., Neural networks improve brain cancer detection with Raman spectroscopy in the presence of light artifacts, J. Biomed. Opt., 2016, 21(9), 094002 Search PubMed.
- H. Abdi and L. J. Williams, Principal component analysis, Wiley Interdiscip. Rev. Comput. Stat., 2010, 2, 433–459 Search PubMed.
- M. Daković, et al., Profiling differences in chemical composition of brain structures using Raman spectroscopy, Talanta, 2013, 117, 133–138 CrossRef PubMed.
- C. Krafft, S. B. Sobottka, G. Schackert and R. Salzer, Analysis of human brain tissue, brain tumors and tumor cells by infrared spectroscopic mapping, Analyst, 2004, 129, 921–925 Search PubMed.
- M. Köhler, S. Machill, R. Salzer and C. Krafft, Characterization of lipid extracts from brain tissue and tumors using Raman spectroscopy and mass spectrometry, Anal. Bioanal. Chem., 2009, 393, 1513–1520 Search PubMed.
- C. Krafft, L. Neudert, T. Simat and R. Salzer, Near infrared Raman spectra of human brain lipids, Spectrochim. Acta., Part A, 2005, 61, 1529–1535 Search PubMed.
- C. Krafft, S. B. Sobottka, G. Schackert and R. Salzer, Near infrared Raman spectroscopic mapping of native brain tissue and intracranial tumors, Analyst, 2005, 130, 1070–1077 Search PubMed.
- S. Dochow, et al., Etaloning, fluorescence and ambient light suppression by modulated wavelength Raman spectroscopy, Biomed. Spectrosc. Imaging, 2012, 1, 383–389 Search PubMed.
- M. Maiwald, A. Müller, B. Sumpf, G. Erbert and G. Tränkle, Capability of shifted excitation Raman difference spectroscopy under ambient daylight, Appl. Opt., 2015, 54, 5520 Search PubMed.
- A. N. Yaroslavsky, et al., Optical properties of selected native and coagulated human brain tissues in vitro in the visible and near infrared spectral range, Phys. Med. Biol., 2002, 47, 2059 Search PubMed.
Footnote |
| † Electronic supplementary information (ESI) available. See DOI: 10.1039/c6an02061e |
| This journal is © The Royal Society of Chemistry 2017 |

