 Open Access Article
Creative Commons Attribution 3.0 Unported Licence
Effects of mono- and divalent metal ions on DNA binding and catalysis of human apurinic/apyrimidinic endonuclease 1
Anastasia D.
Miroshnikova
a,
Alexandra A.
Kuznetsova
a,
Yuri N.
Vorobjev
a,
Nikita A.
Kuznetsov
 *ab and
Olga S.
Fedorova
*ab
aInstitute of Chemical Biology and Fundamental Medicine (ICBFM), Siberian Branch of Russian Academy of Sciences, 8 Lavrentyev Ave., Novosibirsk 630090, Russia. E-mail: nikita.kuznetsov@niboch.nsc.ru; fedorova@niboch.nsc.ru; Fax: +7 383-3635153; Tel: +7 383-3635174 Tel: +7 383-3635175
bDepartment of Natural Sciences, Novosibirsk State University, 2 Pirogova St., Novosibirsk 630090, Russia
First published on 6th April 2016
Abstract
Here, we used stopped-flow fluorescence techniques to conduct a comparative kinetic analysis of the conformational transitions in human apurinic/apyrimidinic endonuclease 1 (APE1) and in DNA containing an abasic site in the course of their interaction. Effects of monovalent (K+) and divalent (Mg2+, Mn2+, Ca2+, Zn2+, Cu2+, and Ni2+) metal ions on DNA binding and catalytic stages were studied. It was shown that the first step of substrate binding (corresponding to formation of a primary enzyme–substrate complex) does not depend on the concentration (0.05–5.0 mM) or the nature of divalent metal ions. In contrast, the initial DNA binding efficiency significantly decreased at a high concentration (5–250 mM) of monovalent K+ ions, indicating the involvement of electrostatic interactions in this stage. It was also shown that Cu2+ ions abrogated the DNA binding ability of APE1, possibly, due to a strong interaction with DNA bases and the sugar–phosphate backbone. In the case of Ca2+ ions, the catalytic activity of APE1 was lost completely with retention of binding potential. Thus, the enzymatic activity of APE1 is increased in the order Zn2+ < Ni2+ < Mn2+ < Mg2+. Circular dichroism spectra and calculation of the contact area between APE1 and DNA reveal that Mg2+ ions stabilize the protein structure and the enzyme–substrate complex.
Introduction
A common type of DNA damage is an apurinic/apyrimidinic site (AP-site).1 AP-sites are generated due to the repair activity of DNA glycosylases (which excise damaged bases from DNA) or via spontaneous hydrolysis of the N-glycosidic bonds.2,3 It was estimated that >10![[thin space (1/6-em)]](https://www.rsc.org/images/entities/char_2009.gif) 000 AP-sites are produced in each mammalian cell per day.3 If left unrepaired, AP-sites are both cytotoxic and mutagenic. Therefore, the repair of these lesions is essential for maintenance of genomic integrity.4,5
000 AP-sites are produced in each mammalian cell per day.3 If left unrepaired, AP-sites are both cytotoxic and mutagenic. Therefore, the repair of these lesions is essential for maintenance of genomic integrity.4,5
Human apurinic/apyrimidinic endonuclease 1 (APE1) is a key enzyme of base excision repair (BER) responsible for initiation of a search for and repair of AP-sites and other DNA lesions.6,7 APE1 is a multifunctional enzyme catalyzing the incision of the DNA phosphodiester bond on the 5′ side of AP-sites, generating a nick with 3′-hydroxyl and 5′-deoxyribose phosphate (dRP) termini.8,9 In addition to its endonuclease activity, APE1 is known to have 3′-phosphodiesterase and 3′-phosphatase activities and a 3′ to 5′ exonuclease activity.10 It is known that the level of enzymatic activity of AP-endonuclease APE1 has a considerable influence on the process of the removal of DNA lesions.11–13
Three-dimensional structures of free APE114–16 and its covalent complexes with DNA17–19 have been determined by X-ray crystallography. The crystal structures show that APE1 binds to both major and minor grooves of DNA and flips out the abasic deoxyribose phosphate. The residues Arg-73, Ala-74 and Lys-78 contact three consecutive DNA phosphates of the opposing strand on the 5′ side of the AP-site. The Met-270 residue is incorporated into the minor groove of DNA, thus displacing the base opposite to the AP-site. The residues Tyr-128 and Gly-127 span and widen the minor groove of DNA by ∼2 Å. The residue Arg-177 gets inserted through the DNA major groove and forms a hydrogen bond with a phosphate group of the AP-site 3′-phosphate. These contacts stabilize the extra-helical conformation of the AP-site in the active site of the enzyme. In the catalytically competent enzyme–substrate complex, which contains [3-hydroxytetrahydrofuran-2-yl]methyl phosphate (F-site, a stable analog of a natural AP-site, lacking the hydroxyl group at the C1′ atom of ribose), the everted F-site is placed into the active site, which is formed by amino acid residues (Asp-308, His-309, Glu-96, Asp-210, Tyr-171, Asn-212, and Asn-174) that participate in the coordination of water molecules and Mg2+ ions (Fig. 1). The phosphate residue located on the 5′ side of the AP-site is directly coordinated by amino acid residues Asn-174, Asn-212, and His-309. The catalytic reaction begins with an attack of the water molecule, presumably coordinated by Asp-210.17,19 Alternative mechanisms20,21 suggest that Tyr-171 in the phenolate form attacks the scissible phosphate or His-309 acts as the general base, generating the attacking nucleophile.
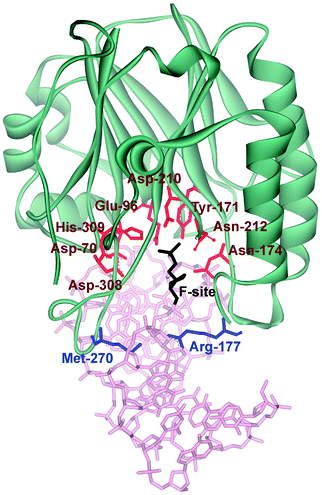 | ||
| Fig. 1 The structure of APE1 complexed with F-site-containing DNA (PDB ID 1DE8).17 Met-270 and Arg-177 (inserted into the duplex) are shown in blue. The important amino acids of the active site, which participate in the coordination of water molecules and Mg2+ ions, are highlighted in red. | ||
The Mg2+ coordination geometry and the functions of metal ions in substrate binding, cleavage, and product release are actively discussed.14–16,22–26 The first reported APE1 crystal structure contains one Sm3+ ion in the active site.14 The metal-binding site identified in this APE1 structure (PDB ID: 1BIX) is often referred to as the “A-site”. Two structures of DNA-free APE1 (PDB IDs: 1HD7 and 1E9N) were reported with Pb2+ ions in the active site.15 Both of these structures have a Pb2+ ion at the A-site, and one of the structures has the second Pb2+ ion, at the “B-site,” coordinated by residues Asp-210, Asn-212, and His-309. A “moving-metal mechanism” was proposed where one Mg2+ ion moves from the “B-site” to the “A-site” during substrate cleavage.23 In later studies, the structure of human APE1 was solved at 1.92 Å resolution with a single Mg2+ ion in the active site.16 The structure reveals ideal octahedral coordination of Mg2+via two carboxylate groups (Asp-70 and Glu-96) and four water molecules. The binding site for Mg2+ in the new structure is the same as that observed for the surrogate metals Sm3+ and Pb2+ in previously published structures of DNA-free APE1.14,15 The latest structural studies on human APE1 showed that repositioning of Mg2+ is facilitated by the structural plasticity of Glu-96 in the active site of the enzyme.26 Structures of an enzyme–product (EP) complex and enzyme–substrate (ES) complex with a single Mg2+ ion in the active site were determined recently.19,27 In the EP complex, Mg2+ is coordinated directly by Glu-96, the 3′-OH, a non-bridging O atom of the nascent 5′-phosphate, and by three water molecules, one of which is bound to Asp-70.
Two catalytic mechanisms of APE1 action, which involve one or two Mg2+ cations, were proposed.15,17 According to the mechanism employing a single metal ion in the active site, the reaction starts with the nucleophilic attack of a water molecule coordinated by Asp-210.17 In the alternative mechanism operating with two metal ions in the active site, the Mg2+ ion at the “A-site” coordinates a hydroxyl ion, which carries out a nucleophilic attack on the phosphorous 5′ to the abasic nucleotide. The Mg2+ at the “B-site” neutralizes the charge of the pentacovalent intermediate and/or stabilizes the 3′ leaving group.15 The recently published structure of a metal-bound substrate complex supports the mechanism of catalysis involving only a single metal near the “A-site.”27
Despite the successful characterization of crystal structures of human APE1 bound with various metal ions as well as substrate/product the location, the stoichiometry and the catalytic function of the divalent cation are still being debated.
Previously, the kinetic mechanism of conformational changes in APE1 and in abasic DNA molecules in the course of their interaction were studied by recording the intrinsic tryptophan fluorescence of the enzyme28,29 and the 2-aminopurine fluorescence in the DNA.30 It should be noted that APE1 has a rigid protein core, and DNA binding leads to negligible structural rearrangements (Fig. 2). Nevertheless, changes in Trp fluorescence intensity allowed us to identify the steps of DNA binding, cleavage, and product release. A comparison of the crystal structures of free APE1 (PDB ID 4LND) and APE1 bound to DNA containing an F-site (PDB ID 1DE8) reveals that one of seven Trp residues of APE1 (Trp-280) is located in the DNA-binding pocket of the enzyme and forms a hydrogen bond with the 3′ phosphate group of the AP-site. Therefore, the observed changes in fluorescence most likely reflect the conformational changes near the Trp-280 residue. We found that during recognition of an abasic site at least two pre-excision conformational transitions take place in the enzyme (Scheme 1). The binding steps led to formation of a catalytically active enzyme–substrate complex. In this complex, APE1 excises the phosphodiester bond on the 5′ side of the abasic site. The last step of the kinetic mechanism is the product release.
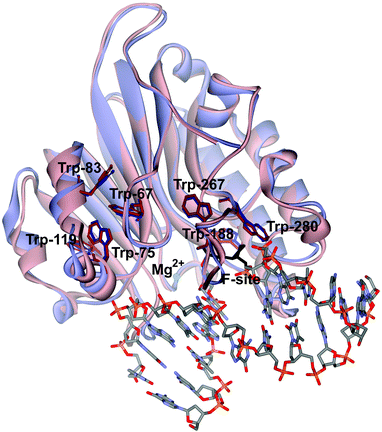 | ||
| Fig. 2 An overlay of the structures of free APE1 (reddish, PDB ID 4LND) and APE1 complexed with DNA containing an F-site (violet, PDB ID 1DE8). Trp residues of APE1 are shown. | ||
In the present work, we used stopped-flow fluorescence techniques to conduct a comparative kinetic analysis of the conformational changes of the enzyme and DNA substrate molecules during recognition and cleavage of the abasic site either in the absence of any metals in the active site or in the presence of K+, Mg2+, Mn2+, Ca2+, Zn2+, Cu2+, or Ni2+.
Materials and methods
Protein expression and purification
To purify APE1 expressed as a recombinant protein, 1 L of culture (in LB broth) of Escherichia coli strain Rosetta II(DE3) (Invitrogen, France) carrying the pET11a-APE1 construct was grown with 50 μg mL−1 ampicillin at 37 °C until absorbance at 600 nm (A600) reached 0.6–0.7; APE1 expression was induced overnight with 0.2 mM isopropyl-β-D-thiogalactopyranoside. The method for isolation of wild-type APE1 was described previously.29,31 The protein concentration was measured by the Bradford method;32 the stock solution was stored at −20 °C.Oligodeoxynucleotides (ODNs)
The sequence of the DNA (substrate) used in this work is presented in Table 1. The oligonucleotides (13 and 17 bp) were synthesized by standard phosphoramidite methods on an ASM-700 synthesizer (BIOSSET Ltd, Novosibirsk, Russia) in the Laboratory of Bionanotechnology of ICBFM using phosphoramidites purchased from Glen Research (Sterling, VA). The synthetic oligonucleotides were uncoupled from the solid support with ammonium hydroxide according to the manufacturer's protocol. The deprotected oligonucleotides were purified by high-performance liquid chromatography. The purity of ODNs exceeded 98% as estimated by electrophoresis in a 20% denaturing polyacrylamide gel after staining with the Stains-All dye (Sigma-Aldrich). Concentrations of the oligonucleotides were determined by means of A260. The ODN duplexes were prepared by annealing of modified and complementary strands in the 1![[thin space (1/6-em)]](https://www.rsc.org/images/entities/char_2009.gif) :
:![[thin space (1/6-em)]](https://www.rsc.org/images/entities/char_2009.gif) 1 molar ratio in the reaction buffer (50 mM Tris-HCl, pH 6.8, 50 mM KCl, 1 mM EDTA, 1 mM DTT, 5 mM MgCl2, and 7% glycerol).
1 molar ratio in the reaction buffer (50 mM Tris-HCl, pH 6.8, 50 mM KCl, 1 mM EDTA, 1 mM DTT, 5 mM MgCl2, and 7% glycerol).
Stopped-flow fluorescence measurements
Stopped-flow measurements with fluorescence detection were carried out mostly as described previously.33–35 In brief, we used a SX.18MV stopped-flow spectrometer (Applied Photophysics Ltd, UK) equipped with a 150 W Xe arc lamp and an optical cell with 2 mm path length. The dead time of the instrument is 1.4 ms. The fluorescence of Trp was excited at λex = 290 nm and monitored at λem > 320 nm as transmitted by the filter WG-320 (Schott, Mainz, Germany). If 6-carboxyfluorescein (FAM) residue was present in the ODN duplex (FAM-F-substrate), the wavelength λex = 494 nm was used to excite these residues, and their emission was analyzed at λem > 515 nm (Schott filter OG-515). All experiments were conducted at 25 °C in the buffer consisting of 50 mM Tris-HCl, pH 6.8, 50 mM KCl, 1.0 mM EDTA, 1.0 mM DDT, 5.0 mM MeCl2 (where Me is Mg, Mn, Ni, Zn, Ca, or Cu), and 7% glycerol (v/v).APE1 was placed in one instrument's syringe and rapidly mixed in the reaction chamber with the substrate from another syringe. The concentration of APE1 in all the experiments was 1.0 μM, while concentrations of F-substrates were varied from 0.25 to 2.5 μM. The reported concentrations of reactants are those in the reaction chamber after mixing. Typically, each trace shown in the figures is the average of four or more fluorescence traces recorded in individual experiments. In the figures, if necessary for better presentation, the curves were manually moved apart. This procedure does not affect the results of fitting because the background fluorescence is fitted separately for each curve.
Conformational changes in the protein were monitored by changes in Trp fluorescence intensity. The FAM-F-substrate modified at 5′ termini with the dye-quencher pair FAM/BHQ1 (Table 1) was used for Förster resonance energy transfer (FRET) measurements. FRET analysis revealed changes in the distance between the dye and quencher in the processes of DNA helix distortion during formation of the APE1–DNA specific complex and F-site cleavage reaction.
PAGE time-course experiments
Single-turnover APE1 endonuclease assays were performed in the standard reaction buffer. The reaction solution contained 1.0 μM APE1 and 1.0 μM F-substrate. The solutions of APE1 and F-substrates were initially incubated with 1.0 mM EDTA (5 minutes) to chelate any divalent metal ions and to obtain catalytically inactive apo-APE1. After that, each solution was incubated (10 min) with 5.0 mM MeCl2 (where Me is Mg, Mn, Ni, Zn, Ca, or Cu). Cleavage of the F-substrate was initiated by addition of APE1. Aliquots (2 μL) of the reaction mixture were taken at certain time intervals, immediately quenched with 3 μL of a gel-loading dye containing 7 M urea and 50 mM EDTA, and loaded on a 20% (w/v) polyacrylamide/7 M urea gel. Disappearance of the substrate and formation of the product were analyzed by autoradiography and quantified by scanning densitometry in the Gel-Pro Analyzer software, v. 4.0 (Media Cybernetics, USA).The kinetic traces of product accumulation were fitted to the single exponential curve using the Origin software (Originlab Corp., USA; eqn (1)).
| [product] = A × [1 − exp(−kPAGEobst)] | (1) |
Influence of different concentrations of Mg2+ on stopped-flow kinetics
Trp fluorescence stopped-flow kinetic traces at different concentrations of Mg2+ were fitted to eqn (2) or (3) by a nonlinear regression procedure in the Origin software (OriginLab Corp., USA):| F = F0 + F1 × exp(−kTrp,FAM1t) + F2 × [1 − exp(−kTrp,FAMcatt)] | (2) |
| F = F0 + F1 × exp(−kTrp1t) + F2 × exp(−kTrp2t) + F3 × [1 − exp(−kTrpcatt)] | (3) |
The observed rate constants (kTrpi) for each particular concentration of a metal ion were determined by fitting of the individual time courses.
The dependence of observed rate constants kTrp2 on concentration of Mg2+ was fitted to eqn (4):
 | (4) |
 is the apparent dissociation constant of APE1 with the Mg2+ ion.
Coefficient B of APE1 activation by Mg2+ was obtained by plotting the rate constants (kTrpcat and kPAGEobs) against the concentration of Mg2+ and fitting the data to eqn (5):
| kTrpcat = kPAGEobs = B × [Mg2+] | (5) |
Global fitting of stopped-flow data
The sets of kinetic curves obtained at different concentrations of the reactants in the absence or presence of 5 mM Mg2+, Ca2+, Ni2+, Mn2+, or Zn2+ were analyzed in the DynaFit software (BioKin, Pullman, WA)36 as described previously.37–42This approach is based on fluorescence intensity variation in the course of the reaction due to the sequential formation and further transformation of the DNA–enzyme complex and its conformers. The concentrations of each species in the mechanisms are described by a set of differential equations according to Schemes 1–3 (see Results). The stopped-flow fluorescence traces were directly fitted to the fluorescence intensity at any reaction time point as the sum of the background fluorescence and fluorescence intensity values of each intermediate complex formed by the enzyme with DNA:
 | (6) |
The software performs numerical integration of a system of ordinary differential equations with subsequent nonlinear least-squares regression analysis. In the evaluated mechanisms, except for the first bimolecular step, all other reactions are first-order. In the fits, we optimized all relevant rate constants for the forward and reverse reactions as well as the specific molar response factors for all intermediate complexes. During the data processing, the kinetic information was obtained from temporal behavior of the fluorescence intensity, not from the amplitudes of the specific signal contributions. The response factors for different conformers resulting from the fits were not used for determination of the equilibrium constants but rather provided additional information on the fluorescence intensity variations in different complexes and conformers.
Circular dichroism (CD) spectra
These spectra were recorded on a Jasco J-600 spectropolarimeter (Jacso, Japan), at 5 °C in quartz cells with 1 cm path length. The concentration of APE1 or the F13-substrate in the cell was 1.0 μM. The experiments were carried out in the buffer consisting of 50 mM Tris-HCl pH 6.8, 50 mM KCl, 1.0 mM EDTA, 1.0 mM DDT, and 7% glycerol (v/v). Concentration of MeCl2, where Me is Mg, Mn, Ni, Zn, Ca, or Cu, was 5.0 mM. The spectra were recorded at the bandwidth 1.0 nm and resolution 1.0 nm with a scan speed of 50 nm min−1. The scans were accumulated and automatically averaged.Molecular modeling
The X-ray data obtained for the complexes of APE1 with DNA (PDB ID 1DE8 and 4IEM, respectively) served as models of atomic structures of protein–DNA complexes with and without a Mg2+ ion in the active site.Inspection of these structures revealed that structure 1DE8 represents an example of the catalytically competent protein–DNA complex. Structure 4IEM represents the specific protein–DNA complex with the excised phosphodiester bond on the 5′ side of the F-site. The contact areas ΔMS of the protein–DNA interface were calculated by subtracting the molecular surface (MS) confining the solvent-excluded volume43 of the isolated protein and the DNA from that of the protein–DNA complexes, ΔMS = MS (protein/DNA complex) − MS (protein) − MS (DNA), where the buried MS is negative. The MS was calculated by the SIMS method.44 The free energy of the cavity formation in water in the process of desolvation has entropic nature and it was approximated by the linear equation ΔGcav = γΔMS.43 For evaluation of the entropy loss, γ was assumed to be 37 cal mol−1 Å−2, which approximates the entropy of desolvation of nonpolar species in water.45
Results and discussion
Effects of Mg2+ ions on DNA binding and catalysis
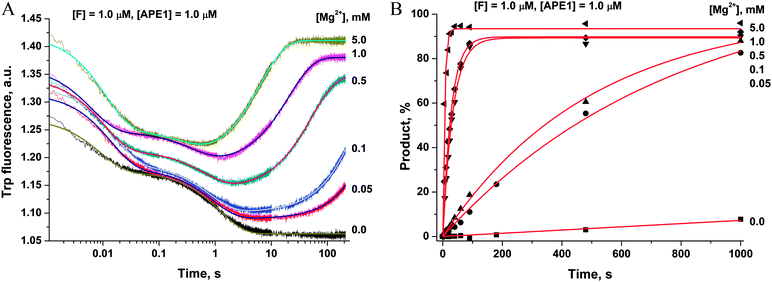
To ascertain the efficacy of APE1 binding to an F-site-containing DNA duplex at different concentrations of Mg2+, the kinetics of enzyme–substrate complex formation and catalysis were studied by the stopped-flow method. The Trp fluorescence traces of APE1's reaction with the F13-substrate comprised the characteristic phases (Fig. 3A), which were assigned to DNA-binding steps and catalysis in our previous reports.28–30 The initial double-phase decrease in the Trp fluorescence intensity could be attributed to the process of formation of a specific enzyme–substrate complex that is responsible for catalytic hydrolysis of the internucleotide phosphodiester bond. After the catalytic reaction, the enzyme–product complex dissociates, increasing the fluorescence intensity. The interaction of APE1 with the F13-substrate in the presence of any concentration of Mg2+ caused an increase in Trp fluorescence intensity at the ends of kinetic traces. Meanwhile, the kinetic trace obtained for interaction of apo-APE1 with the F13-substrate in the absence of Mg2+ ions did not contain the final increase phase, indicating the lack of the catalytic step. Indeed, PAGE analysis of product accumulation showed that the rate of the catalytic reaction was strongly dependent on the concentration of Mg2+ (Fig. 3B).The Trp fluorescence kinetic traces obtained in the presence or absence of Mg2+ ions were fitted to a triple-exponential equation ([Mg2+] = 0.05–5.0 mM) or a double-exponential ([Mg2+] = 0.0 mM) equation (eqn (3) and (2)), respectively. To further elucidate the nature of the two initial phases of the fluorescence decrease, the values of the observed rate constants at different Mg2+ concentrations were plotted as shown in Fig. 4A and B. As follows from Fig. 4A, the observed rate constant kTrp1 of the first fast phase is independent on Mg2+ concentration. Our previous studies28,29 suggested that the fast initial phase corresponds to nonspecific random DNA binding. Therefore, the present data indicate that Mg2+ ions do not participate in the formation of the nonspecific enzyme–DNA complex.
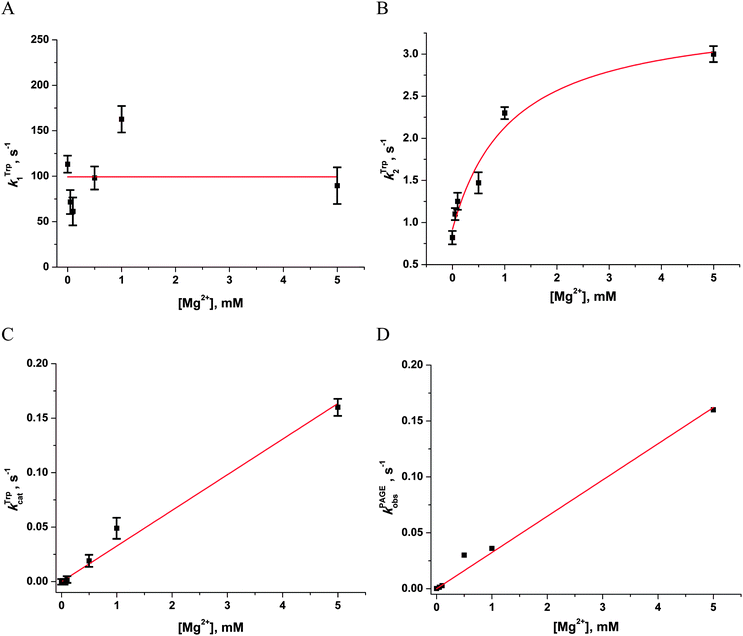 | ||
| Fig. 4 Dependences of the observed rate constants kTrp1 (A), kTrp2 (B), kTrpcat (C), kPAGEobs (D) on Mg2+ concentration. Data presented in (A), (C) and (D) were fitted to a linear function, whereas the data presented in (B) were fitted to a hyperbolic equation (eqn (4)). | ||
The observed rate constant kTrp2 of the second phase showed a hyperbolic type of dependence on the Mg2+ concentration. Most probably, this step corresponds to formation of the catalytic complex (E·S)2, and Mg2+ ions are required for this conversion. The dependence of kTrp2 on Mg2+ concentration was fitted to eqn (4) as shown in Fig. 4B. The rate constant of the second step is increased approximately threefold from 0 to 5.0 mM Mg2+ (k20 = 0.9 ± 0.1 s−1 at [Mg2+] = 0.0 mM, k2max = 2.6 ± 0.4 s−1 at [Mg2+] ≥ 5.0 mM). The apparent dissociation constant for the complex of Mg2+ with APE1  is equal to 1.1 ± 0.5 mM.
The observed rate constants kTrpcat of the third phases in the Trp fluorescence traces correspond to the catalytic reaction. The catalytic step was also independently characterized by direct analysis of product accumulation in PAGE time-course experiments. The rate constants of product accumulation measured by PAGE analyses, kPAGEobs, were obtained by a single-exponential fitting of kinetic traces to eqn (1), as shown in Fig. 3B. The rate constants kTrpcat and kPAGEobs were plotted as a function of [Mg2+] (Fig. 4C and D, respectively). Both dependences were linear in relation to [Mg2+] and were fitted to eqn (5) to calculate coefficient B of APE1 activation by Mg2+. We found that B = 0.033 ± 0.001 M−1 s−1 for Trp fluorescence and PAGE analyses within the analyzed range of Mg2+ concentrations.
Thus, our results lead to the conclusion that activation of APE1 by Mg2+ ions is associated with the specific interactions of divalent metal ions in the active site of the enzyme. These processes not only accelerate formation of the catalytic complex but also provide the effective proceeding of the catalytic reaction of the phosphodiester bond hydrolysis.
Influence of K+ concentration on association and catalytic steps of the interaction of APE1 with DNA
It seems possible that the mechanism by which Mg2+ ions increase the rate of DNA substrate binding involves an electrostatic interaction between Mg2+ ions, enzyme and DNA. To determine whether the observed rate enhancements by Mg2+ were the result of nonspecific electrostatic effects, we added various concentrations of monovalent cations (K+) to reaction mixtures containing 5.0 mM Mg2+ (Fig. 5A).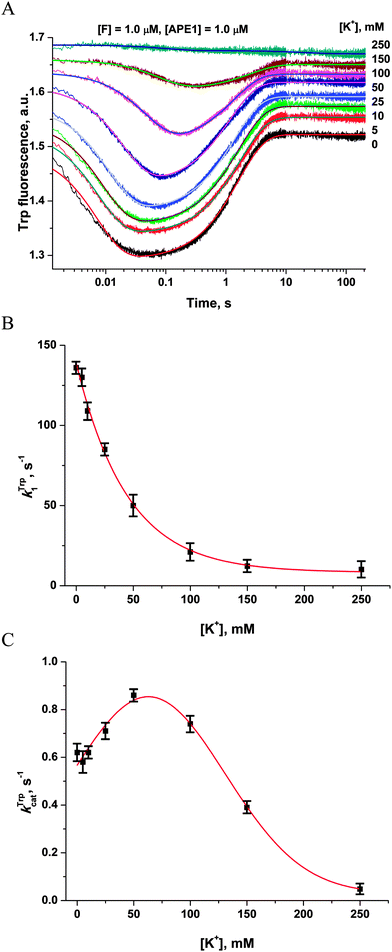 | ||
| Fig. 5 Influence of monovalent cations (K+) on APE1 activity. (A) Stopped-flow Trp fluorescence kinetic traces. One syringe contained APE1 (1.0 μM) that had been incubated with various concentrations of KCl. The other syringe contained the F17-substrate (1.0 μM) and an equivalent concentration of KCl. The final concentration of KCl is shown on the right. (B and C) Values of kTrp1 (B) and kTrpcat (C) determined by double-exponential fitting (eqn (2)) of kinetic traces (A). The smoothed curves (B) and (C) are presented only to highlight the trends and do not represent theoretical fits to the data. | ||
The observed rate constant kTrp1 of F17-substrate binding by APE1 decreased 13.5-fold as the salt concentration was increased from 0 to 250 mM K+ (136.5 ± 0.8 s−1 and 10.1 ± 0.4 s−1; Fig. 5B). These data indicate that the increase in ionic strength leads to nonspecific disruption of contacts between the enzyme and the DNA, thereby inhibiting formation of the complex. It is noteworthy that the observed rate constant of the catalytic step (kTrpcat) slightly increased from 0.62 ± 0.01 s−1 to 0.86 ± 0.01 s−1 as the salt concentration was increased from 0 to 50 mM. Subsequent increases in the salt concentration led to an 18-fold decrease in kTrpcat down to 0.048 ± 0.003 s−1 at 250 mM K+ (Fig. 5C). Thus, our data reveal a significant contribution of electrostatic interactions during the binding of DNA to APE1 and catalytic-complex formation. Nevertheless, the enhancement of rates of catalytic-complex (E·S)2 formation and the catalytic reaction after the increase in Mg2+ concentration is the result of the specific role of Mg2+ as a cofactor of the enzymatic process, which is observed at much lower concentrations of this cation.
Effects of a metal's nature on DNA binding and catalysis
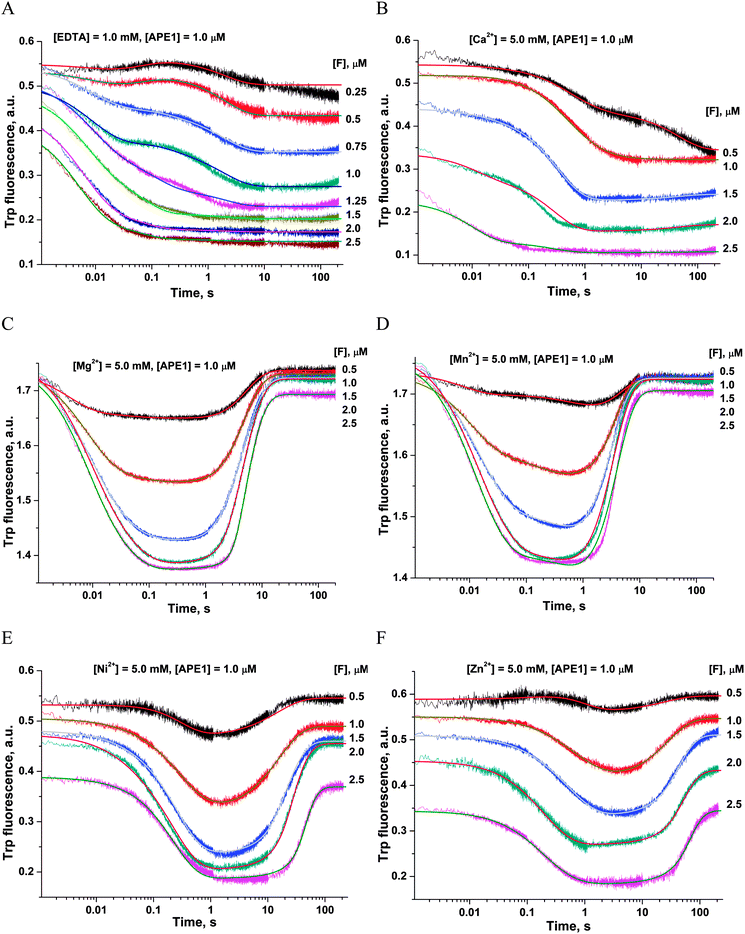
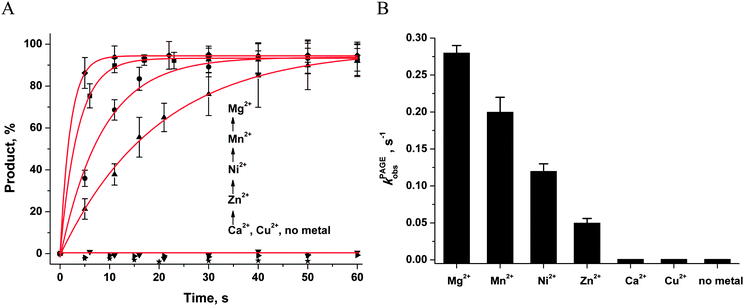
First of all, the catalytic activity of APE1 was abrogated by treatment with EDTA, which causes formation of apo-protein without any metal ions in the active site. We examined the interaction of apo-APE1 with the F13-substrate to record the conformational changes of the protein during binding of DNA (Fig. 6A). The initial phase of the fluorescence decrease was well resolved in the kinetic traces at all DNA concentrations. The subsequent increase phase was well resolved at low DNA concentrations (0.25–1.0 μM) and was followed by the second phase of a decrease in the fluorescence intensity. The rate constants of individual reaction steps (Table 2) were extracted from global fitting of the fluorescence data to the three-step binding model (Scheme 2). The absence of the increase phase at the end of Trp fluorescence kinetic traces as well as the lack of product accumulation in the PAGE analysis (Fig. 7) reveal complete inactivation of APE1 by the EDTA treatment.
| Constants | Me2+ | |||||
|---|---|---|---|---|---|---|
| Mg2+ | Mn2+ | Ni2+ | Zn2+ | Ca2+ | No metal | |
| a K i = k−i/ki. b ND, not detectable. | ||||||
| k 1, M−1 s−1 | (90 ± 10) × 106 | (40 ± 7) × 106 | (50 ± 15) × 106 | (35 ± 8) × 106 | (70 ± 20) × 106 | (100 ± 10) × 106 |
| k −1, s−1 | 10.1 ± 4.3 | 28 ± 12 | 45 ± 17 | 75 ± 20 | 50 ± 16 | 32 ± 15 |
| K 1, M | (0.11 ± 0.05) × 10−6 | (0.7 ± 0.2) × 10−6 | (0.9 ± 0.4) × 10−6 | (2.1 ± 0.7) × 10−6 | (0.7 ± 0.3) × 10−6 | (0.3 ± 0.1) × 10−6 |
| k 2, s−1 | 43.1 ± 8.5 | 34.8 ± 12.7 | 5.7 ± 0.6 | 8.2 ± 0.9 | 9.4 ± 2.4 | 14 ± 6 |
| k −2, s−1 | 7.1 ± 1.6 | 2.6 ± 1.0 | 0.03 ± 0.02 | 0.04 ± 0.03 | (1.9 ± 1.0) × 10−3 | 22 ± 12 |
| K 2 | 0.16 ± 0.05 | 0.075 ± 0.04 | (5.3 ± 3.5) × 10−3 | (4.9 ± 3.7) × 10−3 | (2.0 ± 1.1) × 10-4 | 1.6 ± 1.1 |
| k 3, s−1 | 6.3 ± 1.9 | |||||
| k −3, s−1 | (1.2 ± 0.8) × 10−2 | |||||
| K 3 | (1.9 ± 1.3) × 10−3 | |||||
| k cat, s−1 | 0.3 ± 0.1 | 0.3 ± 0.1 | 0.055 ± 0.007 | 0.041 ± 0.004 | ||
| k PAGEobs, s−1 | 0.28 ± 0.01 | 0.19 ± 0.07 | 0.11 ± 0.01 | 0.05 ± 0.01 | NDb | ND |
| K p, M | (7.2 ± 0.4) × 10−6 | (8.4 ± 0.3) × 10−6 | (6.6 ± 1.7) × 10−6 | (4.5 ± 1.3) × 10−6 | ||
 | ||
| Scheme 2 where E is APE1, S is the substrate, (E·S)i are enzyme–substrate complexes, and ki and k−i are the rate constants of equilibrium steps. | ||
In the presence of Ca2+ ions (in comparison with the absence of metals) the transient increase phase disappears (Fig. 6B) and kinetic traces of DNA binding were fitted best to the two-step binding model (Scheme 3).
 | ||
| Scheme 3 where E is APE1, S is the substrate, (E·S)i are enzyme–substrate complexes, and ki and k−i, are the rate constants of equilibrium steps. | ||
In the presence of Cu2+ ions in the reaction mixture, APE1 completely loses the DNA binding ability; this situation leads to the absence of any Trp fluorescence changes (data not shown). This inhibitory effect is probably associated with strong interactions of Cu2+ ions with DNA bases and phosphate groups.46
As shown in Fig. 6C–F, the fluorescence traces, which characterize the interaction of APE1 with the F13-substrate in the presence of Mg2+, Ni2+, Mn2+ and Zn2+ ions, have the similar shapes. An initial decrease in fluorescence intensity during DNA binding and formation of the catalytic complex is followed by an increase in fluorescence intensity at the time points more than 10 s, indicating a release of the enzyme from the complex with the reaction product. It should be noted that in the presence of different metal ions, the DNA binding as well as the catalytic reaction and the dissociation of the enzyme–product complex proceeded in separate time ranges. The minimal kinetic scheme (Scheme 1) describing the observed changes in Trp fluorescence intensity contains two initial equilibrium steps that characterize substrate binding followed by an irreversible chemical step and the next equilibrium step for the product release. The rate constants obtained by global fitting are listed in Table 2.
Values of the constants obtained by the global fitting of data to Scheme 1 showed that the first DNA-binding steps have similar K1 values (0.3 × 10⁻⁶ M and 0.11 × 10⁻⁶ M) for apo-APE1 and APE1 in the presence of Mg2+ ions (Table 2). These data are in agreement with the observed independence of the binding rate constant kTrp1 (determined here) on the Mg2+ concentration (Fig. 4A). The above data are also in line with the conclusion that incorporation of a Mg2+ ion into the active site of the enzyme does not affect the initial DNA binding. In comparison with our data on Mg2+ ions, the rate constants of the forward reaction k1 were approximately twofold lower for the Ni2+, Mn2+ and Zn2+ ions, and the rate constants of the reverse reaction k−1 were at least threefold higher for ions Ni2+, Mn2+, Ca2+ and Zn2+. Therefore, K1 values that were obtained for these metal ions are at least 6.4-fold higher (0.7–2.1 × 10⁻⁶ M) than K1 obtained in the presence of Mg2+ (0.11 × 10⁻⁶ M). These data support the idea that the initial nonspecific DNA binding by APE1 is slightly inhibited by ions Ni2+, Mn2+, Ca2+ or Zn2+, probably due to their ability to directly bind DNA and induce partial disordering of the backbone, base stacking, and pairing.46 Moreover, the increase in the value of the forward rate constant k1 correlates with the affinity of these ions to DNA bases: Cu2+ ≫ Zn2+ > Mn2+ > Ni2+ > Ca2+ > Mg2+.46,47 It is known that metal ions with the strongest affinity to nucleobases apparently perturb the hydrogen bonding between base pairs, thus destabilizing DNA. At the same time, the cations with higher binding specificity to the phosphates stabilize DNA, apparently through neutralization of the charges of the sugar–phosphate backbone.
The second DNA binding step in Scheme 1 characterizes the formation of the catalytically competent enzyme–DNA complex. The specific contacts with a metal ion placed in the active site should form during this step. It is worth noting that the rate constant of the forward reaction k2 was at least 4.6-fold higher for the natural Mg2+ ion as compared to other metals, excepting Mn2+ (Table 2). The rate constant of the reverse reaction k−2 as well as the equilibrium dissociation constant K2 were the highest in the case of apo-APE1, thus indicating that a metal ion is required for stabilization of catalytic complex (E·S)2.
Surrogate metal ions stabilize the (E·S)2 complex better than the Mg2+ ion can. The value of the K2 constant was at least 30-fold higher for the Mg2+ ion in comparison with Ca2+, Zn2+, and Ni2+. It is noteworthy that the formation of catalytic complex (E·S)2 in the presence of natural Mg2+ or surrogate Mn2+ ions is characterized by sufficiently similar rate and equilibrium constants (Table 2).
The equilibrium constant Kp of the last step in Scheme 1 was independent of the nature of a metal ion (Table 2), indicating that divalent metal ions do not affect the product release from the complex with the enzyme.
The ability of divalent metal ions to get incorporated into the active site of the enzyme can depend on their ionic radii. Effective ionic radii of metal ions (coordination number = 6) are 1.0 Å for Ca2+, 0.74 Å for Zn2+, 0.73 Å for Cu2+, 0.72 Å for Mg2+, 0.69 Å for Ni2+, and 0.67–0.83 Å for Mn2+.48 The largest ion (Ca2+) apparently does not create a correct binding site and cannot ensure normal catalytic activity (Fig. 6B and 7). The Trp fluorescence data (Fig. 6) and direct detection of product formation by PAGE (Fig. 7) allow us to rank the efficiency of metal ions in catalysis as Mg2+ > Mn2+ > Ni2+ > Zn2+; this result is in accord with earlier studies.49,50
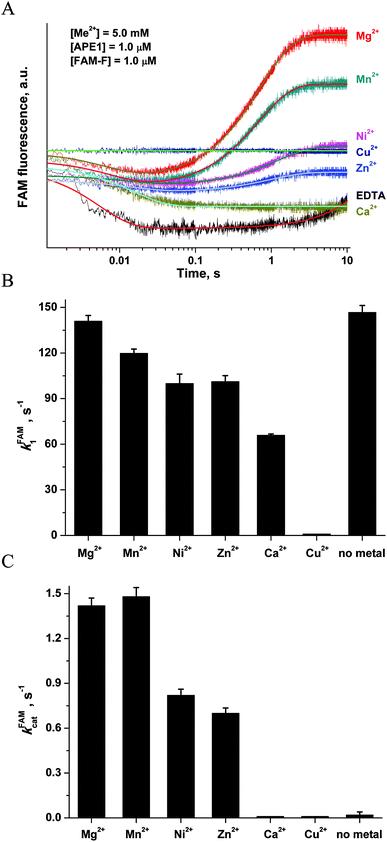 | ||
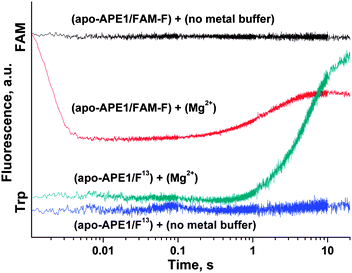
| Fig. 8 (A) FAM/BHQ1 FRET traces of the interaction of APE1 with the FAM-F-substrate. One syringe contained APE1 (1.0 μM) that was preincubated for 5 min with MeCl2 (5.0 mM). The other syringe contained the FAM-F-substrate (1.0 μM) preincubated for 5 min with MeCl2 (5.0 mM). Jagged traces represent experimental data; smooth curves are the results of fitting of kinetic traces to eqn (2). (B) Dependence of the kFAM1 value on the nature of metal ions. (C) Dependence of the kFAMcat value on the nature of metal ions. The values of kFAM1 and kFAMcat were determined by fitting the kinetic traces to eqn (2). | ||
The kinetic curves were fitted to a double-exponential equation (eqn (2)). It should be noted that the rate constants of complex formation, kFAM1, in the case of apo-APE1 and in the presence of Mg2+ ions (Fig. 8B) were similar, whereas the surrogate metals caused a slight decrease in the rate constant of catalytic-complex formation. The effect followed in the order: Mg2+ > Mn2+ > Ni2+ ≈ Zn2+ > Ca2+. The catalytic rate constant kFAMcat was decreased in accordance with the following order: Mg2+ ≈ Mn2+ > Ni2+ ≈ Zn2+ > Ca2+, Cu2+, no metal (Fig. 8C).
At the same moment, penetration of the Mg2+ ion into the active site of apo-APE1 in complex with the FAM-F-substrate leads to a fast initial decrease (within 5 ms) in the FAM fluorescence intensity. This finding indicates that the binding of the Mg2+ ion to the enzyme proceeds rapidly and induces additional duplex bending, probably, via formation of the direct Mg2+ bridges between the 5′-phosphate group of the F-site and Asp-308, Glu-96, and Asp-70 side groups. The hydrolysis of the 5′-phosphodiester bond of the F-site leads to a product release causing the increase in FAM fluorescence intensity in the time range 0.2–10.0 s. The phase of the FAM fluorescence increase substantially coincides with the phase of the increase in Trp fluorescence, indicating that both fluorescence changes correspond to the same process of dissociation of the enzyme–product complex.
Molecular modeling of the enzyme–DNA complex
The formation of the enzyme–substrate complexes should result in the formation of specific contacts between the enzyme and DNA substrate and the increase of total contact area between two biopolymers. The Mg2+ ion, which is required for coordination of the phosphate group in the active site and for the display of activity in the catalytic reaction, should provide additional stabilization of the enzyme–substrate complex. To estimate the effect of the Mg2+ ion on the stability of the enzyme–substrate complex, we calculated the molecular contact area and the total energy of the binding of DNA to APE1 in the absence and presence of a metal ion in the active site. For these purposes, crystal structures of the APE1–DNA complexes (PDB ID: 1DE8 and 4IEM) have been analyzed. The 1DE8 structure was used as a model of the complex of APE1 with DNA (substrate) in the absence of metal ions in the active site. The 4IEM structure corresponded to the complex of APE1 with the DNA product containing the Mg2+ ion. It should be noted that the DNA duplexes in both complexes had the same context. Using SIMS method44 it was calculated that the contact area (ΔMS = 1382.5 Å2) of APE1 with the DNA (substrate) in the absence of metal ions was at 141.4 Å2, i.e., lower than the contact area of APE1 with the DNA product in the presence of Mg2+ ion (ΔMS = 1523.9 Å2). These data indicate that the complex of the enzyme with a reaction product in the presence of a Mg2+ ion is energetically more favorable (the difference between the total binding energy of 5.4 kcal mol−1) and more stable than the complex of APE1 with the DNA (substrate) in the absence of metal ions.Conclusions
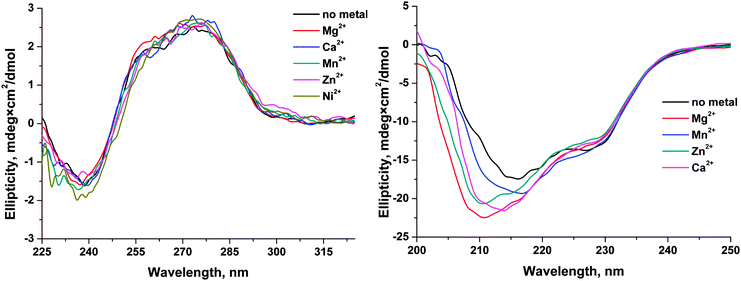
The effects of monovalent (K+) and divalent (Mg2+, Mn2+, Ca2+, Zn2+, Cu2+, and Ni2+) metal ions on the activity of human apurinic/apyrimidinic endonuclease 1 (APE1) were analyzed by detection of Trp and FAM fluorescence intensities to determine the conformational changes of enzyme and specific DNA substrates, respectively, during their interaction. Analysis of the dependence of the observed rate constants on Mg2+ concentration clearly showed that Mg2+ ions have no effect on the initial formation of the enzyme–DNA complex. In contrast, the formation of the catalytic complex as well as the rate of the catalytic reaction depends on the concentration of Mg2+. On the other hand, monovalent ion (K+) significantly reduces the rate of the initial enzyme–DNA complex formation, presumably, due to a nonspecific charge-shielding effect. It was shown that the nature of a divalent metal ion influenced both on the processes of DNA binding and on the catalytic hydrolysis of the 5′-phosphodiester bond. Cu2+ ions completely inhibited the binding of DNA by APE1, probably due to strong binding of Cu2+ to DNA bases and to the sugar–phosphate backbone. In the case of Ca2+ ion, possibly, its large ionic radius does not allow this ion to be properly situated in the active site and thereby abrogates the catalytic activity of the enzyme and decreases the DNA-binding ability. The other tested ions reduce enzymatic activity of APE1 in the order Mg2+ > Mn2+ > Ni2+ > Zn2+. Moreover, CD analysis of APE1 revealed that these metal ions induce a structural rearrangement of the enzyme. Calculations of the molecular contact area and of the total energy of DNA binding by APE1 in the absence or presence of a Mg2+ ion in the active site show that Mg2+ ion stabilizes the enzyme–DNA complex and increases the catalytic activity. Therefore, these metal ions have multiple effects both on the ability to direct DNA binding and on the structure of the enzyme.Abbreviations
| APE1 | AP endonuclease |
| AP-site | Apurinic/apyrimidinic site |
| F-site | (3-Hydroxytetrahydrofuran-2-yl)methyl phosphate |
| ODN | Oligodeoxyribonucleotide |
| PAGE | Polyacrylamide gel electrophoresis |
| BER | Base excision repair |
| FRET | Förster resonance energy transfer |
Acknowledgements
This research was supported by the Russian Academy of Sciences “Molecular & Cell Biology” Program [O. S. F. grant no. 6.11 (0309-2015-0025)]; grants from the Russian Foundation for Basic Research [O. S. F. 16-04-00037, A. A. K. 15-04-00467 and N. A. K. 15-34-20121] and Russian Ministry of Education and Science [SS-7564.2016.4]. Part of the work with stopped-flow experiments was specifically funded by Russian Science Foundation [grant no. 14-14-00063] to N. A. K.References
- E. C. Friedberg, G. C. Walker, W. Siede, R. D. Wood, R. A. Schultz and T. Ellenberger, DNA Repair and Mutagenesis, ASM Press, Washington, 2006 Search PubMed.
- T. Lindahl and B. Nyberg, Biochemistry, 1972, 11, 3610–3618 CrossRef CAS PubMed.
- D. M. Wilson III and D. Barsky, Mutat. Res., 2001, 485, 283–307 Search PubMed.
- L. A. Loeb and B. D. Preston, Annu. Rev. Genet., 1986, 20, 201–230 CrossRef CAS PubMed.
- R. M. Schaaper, T. A. Kunkel and L. A. Loeb, Proc. Natl. Acad. Sci. U. S. A., 1983, 80, 487–491 CrossRef CAS.
- C. D. Mol, S. S. Parikh, C. D. Putnam, T. P. Lo and J. A. Tainer, Annu. Rev. Biophys. Biomol. Struct., 1999, 28, 101–128 CrossRef CAS PubMed.
- S. S. David and S. D. Williams, Chem. Rev., 1998, 98, 1221–1261 CrossRef CAS PubMed.
- B. Demple and J.-S. Sung, DNA Repair, 2005, 4, 1442–1449 CrossRef CAS PubMed.
- N. S. Dyrkheeva, S. N. Khodyreva and O. I. Lavrik, Mol. Biol., 2007, 41, 450–466 CrossRef CAS.
- M. Li and D. M. Wilson 3rd, Antioxid. Redox Signaling, 2014, 20, 678–707 CrossRef CAS PubMed.
- H. Fung and B. Demple, Mol. Cell, 2005, 17, 463–470 CrossRef CAS PubMed.
- G. Kaur, R. P. Cholia, A. K. Mantha and R. Kumar, J. Med. Chem., 2014, 57, 10241–10256 CrossRef CAS PubMed.
- N. A. Kuznetsov, M. S. Kupryushkin, T. V. Abramova, A. A. Kuznetsova, A. D. Miroshnikova, D. A. Stetsenko, D. V. Pyshnyi and O. S. Fedorova, Mol. BioSyst., 2015, 12, 67–75 RSC.
- M. A. Gorman, S. Morera, D. G. Rothwell, E. de La Fortelle, C. D. Mol, J. A. Tainer, I. D. Hickson and P. S. Freemont, EMBO J., 1997, 16, 6548–6558 CrossRef CAS PubMed.
- P. T. Beernink, B. W. Segelke, M. Z. Hadi, J. P. Erzberger, D. M. Wilson 3rd and B. Rupp, J. Mol. Biol., 2001, 307, 1023–1034 CrossRef CAS PubMed.
- B. A. Manvilla, E. Pozharski, E. A. Toth and A. C. Drohat, Acta Crystallogr., Sect. D: Biol. Crystallogr., 2013, 69, 2555–2562 CrossRef CAS PubMed.
- C. D. Mol, T. Izumi, S. Mitra and J. A. Tainer, Nature, 2000, 403, 451–456 CrossRef CAS PubMed.
- C. D. Mol, D. J. Hosfield and J. A. Tainer, Mutat. Res., 2000, 460, 211–229 CAS.
- S. E. Tsutakawa, D. S. Shin, C. D. Mol, T. Izumi, A. S. Arvai, A. K. Mantha, B. Szczesny, I. N. Ivanov, D. J. Hosfield, B. Maiti, M. E. Pique, K. A. Frankel, K. Hitomi, R. P. Cunningham, S. Mitra and J. A. Tainer, J. Biol. Chem., 2013, 288, 8445–8455 CrossRef CAS PubMed.
- S. T. Mundle, M. H. Fattal, L. F. Melo, J. D. Coriolan, N. E. O'Regan and P. R. Strauss, DNA Repair, 2004, 3, 1447–1455 CrossRef CAS PubMed.
- S. T. Mundle, J. C. Delaney, J. M. Essigmann and P. R. Strauss, Biochemistry, 2009, 48, 19–26 CrossRef CAS PubMed.
- A. S. Lipton, R. W. Heck, S. Primak, D. R. McNeill, D. M. Wilson 3rd and P. D. Ellis, J. Am. Chem. Soc., 2008, 130, 9332–9341 CrossRef CAS PubMed.
- N. Oezguen, C. H. Schein, S. R. Peddi, T. D. Power, T. Izumi and W. Braun, Proteins, 2007, 68, 313–323 CrossRef CAS PubMed.
- Y. Masuda, R. A. Bennett and B. Demple, J. Biol. Chem., 1998, 273, 30360–30365 CrossRef CAS PubMed.
- J. P. Erzberger and D. M. Wilson 3rd, J. Mol. Biol., 1999, 290, 447–457 CrossRef CAS PubMed.
- H. He, Q. Chen and M. M. Georgiadis, Biochemistry, 2014, 53, 6520–6529 CrossRef CAS PubMed.
- B. D. Freudenthal, W. A. Beard, M. J. Cuneo, N. S. Dyrkheeva and S. H. Wilson, Nat. Struct. Mol. Biol., 2015, 22, 924–931 CAS.
- N. A. Timofeyeva, V. V. Koval, D. G. Knorre, D. O. Zharkov, M. K. Saparbaev, A. A. Ishchenko and O. S. Fedorova, J. Biomol. Struct. Dyn., 2009, 26, 637–652 CAS.
- L. Y. Kanazhevskaya, V. V. Koval, D. O. Zharkov, P. R. Strauss and O. S. Fedorova, Biochemistry, 2010, 49, 6451–6461 CrossRef CAS PubMed.
- L. Y. Kanazhevskaya, V. V. Koval, Y. N. Vorobjev and O. S. Fedorova, Biochemistry, 2012, 51, 1306–1321 CrossRef CAS PubMed.
- A. A. Kuznetsova, N. A. Kuznetsov, A. A. Ishchenko, M. K. Saparbaev and O. S. Fedorova, Biochim. Biophys. Acta, 2014, 1840, 3042–3051 CrossRef CAS PubMed.
- M. M. Bradford, Anal. Biochem., 1976, 72, 248–254 CrossRef CAS PubMed.
- N. A. Kuznetsov, V. V. Koval, D. O. Zharkov, G. A. Nevinsky, K. T. Douglas and O. S. Fedorova, Nucleic Acids Res., 2005, 33, 3919–3931 CrossRef CAS PubMed.
- N. A. Kuznetsov, V. V. Koval, G. A. Nevinsky, K. T. Douglas, D. O. Zharkov and O. S. Fedorova, J. Biol. Chem., 2007, 282, 1029–1038 CrossRef CAS PubMed.
- A. A. Kuznetsova, N. A. Kuznetsov, A. A. Ishchenko, M. K. Saparbaev and O. S. Fedorova, Biochim. Biophys. Acta, 2014, 1840, 387–395 CrossRef CAS PubMed.
- P. Kuzmic, Anal. Biochem., 1996, 237, 260–273 CrossRef CAS PubMed.
- N. A. Kuznetsov, Y. N. Vorobjev, L. N. Krasnoperov and O. S. Fedorova, Nucleic Acids Res., 2012, 40, 7384–7392 CrossRef CAS PubMed.
- N. A. Kuznetsov, V. V. Koval, D. O. Zharkov and O. S. Fedorova, DNA Repair, 2012, 11, 884–891 CrossRef CAS PubMed.
- N. A. Kuznetsov, D. O. Zharkov, V. V. Koval, M. Buckle and O. S. Fedorova, Biochemistry, 2009, 48, 11335–11343 CrossRef CAS PubMed.
- V. V. Koval, N. A. Kuznetsov, A. A. Ishchenko, M. K. Saparbaev and O. S. Fedorova, Mutat. Res., 2010, 685, 3–10 CrossRef CAS PubMed.
- N. A. Kuznetsov, A. A. Kuznetsova, Y. N. Vorobjev, L. N. Krasnoperov and O. S. Fedorova, PLoS One, 2014, 9, e98495 Search PubMed.
- N. A. Kuznetsov, O. A. Kladova, A. A. Kuznetsova, A. A. Ishchenko, M. K. Saparbaev, D. O. Zharkov and O. S. Fedorova, J. Biol. Chem., 2015, 290, 14338–14349 CrossRef CAS PubMed.
- Y. N. Vorobjev, Adv. Protein Chem. Struct. Biol., 2011, 85, 281–322 CAS.
- Y. N. Vorobjev and J. Hermans, Biophys. J., 1997, 73, 722–732 CrossRef CAS PubMed.
- G. D. Rose and R. Wolfenden, Annu. Rev. Biophys. Biomol. Struct., 1993, 22, 381–415 CrossRef CAS PubMed.
- J. Duguid, V. A. Bloomfield, J. Benevides and G. J. Thomas, Biophys. J., 1993, 65, 1916–1928 CrossRef CAS PubMed.
- E. V. Hackl, S. V. Kornilova and Y. P. Blagoi, Int. J. Biol. Macromol., 2005, 35, 175–191 CrossRef CAS PubMed.
- R. D. Shannon, Acta Crystallogr., 1976, 32, 751–767 CrossRef.
- G. Barzilay, C. D. Mol, C. N. Robson, L. J. Walker, R. P. Cunningham, J. A. Tainer and I. D. Hickson, Nat. Struct. Biol., 1995, 2, 561–568 CrossRef CAS PubMed.
- K. M. Schermerhorn and S. Delaney, Biochemistry, 2013, 52, 7669–7677 CrossRef CAS PubMed.
- N. J. Greenfield, Anal. Biochem., 1996, 235, 1–10 CrossRef CAS PubMed.
- J. T. Pelton and L. R. McLean, Anal. Biochem., 2000, 277, 167–176 CrossRef CAS PubMed.
| This journal is © The Royal Society of Chemistry 2016 |


