Study of the biochemical effects induced by X-ray irradiations in combination with gadolinium nanoparticles in F98 glioma cells: first FTIR studies at the Emira laboratory of the SESAME synchrotron
Ibraheem
Yousef
ab,
Olivier
Seksek
c,
Sílvia
Gil
d,
Yolanda
Prezado
c,
Josep
Sulé-Suso
e and
Immaculada
Martínez-Rovira
*c
aSESAME Synchrotron, P.O. Box 7, 19252 Allan, Jordan
bALBA Synchrotron, Carrer de la Llum 2-26, 08290 Cerdanyola del Vallès, Barcelona, Spain
cLaboratoire d'Imagerie et Modélisation en Neurobiologie et Cancérologie (IMNC), Centre National de la Recherche Scientifique (CNRS), Université Paris 7 & 11, Campus Universitaire, Bât. 440, 15 rue Georges Clemenceau, 91406 Orsay Cedex, France. E-mail: immamartinez@gmail.com
dDepartment of Dermatology, Hospital Parc Taulí, Parc Taulí 1, 08208, Sabadell, Spain
eInstitute for Science and Technology in Medicine, Keele University, Thornburrow Drive, Stoke on Trent, Staffordshire ST4 7QB Keele, UK
First published on 2nd March 2016
Abstract
One strategy to improve the clinical outcome of radiotherapy is to use nanoparticles as radiosensitizers. Along this line, numerous studies have shown the enhanced effectiveness of tumour cell killing when nanoparticles are exposed to irradiation. However, the mechanisms of action are not clear yet. In addition to the damage due to a possible local radiation dose enhancement, the interaction of nanoparticles with essential biological macromolecules could lead to changes in the cells, such as cell arrest at radiosensitive phases. Within this framework, vibrational spectroscopy was used to investigate the biochemical changes in F98 glioma cells induced by X-ray irradiations combined with gadolinium nanoparticles. Fourier transform infrared (FTIR) microspectroscopy experiments were performed at the Emira laboratory of the SESAME synchrotron (Jordan), allowing the characterisation of spectral signatures of nanoparticle-induced effects in glioma cells. Multivariate analysis of the spectra recorded using principal component analysis reveals clear differences in the DNA, protein and lipid regions in the presence of nanoparticles. Prior to irradiation, results show that nanoparticles induce biochemical modifications in the cells, probably due to changes in the cellular function. Biochemical alterations are amplified in the presence of radiation. In particular, variations in the intensity and in the position of the PO2− symmetric and asymmetric modes are observed due to radiation damage to the DNA, which is increased in nanoparticle-treated cells. At 24 hours post-irradiation, biochemical changes related to the hallmark characteristics of cell death are detected. This includes a shift towards low wavenumbers in the amide I and II bands, relative amplitude changes in the CH2 and CH3 stretching modes, along with DNA chromatin condensation indications. Results were confirmed by two complementary cell viability assays.
1. Introduction
Radiotherapy is one of the main modalities for cancer treatment, its main limitation being the high morbidity of the surrounding healthy tissue. This is especially critical in the case of radioresistant tumors, such as gliomas. High-grade gliomas have a poor prognosis and most of the treatments remain palliative. Within this context, several new approaches have been developed. Hadrontherapy,1 spatially fractionated radiotherapies2 or therapies combined with the use of radiosensitizers (for instance, nanoparticles3) are some examples. The idea is to increase the local effect in the tumor while minimizing the normal tissue damage.The use of high-atomic-number (Z) nanoparticles as potential tumour selective radiosensitizers is a recent breakthrough in radiotherapy.3 Nanoparticles can be preferentially delivered to the tumor tissues through their enhanced permeability and retention effect (EPR).4 They are capable of entering the cell and lead to less adverse effects than conventional radiosensitizers.5 Radiation enhanced sensitivity using nanoparticles depends on the nanoparticle type and size, cell line, irradiation energy, concentration and intracellular localization.
This therapeutic approach was first proposed by Hainfeld and collaborators,3 who demonstrated the radiosensibilization of 1.9 nm gold nanoparticles in EMT-6 mammary carcinomas bearing mice. They observed one-year survival in 86% of the animals treated under these conditions, compared with 20% in those irradiated without a gold nanoparticle injection.3 Since this pioneering experiment, many biological studies have shown a significant gain in tumour control when low energy X-rays are delivered in the presence of nanoparticles.6–10 Mainly high-Z metallic nanoparticles have been used since the basic rationale has been based on the generation of secondary particles (short range photoelectrons, Auger electrons), which can enhance the dose locally. At the same time, reactive oxygen species (ROS) are produced, which induce indirect damage to the cell. However, the radiosensitization effect of nanoparticles has not only been attributed to physical effects (local dose enhancement) but also to some biochemical processes induced by the nanoparticles inside the cells.11,12 For instance, the interaction of nanoparticles with essential biological macromolecules could lead to changes in the cellular function, such as cell arrest at radiosensitive phases.13,14 These effects, which could be amplified with a subsequent irradiation, might increase their anticancer effectiveness.
Within this context, the objective of this study was to perform Fourier transform infrared (FTIR) microspectroscopy experiments in the F98 rat glioma cell line to obtain deeper insights into the biochemical mechanisms underlying the amplification of radiation effects when using gadolinium AGuIX® nanoparticles.15 Among the different nanoparticles, the interest in gadolinium (Gd; Z = 64) nanoparticles has gradually increased since Gd is paramagnetic, so it can be used as a magnetic resonance imaging (MRI) contrast agent, which makes Gd a perfect tool for theragnosis.16 In particular, the effectiveness of AGuIX® nanoparticles has already been proven in previous biological studies with several types of cell lines or animal models, and irradiation conditions.15,17,18
FTIR is a vibrational molecular technique that has the potential to provide biochemical information on the cell on a microscopic scale, as well as functional information on the cell cycle, cell proliferation and cell death modes.19–22 The main intracellular biomolecules such as nucleic acids, proteins and lipids have characteristic infrared vibrational modes. Thus, the analysis of the infrared spectra can identify and quantify these molecular species within a cell. This information is essential to better characterise the enhancement of the nanoparticle-induced damage in the cells.23 To the best of our knowledge, this is the first study to evaluate AGuIX® nanoparticle-induced biochemical effects in the presence of radiation by using FTIR microspectroscopy. In addition, this is one of the first research studies that have been performed at the Emira laboratory of the SESAME synchrotron in Jordan.
2. Materials and methods
2.1. F98 cells and cell culture
The F98 rat glioma cell line (ATTC-CRL-2397) was purchased from LGC Standards (Molsheim, France). This type of cell has a highly invasive growth pattern and is weakly immunogenic in syngeneic Fischer rats.24Cells were cultured in high glucose DMEM medium (Gibco) supplemented with 10% Foetal Calf Serum, 1% penicillin–streptomycin, 1% glutamine and 1% sodium pyruvate in a 5% CO2 incubator at 37 °C. Cells were seeded in 6-well plates (Nunc) on the day prior to the irradiation; 2 mL of a 5 × 10⁴ cells per mL suspension were placed in each well and incubated overnight in order to reach a 75% confluence rate on the irradiation day.
2.2. Nanoparticles
Gadolinium nanoparticles (AGuIX®; Activation and Guiding of Irradiation by X-ray) were purchased from Nano-H (Lyon, France) in a lyophilized formulation. These nanoparticles consist of a polysiloxane network surrounded by a number (around 10) of gadolinium chelates (diethylenetriaminepentaacetic acid, DTPA) covalently grafted to the polysiloxane inorganic matrix. The nanoparticles have a diameter of 3.0 ± 1.0 nm.25A nanoparticle stock solution of 100 mM was obtained by solubilization in ultrapure Millipore (DirectQ 8) water and kept at 4 °C. For cell treatment, 3 mL of 1 mM nanoparticle solution in fresh supplemented medium was added to the wells for 6 hours at 37 °C and 5% CO2. At such concentrations, nanoparticles are not toxic.5,26,27 A recent study with the same type of nanoparticle and cell line showed that uptake of Gd nanoparticles was time-dependent and reached a plateau after 5 hours incubation time.14
The final nanoparticle concentration in the medium was 1 mM. In order to visualize the intracellular localization of nanoparticles without additional labeling, which could impair and modify the actual internalization process, cells were only observed by light transmission microscopy. After plating cells for 24 hours on regular coverglasses, they were incubated at 37 °C in complete culture medium with or without nanoparticles under the same experimental conditions as those used for the irradiation protocol. They were then placed on an 80i Elipse Nikon microscope stand (Scop Pro, Marolles-en-Hurepoix, France) and observed with a 40× water-immersion DIC objective. Micrographs were obtained using a Zyla 5.5 MPX Andor SCMOS cooled camera (Scop Pro, France). In Fig. 1, significant differences can be observed between F98 cells incubated without (right) or with nanoparticles (left). While it would be very difficult with this type of data to address the issues of relative internal nanoparticle concentration and aggregation (if any), as well as the internalization process (diffusion or endocytosis), the punctuated pattern strongly suggests that nanoparticles are indeed present in some form right inside the cell cytoplasm, affecting metabolic changes induced by X-ray irradiations.
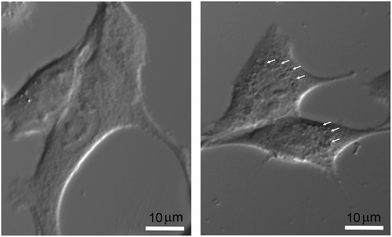 | ||
| Fig. 1 Micrographs of F98 cells, without nanoparticles (right) and after a 6 h incubation with 1 mM nanoparticles (left). Bar = 10 μm. | ||
2.3. X-ray irradiations
Before irradiation, the medium was replaced with 3 mL of fresh supplemented medium in all wells, including the control (0 Gy, no irradiation) samples.X-ray irradiations (20 × 20 cm2) were performed with the XRAD 320 X-ray generator (Cegelec) at the Institut Curie (Orsay, France). The mean photon beam energy of this device is around 90 keV and the dose rate is 1.1 Gy min−1. Several irradiation doses were delivered to the cells: 0 Gy (no irradiation), 5, 10 and 20 Gy. This range of doses was selected according to the previous literature, where single doses lower than 20 Gy were applied to F98 cells.28–30
The dosimetry was performed using an ionization chamber (PTW Semiflex ionization chamber TW31013). Radiochromic EBT3 films were also used to ensure the quality of irradiation.
2.4. FTIR sample preparation
Two sets of data were obtained: the first one just after irradiation to evaluate immediate treatment-induced effects (T0); and the second one after an additional 24 hours (T0 + 24 h) to assess cellular response from the treatment (X-ray irradiations and nanoparticles). After T0 and T0 + 24 h, the medium was removed (having previously collected floating cells) and 100 μL of a 0.05% Trypsin-EDTA solution (Lonza) was added to each well in order to detach cells; floating cells were added back to the trypsinised cells to take into account the whole cell population that has been treated. Then, 500 μL of supplemented DMEM medium was added and the cell suspension was centrifuged at 1500 rpm for 5 minutes at 4 °C. The cellular pellet was rinsed with PBS, and re-centrifuged at 1500 rpm for 5 minutes. The pellet was then re-suspended in 10% formalin neutral buffered solution (Sigma-Aldrich) and incubated for 1 hour at room temperature. Samples were temporarily stored at 4 °C.Then, cells were cytospun onto 0.5 mm-thick infrared transparent calcium fluoride (CaF2) at 700 rpm. Prior to the cytospinning with Cytospin III (Shandon), samples were centrifuged at 1500 rpm for 5 minutes, and the pellet was rinsed 3 times in Millipore water to wash out the residual phosphate ions. Dried cells were then analysed by FTIR microspectroscopy.
2.5. FTIR microspectroscopy
Fourier transform infrared microspectroscopy was performed at the Emira laboratory of the SESAME synchrotron (Jordan). The internal (Globar®) source was used for these experiments. The ThermoNicolet® 8700 FTIR spectrometer coupled with a Continuum® infrared microscope (Thermo Scientific, CA) was used for the measurements. This microscope is equipped with a liquid nitrogen-cooled mercury cadmium telluride 50 μm MCT-A detector. The microscope used a 32× Schwarzschild objective (NA = 0.65) and a matching 32× condenser.Infrared spectra were recorded in transmission mode. Cells were manually selected through visualization. All spectra were obtained using a double path single masking aperture size of 20 μm × 20 μm. Single spectra (around 100 per sample) were collected in the 3100–1000 cm−1 mid-infrared range at a spectral resolution of 4 cm−1 with 128 co-added scans per spectrum.
2.6. FTIR data treatment and statistical analysis
Data analysis and preprocessing were performed using OMNIC® 9 software (Thermo Scientific, CA). Multivariate analysis was performed using Unscrambler® X (CAMO Process AS, Norway).Prior to principal component analysis (PCA), EMSC (Extended Multiplicative Scatter Correction) was applied on underivatised spectra. This was followed by normalization (standard normal variate, SNV) at each specific region: the fingerprint (1800–1000 cm−1), the nucleic acids and carbohydrates (1330–1000 cm−1), the proteins (1800–1475 cm−1) and the lipid (3100–2800 cm−1) regions. Averaged spectra data were baseline corrected and unit vector normalized over the spectral range of interest, as previously described.31 On the other hand, second derivative spectra calculations were performed using the Savitzky–Golay algorithm (third order polynomial) and range normalized. The latter calculations could provide more details of small shifts in peaks than the ones observed in the raw spectra.
2.7. Cell viability assays
Sample preparation for cell viability assays was performed under identical incubation and irradiation conditions as those used for FTIR experiments. Two complementary procedures were performed for cell viability assays: (i) annexin V and propidium iodide binding measurements for flow cytometry; and (ii) a resazurin-based assay to analyze the metabolic activity of living cells.Concerning cell death, the Alexa Fluor® 488 annexin V/Dead Cell Apoptosis Kit from Molecular Probes (Invitrogen) was used at T0 + 24 h. Cells were re-suspended in 100 μL Trypsin-EDTA solution and centrifuged at 1500 rpm for 5 minutes at 4 °C. Pellets were re-suspended in 100 μL of annexin-binding buffer containing Alexa Fluor® 488 annexin V and propidium iodide according to the Molecular Probes Kit protocol. Samples were incubated for 15 minutes at room temperature, and 400 μL of annexin-binding buffer were added. Cell suspensions were analyzed with a Becton Dickinson FACSCalibur 3C (argon laser wavelength at 488 nm) flow cytometer, with emission filters set at BP530/30 and BP585/42 nm for Alexa Fluor® 488 and propidium iodide labels, respectively. Ten thousand cells per sample were measured for both fluorescence intensities. Before measurements, control samples (cells without labeling and cells with either Alexa Fluor® 488 annexin or propidium iodide labeling) were used to optimize the parameters (fluorescence threshold and compensation) of the device. All the measurements were performed in triplicate. Control cells (no irradiation and no nanoparticle treatments) were considered to have 100% of living cells (‘alive’) and 0% of both apoptotic and necrotic sub-populations. The values obtained with the different cell treatments were normalized using the values of the control cell group.
Metabolic cell activity was analyzed using a classical resazurin-based assay.32 After the treatment, cells were harvested in each well by the usual Trypsin-EDTA treatment and addition of fresh supplemented medium. Cells were counted with a Mallassez counting chamber and 100 μL of 106 cells per mL were seeded in 96-well microplates. For each condition (irradiation and/or nanoparticle treatments), 15 wells were prepared. At T0 + 48 h, 10 μL of a resazurin 0.3 mg mL−1 filtered stock solution were added to each well. After 35 minutes at 37 °C and 5% CO2, fluorescence measurements (530 nm excitation and 590 nm emission) were carried out on a Fluoroskan Ascent microplate reader (Thermo Scientific). Control conditions (no nanoparticle treatment and no irradiation) were used as the baseline to calculate the percentage of metabolic viable cells after treatments.
3. Results and discussion
Details of the FTIR analysis are presented in section 3.1 for two times post-irradiation (T0 and T0 + 24 h), several doses (from 0 to 20 Gy), and in the presence (+NP) and absence (−NP) of Gd nanoparticles (at 1 mM). Results of cell viability assays are reported in section 3.2.3.1. FTIR analysis
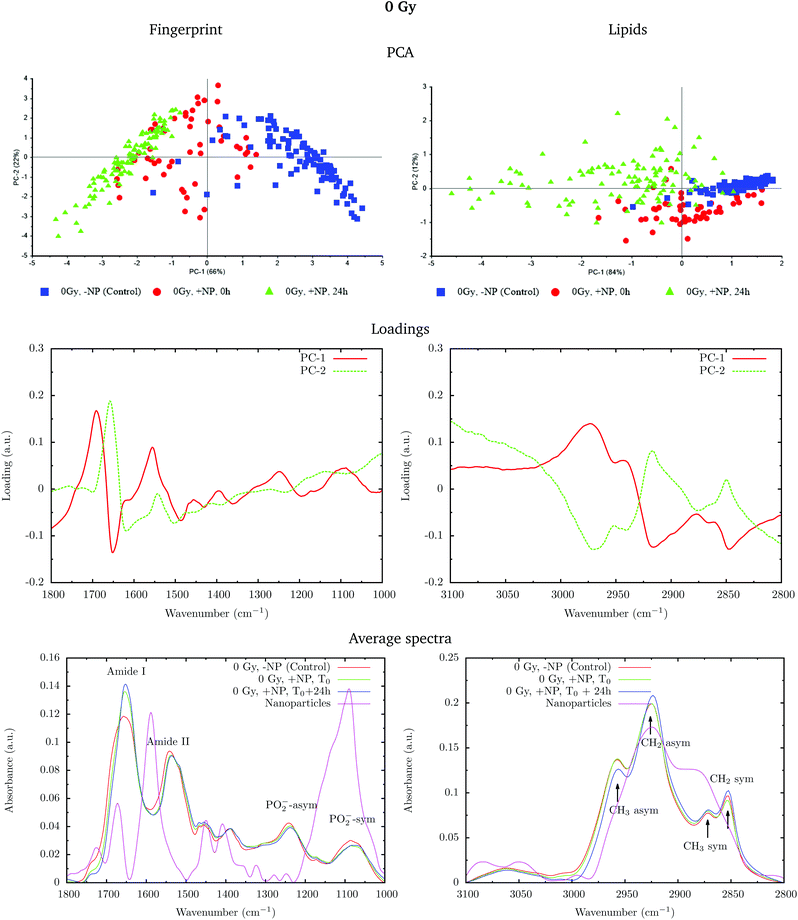
Fig. 2 shows the PCA scores (top), loading plots (middle) and average spectra (bottom) in the fingerprint region (1800–1000 cm−1, left) and at the lipid region (3100–2800 cm−1, right). Nanoparticle and time dependent changes are clearly observed in both regions.
In order to monitor the effect of the structure of the nanoparticles on the infrared spectra, average spectra plots also represent the absorbance spectra of the nanoparticles alone (Fig. 2, purple line). In the fingerprint region, we can observe a high peak in the nanoparticle spectrum at 1087 cm−1 that overlaps with the infrared features arising from the cell PO2− band components. However, despite the high intensity of this peak in the nanoparticle spectrum, we observe a decrease in the PO2− band of the cells spectra after treatment. There is another small peak in the nanoparticle spectrum at 1671 cm−1 near the Amide I band. By looking at the averaged spectrum of the treated samples, we can clearly observe the slight shift toward the low frequency region, which indicates that the presence of this peak has no influence on the final spectral differences. In the lipid region, there is one band at 2925 cm−1, which mainly overlaps with the CH2 asymmetric band present in the cells. These observations ensure that the spectral differences detected in the presence of nanoparticles and discussed in the following text are not due to the structure of the nanoparticles, and they are a consequence of the nanoparticle-induced biochemical effects.
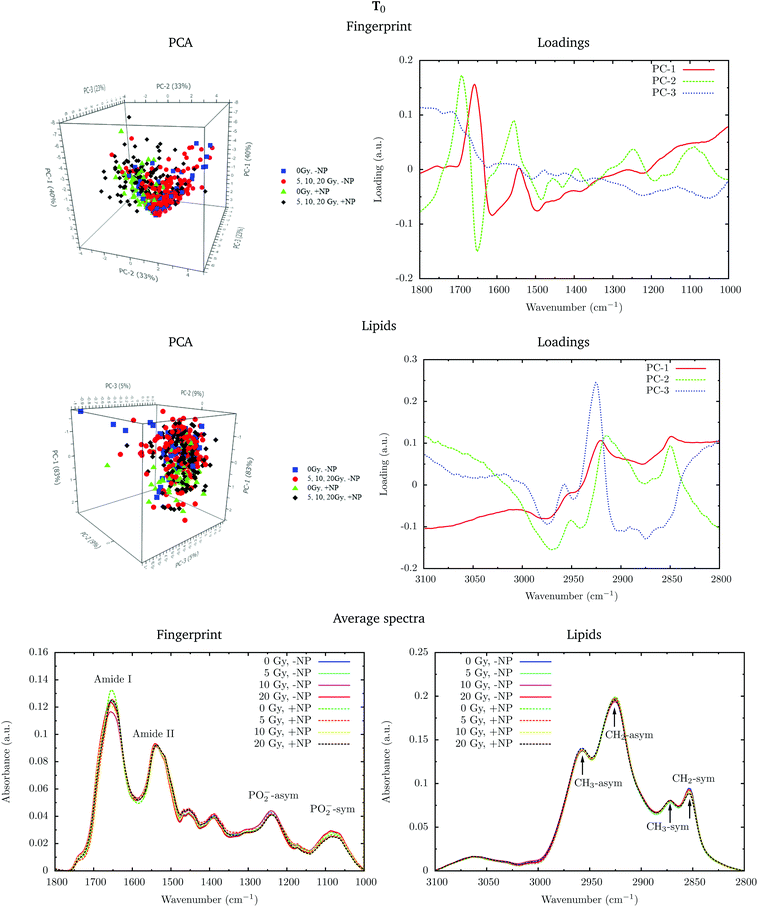
An analysis of the PCA loading plots (Fig. 2, middle) reveals that most of the variances accounting for the separation between the treated groups along the first two principal components (PC-1 and PC-2) involve changes in the amide I and amide II bands, characteristic of functional group vibrations (C![[double bond, length as m-dash]](https://www.rsc.org/images/entities/char_e001.gif) O, C–N, N–H) in protein secondary structures. In particular, different protein secondary structures are revealed between the control and nanoparticle-treated cells, with a more explicit β-type secondary structure inside the nanoparticle-treated cells. The initial change in the secondary structure (β sheet-related feature) could be explained by changes in the membrane protein structure upon penetration of nanoparticles inside the cells.33 They could also be related with nanoparticle-induced conformational changes in proteins, as observed in previous studies.34
O, C–N, N–H) in protein secondary structures. In particular, different protein secondary structures are revealed between the control and nanoparticle-treated cells, with a more explicit β-type secondary structure inside the nanoparticle-treated cells. The initial change in the secondary structure (β sheet-related feature) could be explained by changes in the membrane protein structure upon penetration of nanoparticles inside the cells.33 They could also be related with nanoparticle-induced conformational changes in proteins, as observed in previous studies.34
We also observe slight variations in the symmetric and asymmetric phosphodiester vibrations of DNA. Regarding the lipid spectral range (3100–2800 cm−1), changes in the intensity of the CH2 and CH3 symmetric and asymmetric modes are observed, which could be related to the state of order of the hydrocarbon tails in lipids.35–37
The changes are better manifested at T0 + 24 h, as can be clearly observed in the PCA cluster separation of Fig. 2 (top). Such modifications (after one cell cycle) could be directly correlated with the changes in the distribution of the different phases of the cell cycle38 in the presence of these nanoparticles, as described by Taupin and collaborators.14
In the protein region of the fingerprint spectral range, the investigation of the loadings shows that a very slight variance emerged from the changes in the amide I and amide II bands. In particular, small changes in intensity and position are observed in both amide I and amide II bands in the presence of nanoparticles and/or radiation. In the lipid region, we also observe slight changes in the intensity of the CH2 symmetric mode.
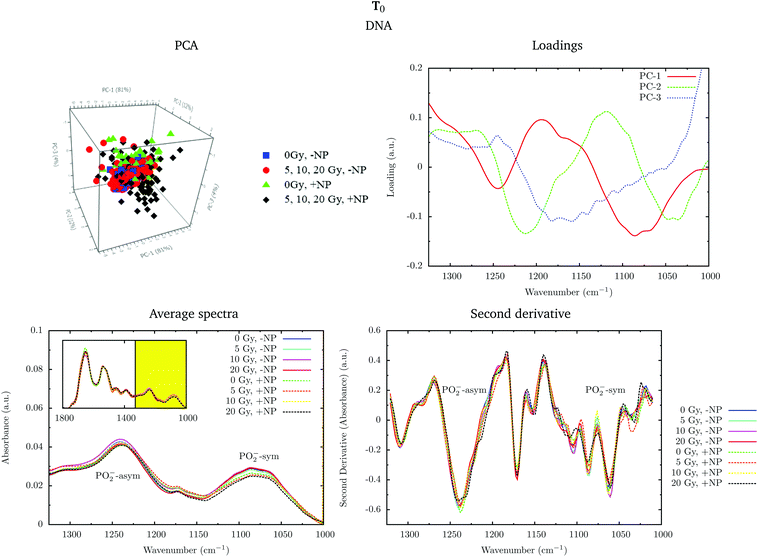
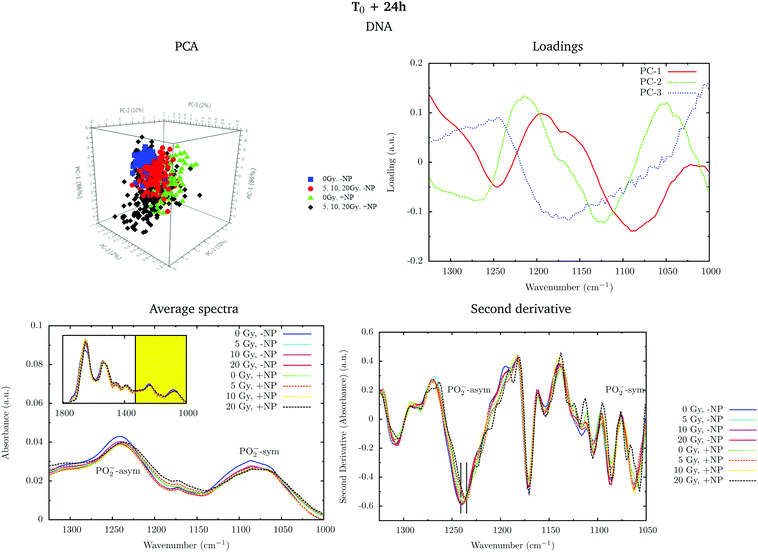
Fig. 4 shows the PCA scores, loading plots and the average spectra in the DNA region (1330–1000 cm−1) at T0. A straightforward means of examining the spectral changes occurring after irradiation is through the analysis of the different averaged spectra. The corresponding Savitzky–Golay second derivative is also presented.
Although no clear separation is observed in the PCA analysis, one can observe small changes in the intensity of the PO2− symmetric stretching peak at 1085 cm−1 in the average spectra. There is a slight decrease of intensity of this band in nanoparticle-treated cells, which is amplified in the presence of radiation; this effect has been reported to indicate strand cleavage and chromatin fragmentation in previous studies.39–41 At the same time, this DNA fragmentation could occur as a consequence of an increase of double strand breaks and of nuclear fragmentation. Previous studies have already observed similar variations in the absorbance of the nucleic acid structure as a result of radiation damage.40,42,43 This damage is increased in the presence of nanoparticles. In the second derivative, a subtle shift of the PO2− asymmetric band (1238 cm−1) can be observed in the presence of nanoparticles (+NP, dashed lines) with respect to the absence of nanoparticles (−NP, solid lines) for all radiation doses. This effect could be associated with local conformational changes in the DNA due to the interaction with the nanoparticles.44 It is important to mention that the reported changes are better manifested after one cell cycle (T0 + 24 h), as will be discussed in section 3.1.3.
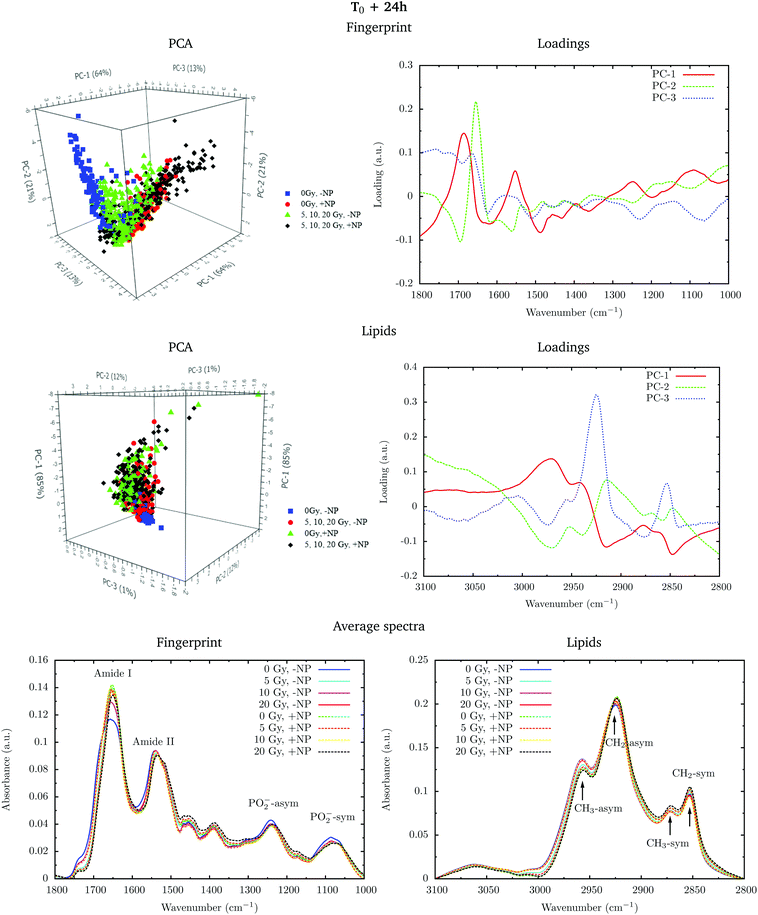
PCA loadings reveal clear differences in several spectral regions in the presence of Gd nanoparticles and X-ray irradiations with respect to controls (no irradiation, no nanoparticles). In the fingerprint region, an inspection of the PCA loadings indicates that most of the variances account for changes (in the position and intensity) in the amide I and amide II bands. Those changes could indicate conformational changes in the secondary structure of proteins.45 Thus, the effect of the irradiation in combination with nanoparticle treatment can be initially interpreted as a marked change in the secondary structure of the proteins, which exhibits a clear line width change of the amide I (see Fig. 5). The line width increases towards the low frequency region, and it is interpreted as a higher contribution of a β-sheet secondary structure inside the cells, both in the presence of nanoparticles and/or radiation.
Secondary protein structure changes inside the cells have been referenced to correlate with the cell death, either by necrosis or apoptosis.21,46 This is in agreement with cytometry results (see section 3.2). In particular, a shift toward lower wavenumbers has been associated with the hallmark characteristics of cell death as a result of damaging factors.21,43,46,47 On the other hand, the changes in absorbance in these bands have been previously ascribed to the damaging effects of ionizing radiation through the generation of free radicals.40,43,45,48
Analysis in the CH2 and CH3 stretching region (3100–2800 cm−1) indicated changes in the ratio between the CH2 long alkyls chain and terminated CH3. There is a higher absorbance in the CH2 symmetric and asymmetric stretching modes in the treated cells (especially with nanoparticles), indicating phospholipid membrane changes following oxidation or increased lipid metabolism due to cell death processes.49,50 We also observed an increase in the CH2/CH3 symmetric mode due to oxidative processes occurring in response to treatment and consistent with cell death.51,52 There is also a downward shift of the CH3 asymmetric stretching modes in spectra recorded in nanoparticle-treated cells. This downward shift could have an origin in the local organization of lipids or in a higher oxidation level due to the presence of nanoparticles.
Fig. 6 shows the PCA scores, loading plots and the average spectra in the DNA region (1330–1000 cm−1). Changes in the symmetric and asymmetric phosphodiester vibrations of DNA contribute to PCA score clustering. We observe a decrease in the amplitude of the PO2− symmetric and asymmetric stretching peaks in the presence of radiation or nanoparticles compared to control cells. The PO2− symmetric stretching peak (1085 cm−1) intensity after X-ray irradiations for cells treated with Gd nanoparticles is lower than that for untreated cells. We also observe a shift of the PO2− asymmetric band (1238 cm−1) in treated cells. Taken together, these features could signify an increase in DNA strand breaks and base cleavage reactions and chromatin fragmentation with radiation dose.39,40,42,43
Finally, it is important to mention that the biochemical changes induced by the nanoparticles are initially observed in the absence of radiation (see section 3.1.1). In the presence of radiation, these effects (shift in the amide bands, changes in the phosphodiester vibrations of DNA and modifications in the CH2 and CH3 stretching regions) are amplified.
3.2. Flow cytometry and cell viability assays
Flow cytometry experiments were carried out in order to assess the connection between biochemical responses to radiation/nanoparticles treatments and cell viability. To allow treated cells sufficient time to progress through the cell cycle as well as to be consistent with the FTIR measurement procedure, measurements were performed at T0 + 24 h, with or without nanoparticle incubation. The histogram in Fig. 7 (left) displays the sub-population distribution of living and dead cells, the latter differentiated between apoptotic and necrotic cells. The main observations are: (i) a significant decrease of cell survival after irradiation, regardless of the dose, either with or without nanoparticle treatment; (ii) a higher level of the necrotic cell sub-population with respect to the apoptotic cell sub-population, regardless of the nanoparticle treatment; and (iii) significant effect of the nanoparticles on the decrease of cell survival with a subsequent irradiation. For instance, at T0 + 24 h, a 5 Gy irradiation dose induces 3.0 ± 0.2% of necrotic cells on a non-nanoparticle-treated population; these values increase significantly to 7.0 ± 0.8% in the nanoparticle-treated population.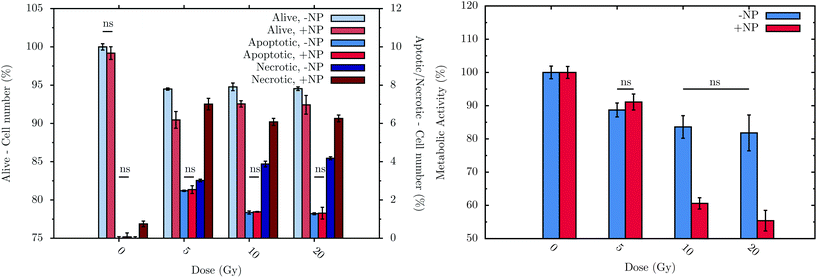 | ||
| Fig. 7 Flow cytometry results (left) at T0 + 24 h and metabolic activity (right) of F98 cells at T0 + 48 h in the absence (−NP) and presence (+NP) of nanoparticles for several doses of radiation (between 0 and 20 Gy). Control cells (no radiation and no nanoparticle treatments) were considered to have 100% of living cells (‘alive’) and 0% of both apoptotic and necrotic sub-populations. The values obtained with the different cell treatments were normalized using the values of the control cell group. Data is presented as the mean and standard error of the mean (SEM). Statistical significance in the analysis of the effect of the radiation dose, with or without nanoparticles, was determined using standard two-tailed ANOVA.54 If any, non-significant differences (ns) with p > 0.05 are indicated on the graphs. | ||
The metabolic activity of living cells was analyzed using the resazurin-based fluorescent assay after treatments. The histogram in Fig. 7 (right) shows the metabolic activity of surviving F98 cells due to the treatments (T0 + 48 h).28 Without nanoparticles, the radiation effect occurs just after a radiation dose of 5 Gy, decreasing the metabolic activity to 89 ± 2%. Upon nanoparticle treatment, radiation doses higher than 5 Gy induce a lower cell metabolic activity: for example, at 20 Gy with 1 mM nanoparticles, cells show a metabolic activity of 55 ± 3%.
Finally, it can be concluded that radiation doses equal to or higher than 5 Gy lead to a slight but significant toxic effect. These results are in line with those obtained by means of FTIR. In particular, the analysis performed by flow cytometry allows the observation of a decrease of 5.5 ± 0.2% in the living cells after irradiation, whilst the metabolic cell activity of these cells decrease by 11 ± 2% at T0 + 48 h. This cell toxicity can be enhanced even more in the presence of nanoparticles, which increase the cell death, as is depicted in Fig. 7 (left). In this sense, after 20 Gy irradiation with nanoparticle treatment, the percentage of living cells decreases by 7.6 ± 0.6%, while the metabolic activity is reduced by 45 ± 3%. While obtained on another cell line, these nanoparticle effects are consistent with the measurements recently performed in vitro on a pancreatic cancer cell line.53 Related changes in DNA, lipid and protein regions were also detected by means of FTIR in the presence of nanoparticles (see section 3.1).
4. Conclusions
In this work, we have assessed the infrared spectral modifications induced by X-ray irradiations combined with Gd nanoparticles on F98 cells, at 0 and 24 hours post-irradiation. PCA analysis indicates clear differences between the treated groups (nanoparticles and/or radiation). We observe changes at a biochemical level in the presence of nanoparticles, indicating changes in the cellular function; these alterations are then amplified with the subsequent irradiation.Immediately after irradiation, slight changes in the intensity and in the position of the PO2− symmetric and asymmetric modes were observed. This could be related to the initial radiation damage in the DNA, which is increased in nanoparticle-treated cells. At 24 hour post-irradiation, biochemical changes are better manifested and they are related to the hallmark characteristics of cell death. Changes include a shift toward the low wavenumbers in the amide I and II bands, relative amplitude changes in the CH2 and CH3 stretching modes, along with DNA chromatin condensation indications arising from variations in the phosphodiester DNA modes.
Further studies will be required to assess the full impact of AGuIX® nanoparticles combined with radiation, but this study provides the basis to understand the biochemical effects induced in the main cell biomolecules. Further investigations will include equivalent studies using a synchrotron source, whose brilliance will enable the acquisition of further details of the biochemical effect of the nanoparticles down to the nucleus and cytoplasm levels.
Acknowledgements
We would like to thank the SESAME synchrotron for the granted beam time. We acknowledge the Centre National de la Recherche Scientifique (CNRS), the SESAME Synchrotron, the International Atomic Energy Agency (IAEA), the International Centre for Theoretical Physics (ICTP), the Richard Lounsbery Foundation, and L'Oréal-UNESCO (through the French Prize for Women in Science to I. Martínez-Rovira) for funding this project. We also acknowledge Prof. H. Hoorani (National Center for Physics, Pakistan) for his support. Finally, we thank Prof. P. Gardner and his group (University of Manchester, UK), Dr S. Heinrich, C. Roulin and Dr F. Pouzoulet (Institut Curie, France), and Dr F. Gaudin (Institut Paris-Sud d'Innovation Thérapeutique, France) for fruitful scientific discussions. Thanks to Abigail V. Rutter (ISTM, Keele University) for her help in improving the manuscript.References
- D. Schardt, T. Elsasser and D. Schulz-Ertner, Rev. Mod. Phys., 2010, 82, 383–425 CrossRef.
- I. Martínez-Rovira, G. Fois and Y. Prezado, Med. Phys., 2015, 42, 685–693 CrossRef PubMed.
- J. F. Hainfeld, D. N. Slatkin and H. M. Smilowitz, Phys. Med. Biol., 2004, 49, 309–315 CrossRef.
- Y. Matsumura and H. Maeda, Cancer Res., 1986, 46, 6387–6392 CAS.
- E. Porcel, S. Liehn, H. Remita, N. Usami, K. Kobayashi, Y. Furusawa, C. Le Sech and S. Lacombe, Nanotechnology, 2010, 21, 085103 CrossRef PubMed.
- J. Hainfeld, F. Dilmanian, D. Slatkin and H. Smilowitz, J. Pharm. Pharmacol., 2008, 60, 977–985 CrossRef CAS PubMed.
- N. Chattopadhyay, Z. Cai, J. Pignol, B. Keller, E. Lechtman, R. Bendayan and R. Reilly, Mol. Pharm., 2010, 7, 2194–2206 CrossRef CAS PubMed.
- S. Jain, D. Hirst and J. O'Sullivan, Br. J. Radiol., 2009, 85, 101–113 CrossRef PubMed.
- D. Joh, L. Sun, M. Stangl, A. Al Zaki, S. Murty, P. Santoiemma, J. Davis, B. Baumann, M. Alonso-Basanta, D. Bhang, G. Kao, A. Tsourkas and J. Dorsey, PLoS One, 2013, 8, e62425 CAS.
- I. Miladi, M.-T. Aloy, E. Armandy, P. Mowat, D. Kryza, N. Magné, O. Tillement, F. Lux, C. Billotey, M. Janier and C. Rodriguez-Lafrasse, Nanomedicine, 2015, 11, 247–257 CrossRef CAS PubMed.
- K. Butterworth, S. McMahon, F. Currel and K. Prise, Nanoscale, 2012, 4, 4830–4838 RSC.
- I. Martínez-Rovira and Y. Prezado, Med. Phys., 2015, 42, 6703–6710 CrossRef PubMed.
- D. Choudhury, P. Xavier, K. Chaudhari, R. John, A. Dasgupta, T. Pradeep and G. Chakrabarti, Nanoscale, 2013, 5, 4476–4489 RSC.
- F. Taupin, M. Flaender, R. Delorme, T. Brochard, J.-F. Mayol, J. Arnaud, P. Perriat, L. Sancey, F. Lux, R. Barth, M. Carriere, J.-L. Ravanat and H. Elleaume, Phys. Med. Biol., 2015, 60, 4449–4464 CrossRef PubMed.
- L. Sancey, F. Lux, S. Kotb, S. Roux, S. Dufort, A. Bianchi, Y. Cremillieux, P. Fries, J. Coll, C. Rodriguez-Lafrasse, M. Janier, M. Dutreix, M. Barberi-Heyob, F. Boschetti, F. Denat, C. Louis, E. Porcel, S. Lacombe, G. Le Duc, E. Deutsch, J. Perfettini, A. Detappe, C. Verry, R. Berbeco, K. Butterworth, S. McMahon, K. Prise, P. Perriat and O. Tillement, Br. J. Radiol., 2014, 87, 20140134 CrossRef CAS PubMed.
- D.-E. Lee, H. Koo, I.-C. Sun, J. Ryu, K. Kima and I. Kwon, Chem. Soc. Rev., 2012, 41, 2656–2672 RSC.
- M. Luchette, H. Korideck, M. Makrigiorgos, O. Tillement and R. Berbeco, Nanomedicine, 2014, 10, 1751–1755 CrossRef CAS PubMed.
- L. Sancey, S. Kotb, C. Truillet, F. Appaix, A. Marais, E. Thomas, B. van der Sanden, J. Klein, B. Laurent, M. Cottier, R. Antoine, P. Dugourd, G. Panczer, F. Lux, P. Perriat, V. Motto-Ros and O. Tillement, ACS Nano, 2015, 9, 2477–2488 CrossRef CAS PubMed.
- I. Yousef, J. Breard, N. SidAhmed-Adrar, A. Maamer-Azzabi, C. Marchal, P. Dumas and F. Le Naour, Analyst, 2011, 136, 5162–5168 RSC.
- L. Buriankova, Z. Nadova, D. Jancura, M. Refregiers, I. Yousef, J. Mikes and P. Miskovsky, Laser Phys. Lett., 2010, 7, 613 CrossRef CAS.
- J. Sulé-Suso, D. Skingsleyc, G. Sockalingumd, A. Kohlere, G. Kegelaerd, M. Manfaitd and A. El Hajb, Vib. Spectrosc., 2005, 38, 179–184 CrossRef.
- E. Lipiec, K. Bambery, J. Lekki, M. Tobin, C. Vogel, D. Whelan, B. Wood and W. Kwiatek, Radiat. Res., 2015, 184, 73–82 CrossRef CAS PubMed.
- C. Liu, C. Wang, C. Chien, T. Yang, S. Chen, W. Leng, C. Lee, K. Lee, Y. Hwu, Y. Lee, C. Cheng, C. Yang, Y. Chen, J. Je and G. Margaritondo, Nanotechnology, 2008, 19, 295104 CrossRef PubMed.
- R. Barth and B. Kaur, Neurooncology, 2009, 94, 299–312 CrossRef PubMed.
- R. Di Corato, F. Gazeau, C. Le Visage, D. Fayol, P. Levitz, F. Lux, N. Letourneur, D. Luciani, O. Tillement and C. Wilhelm, ACS Nano, 2013, 7, 7500–7512 CrossRef CAS PubMed.
- F. Lux, A. Mignot, P. Mowat, C. Louis, S. Dufort, C. Bernhard, F. Denat, F. Boschetti, C. Brunet, R. Antoine, P. Dugourd, S. Laurent, L. Vander-Elst, R. Muller, L. Sancey, V. Josserand, J. Coll, V. Stupar, E. Barbier, C. Remy, A. Broisat, C. Ghezzi, G. Le Duc, S. Roux, P. Perriat and O. Tillement, Angew. Chem., Int. Ed., 2011, 50, 12299–12303 CrossRef CAS PubMed.
- P. Mowat, A. Mignot, W. Rima, F. Lux, O. Tillement, C. Roulin, M. Dutreix, D. Bechet, S. Huger, L. Humbert, M. Barberi-Heyob, M. Aloy, E. Armandy, C. Rodriguez-Lafrasse, G. Le Duc, S. Roux and P. Perriat, J. Nanosci. Nanotechnol., 2011, 11, 7833–7839 CrossRef CAS PubMed.
- S. Gil, S. Sarun, A. Biete, Y. Prezado and M. Sabés, Radiat. Oncol., 2011, 6, 37 CrossRef PubMed.
- S. Lim, A. Pradhan, R. Barth, S. Nahar, R. Nakkula, W. Yang, A. Palmer, C. Turro, M. Weldon, E. Bell and X. Mo, J. Radiat. Res., 2015, 56, 77–89 CrossRef PubMed.
- L. Bobyk, M. Edouard, P. Deman, M. Vautrin, K. Pernet-Gallay, J. Delaroche, J. Adam, F. Esteve, J. Ravanat and H. Elleaume, Nanomedicine, 2013, 9, 1089–1097 CrossRef CAS PubMed.
- A. V. Rutter, M. R. Siddique, J. Filik, C. Sandt, P. Dumas, G. Cinque, G. D. Sockalingum, Y. Yang and J. Sulé-Suso, Cytometry, 2014, 85A, 668–697 Search PubMed.
- E. Vega-Avila and M. Pugsley, Proc. West. Pharmacol. Soc., 2011, 54, 10–14 CAS.
- L. Treuel, X. Jiang and G. Nienhaus, J. R. Soc., Interface, 2013, 10, 20120939 CrossRef PubMed.
- D. Sahoo, P. Bhattacharya, H. K. Patra, P. Mandal and S. Chakravorti, J. Nanopart. Res., 2011, 13, 6755–6760 CrossRef CAS.
- R. Mendelsohn and H. Mantsch, Progress in protein – Lipid interactions, Elsevier, Amsterdam, 1986 Search PubMed.
- N. Toyran, F. Zorlu, G. Donmez, K. Oge and F. Severcan, Eur. Biophys. J., 2004, 33, 549–554 CrossRef CAS PubMed.
- N. Toyran, P. Lasch, D. Naumann, B. Turan and F. Severcan, Biochem. J., 2006, 397, 427–436 CrossRef CAS PubMed.
- M. Jimenez-Hernandez, C. Hughes, P. Bassan, F. Ball, M. Brown, N. Clarke and P. Gardner, Analyst, 2013, 138, 3957–3966 RSC.
- D. Dovbeshko, N. Gridina, E. Kruglova and O. Pashchuk, Talanta, 2000, 53, 233–246 CrossRef PubMed.
- A. Meade, C. Clarke, H. Byrne and F. Lyng, Radiat. Res., 2010, 173, 225–237 CrossRef CAS PubMed.
- R. Ugenskiene, J. Lekki, W. Polak, M. Prise, M. Folkard, O. Veselov, Z. Stachura, W. Kwiatek, M. Zazula and J. Stachura, Nucl. Instrum. Methods Phys. Res., Sect. B, 2007, 260, 159–163 CrossRef CAS.
- N. Gault and J. Lefaix, Radiat. Res., 2003, 160, 238–250 CrossRef CAS PubMed.
- N. Gault, O. Rigaud, J. Poncy and J. Lefaix, Int. J. Radiat. Biol., 2005, 81, 767–779 CrossRef CAS PubMed.
- D. Whelan, K. Bambery, P. Heraud, M. Tobin, M. Diem, D. McNaughton and B. Wood, Nucleic Acids Res., 2011, 39, 5439–5448 CrossRef CAS PubMed.
- N. Gault, O. Rigaud, J. Poncy and J. Lefaix, Radiat. Res., 2007, 167, 551–562 CrossRef PubMed.
- E. Lipiec, K. Bambery, P. Heraud, C. Hirschmugl, J. Lekki, W. Kwiatek, M. J. Tobin, C. Vogel, D. Whelan and B. Wood, J. Mol. Struct., 2014, 1073, 134–141 CrossRef CAS.
- H. Holman, M. Martin, E. Blakely, K. Bjornstad and W. McKinney, Biopolymers, 2000, 57, 329–335 CrossRef CAS PubMed.
- M. Sharma, J. C. Crosbie, L. Puskar and P. Rogers, Int. J. Radiat. Biol., 2013, 89, 79–87 CrossRef CAS PubMed.
- B. Vileno, S. Jeney, A. Sienkiewicz, P. Marcoux, L. Miller and L. Forro, Biophys. Chem., 2010, 152, 164–169 CrossRef CAS PubMed.
- E. Albi, S. Cataldi, G. Rossi and M. Viola, Arch. Biochem. Biophys., 2008, 478, 52–58 CrossRef CAS PubMed.
- G. Zhang, R. Zhu, Y. Xu, Y. Yan and Y. Dai, Acta Bot. Sin., 2004, 46, 711–718 CAS.
- G. Blankenberg, P. Katsikis, R. Storrs, C. Beaulieu, D. Spielman, J. Chen, L. Naumovski and J. Tait, Blood, 1997, 89, 3778–3786 Search PubMed.
- A. Detappe, S. Kunjachan, J. Rottmann, J. Robar, P. Tsiamas, H. Korideck, O. Tillement and R. Berbeco, Cancer Nanotechnol., 2015, 6, 4–12 CrossRef PubMed.
- T. J. Hanson, http://www.forestmgt.com/.
| This journal is © The Royal Society of Chemistry 2016 |

