DOI:
10.1039/C5RA01500F
(Paper)
RSC Adv., 2015,
5, 16532-16539
Removal of Cu2+, Pb2+ and Cr6+ from aqueous solutions using a chitosan/graphene oxide composite nanofibrous adsorbent
Received
25th January 2015
, Accepted 29th January 2015
First published on 29th January 2015
Abstract
A novel electrospun chitosan/graphene oxide (GO) nanofibrous adsorbent was successfully developed by an electrospinning process. The adsorption behaviors of Cu2+, Pb2+ and Cr6+ metal ions from aqueous solutions using chitosan/GO nanofibers were investigated. The composite nanofibers were characterized by FTIR and SEM and TEM analysis. Kinetic and equilibrium studies showed that the experimental data of Cu2+, Pb2+ and Cr6+ were best described by double-exponential kinetic and Redlich–Peterson isotherm models. The maximum monolayer adsorption capacity of Pb2+, Cu2+and Cr6+ metal ions using chitosan/GO nanofibers was found to be 461.3, 423.8 and 310.4 mg g−1 at an equilibrium time of 30 min and temperature of 45 °C. Evaluation of the thermodynamic parameters (ΔG° < 0, ΔH° > 0 and ΔS° > 0) showed that the nature of the metal ions sorption by chitosan/GO nanofibers was endothermic and spontaneous. The reusability studies indicated that the chitosan/GO nanofibers could be reused frequently without almost any significant loss in adsorption performance. This study provides a promising chitosan/GO nanofibrous adsorbent with an efficient adsorption property for heavy metal ions removal.
1. Introduction
The presence of heavy metal ions in wastewater affects the environment and human health.1,2 The increase in concentration of metal ions in drinking water, rivers, ground water, and etc. endangers human and animal life.3 Therefore, the removal of heavy metal ions is of great importance. Among heavy metal ion removal techniques, an adsorption process due to high efficiency and low cost is commonly considered.4 The electrospun nanofibers prepared by the electrospinning process due to a high specific surface area and high porosity with fine pores have high potential for the removal of heavy metal ions from aqueous solutions.5–10 Chitosan, due to the presence of hydroxyl and amine groups, is widely used for the removal of heavy metal ions from aqueous solutions.11–15 In previous work, we investigated the application of chitosan nanofibers for heavy metal ions removal from aqueous solutions.11,12 Furthermore, the removal efficiency of metal ions increases by incorporation of magnetic nanoparticles into the chitosan matrix.16–18 Among magnetic adsorbents, graphene oxide (GO) due to the large specific area and oxygenous functional groups including hydroxyl, carboxyl and epoxy groups at the edges of GO sheets shows high adsorption performance of metal ions.19–21 However, the use of GO in industry activities due to difficult separation of GO nanosheets after adsorption process is impossible.22 Furthermore, the surface area of GO reduces after drying of nanosheets for reuse of GO.22,23 Therefore, the composite adsorbents of GO could be considered for the removal of heavy metal ions.16,17 In the previous studies, different kinds of nanostructured adsorbents based on chitosan/GO composite were developed and the performance of prepared chitosan/GO composite adsorbents were evaluated for adsorption of heavy metal ions.16,17 However, there is no study about the application of electrospun chitosan/GO composite nanofibrous adsorbent for the removal of heavy metal ions from aqueous solutions.
In the present study, GO was synthesized and composited with chitosan solution. Then, the chitosan/GO nanofibers were prepared by the electrospinning process. The application of electrospun chitosan/GO nanofibers were investigated for the removal of Cu2+, Pb2+ and Cr6+ ions from aqueous solutions. The influence of operating parameters in a batch system containing pH, contact time, initial concentration of metal ions and temperature were evaluated to obtain the optimum conditions for the maximum adsorption capacity of metal ions. Furthermore, the nature of the adsorption process in a batch system were also evaluated. Finally, the reusability of chitosan/GO nanofibrous adsorbent was determined after five adsorption–desorption cycles.
2. Experimental
2.1. Materials
Chitosan (MW of 200 kDa and deacetylation degree of 75–85%) was purchased from Sigma-Aldrich (Sigma-Germany). Sulfuric acid (H2SO4, 97%), hydrogen peroxide (H2O2, 30 wt%), acetic acid and phosphoric acid were obtained from Fluka (Fluka-Switzerland).
The solutions of Cu2+, Pb2+ and Cr6+ ions were prepared by dissolving weighed amounts of lead nitrates, copper nitrate and potassium dichromate (Sigma-Germany) in deionized water.
2.2. Synthesis of GO
Graphite oxide was synthesized from pure graphite powder via modified Brodie method.27 Briefly, raw graphite (1.0 g) and potassium chloride (8.0 g) were mixed in flask containing 20 mL nitric acid with stirring for 24 h. The following processes such as washing, filtration and cleaning were carried out as in Brodie method. The synthesized graphite oxide (10 mg) was dispersed into the 30 mL of NaOH solution at pH 10 and was sonicated for 1 h to make a homogeneous solution. After ultrasonication, samples were immediately precipitated by a centrifuge at 15![[thin space (1/6-em)]](https://www.rsc.org/images/entities/char_2009.gif) 000 rpm for 10 min and washed with HCl (5%) and deionized water several times until the pH of the supernatant was neutral. Finally the material was dried and then sonicated to obtain brown GO.
000 rpm for 10 min and washed with HCl (5%) and deionized water several times until the pH of the supernatant was neutral. Finally the material was dried and then sonicated to obtain brown GO.
2.3. Preparation of chitosan/GO composite solution
The GO aqueous suspensions were sonicated in different concentrations (0.1, 0.5, and 1% wt%) for 1 h to obtain homogenous solutions. The chitosan (8% w/v) solutions were initially added to a solutions of 2 wt% acetic acid in distilled water and were stirred for 24 h to obtain the homogenous solutions of chitosan. Then, glyoxal as a crosslink agent was added to the chitosan solution. Finally, the GO solutions were added to the chitosan solutions and were stirred for 12 h.
2.4. Electrospinning process
The prepared solution was loaded into a 5 mL plastic syringe equipped with a syringe needle. This was placed to a KD programmable syringe pump to control the solution feeding rate. Then, a high voltage was applied between the needle and collector to produce chitosan/GO nanofibers. A voltage of 20 kV, with a tip-collector distance of 15 cm, at a feeding rate of 0.5 mL h−1 was applied to obtain the chitosan/GO nanofibrous adsorbent. The set-up of electrospinning process was provided by Nanomeghyas company (Iran). The schematic of process is shown in Fig. 1.
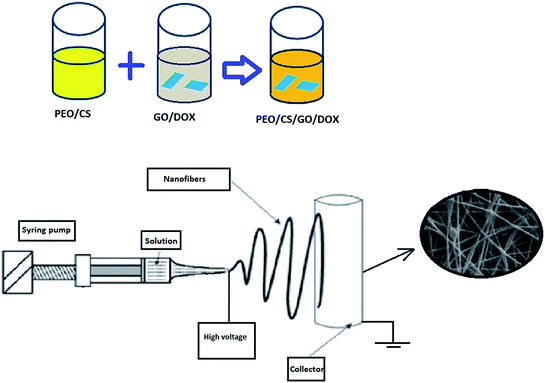 |
| | Fig. 1 The schematic of preparation of chitosan/GO nanofibers. | |
2.5. Morphological and structural characterizations
The chemical structure of prepared GO and chitosan/GO nanofibers were measured by Fourier transform infrared spectroscopy (Vector22-Bruker Company, Germany) in the range of 400–4000 cm−1. The morphological analyses of the nanofibers were characterized using a scanning electron microscope (SEM, JEOL JSM-6380). The average diameter and diameter distribution of nanofibers were obtained with an image analyzer (Image-Proplus, Media Cybrernetics). The final concentration of heavy metal ions in the adsorption medium was determined using an inductively coupled plasma atomic emission spectrophotometer (ICP-AES, Thermo Jarrel Ash, Model Trace Scan).
2.6. Adsorption experiments
All the sorption experiments were carried out in 250 mL flasks containing 50 mg of the adsorbent in 100 mL of metal ions solutions on a rotary shaker at 200 rpm for 1 h. The influence of GO concentration on the removal of metal ions was evaluated in different concentrations (0–1% wt%). The effect of pH of the solution on the metal ions sorption was studied in the range of 2–7. The effect of contact time on the metal ions sorption were investigated at definite intervals. The effect of initial concentration of metal ions (10–1000 mg L−1) and temperature (25, 35 and 45 °C) on the adsorption capacity of metal ions were done at the optimum pH values and equilibrium time. Finally, five cycles of adsorption/desorption of metal ions using chitosan/GO nanofibers were evaluated. Each experiment was repeated triplicate and the results were given as averages.
The amount of metal ions adsorbed was calculated as follows:
| |
 | (1) |
where
qe is the adsorption capacity in mg g
−1,
C0 and
Ce are the initial and equilibrium concentrations of metal ions solution in mg L
−1,
V is the volume of the solution in mL and
M is the weight of the adsorbent in g.
3. Results and discussion
3.1. Characterization of nanofibers
The FTIR spectra of chitosan, GO and chitosan/GO nanofibrous adsorbent are shown in Fig. 2. As shown, peaks at 3420, 1730 and 1080 cm−1 correspond to the OH, C–O and C–O–C groups in the GO structure. In chitosan nanofibers, a broad bond at 3100–3600 cm−1 corresponds to N–H and O–H stretching of the chitosan. The peaks at 1560 and 1650 cm−1 attributed to the amide groups in the structure of chitosan. The broad bond appeared at 2900 cm−1 was assigned to the CH2 stretching groups. Comparison of FTIR spectra of chitosan and chitosan/GO nanofibers indicated that the bonds at 1540 and 980 cm−1 were shifted to the 1550 and 950 cm−1 wave numbers. These results demonstrated the functional groups of GO taken reaction with chitosan chains. Similar trends are reported by other researchers.24,25
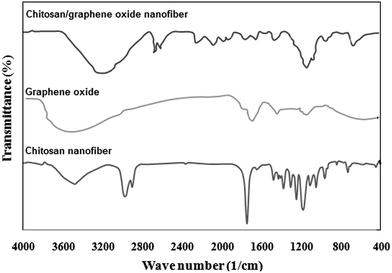 |
| | Fig. 2 FTIR spectra of chitosan, GO and chitosan/GO nanofibers. | |
The SEM images of chitosan/GO with different concentrations of GO (0, 0.2, 0.5 and 0.7%) are shown in Fig. 3. As shown, the smooth and uniform nanofibers with average diameter of 95 nm were produced for chitosan nanofibers. By loading of GO into the chitosan/GO nanofibers up to 0.5%, the diameter of nanofibers due to increasing of the electrical conductivity of electrospinning precursor solutions decreased. After that, the beads nanofibers due to the increasing viscosity by adding more GO, were formed. Similar trends are reported by other researchers.25,26 The TEM images of chitosan/GO nanofibers with content of 0.5 and 0.7% are illustrated in Fig. 3e and f. As shown, the GO sheets were embedded inside the nanofibers framework for chitosan/GO 0.7%, while the no GO sheets were observed inside the chitosan/GO 0.5%.
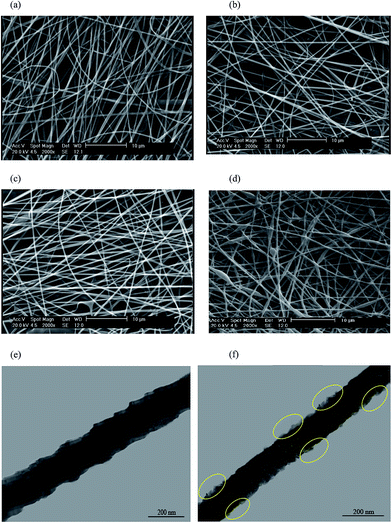 |
| | Fig. 3 SEM images of chitosan/GO with different concentrations of GO containing (a) 0%, (b) 0.2%, (c) 0.5%, (d) 0.7% and TEM images of chitosan/GO with (e) 0.5% and (f) 0.7%. | |
3.2. Effect of GO concentration on the removal of metal ions
To optimize the amount of GO into the chitosan/GO nanofibers, 0.1, 0.2, 0.5, 0.7 and 1 wt% of GO with respect to the total solution weight were embedded into the chitosan nanofibers and the efficiencies of metal ions sorption were studied for the initial concentrations of 100 mg L−1, adsorbent dosage of 0.5 g L−1 and temperature of 25 °C. The results are shown in Fig. 4. As shown, the adsorption capacity of Cu2+, Pb2+ and Cr6+ ions increased by increasing of GO amount up to 0.5%; further increase in GO amounts resulted in the decrease of adsorption capacity of metal ions. The increase in adsorption capacity of metal ions by loading GO sheets was due to the presence of oxygen-containing functional groups on both sides of the GO sheets which increased the available active sites for chelating by metal ions. Reduction in adsorption capacity of metal ions in GO higher than 0.5% could be attributed to over stacking of graphene sheets inside the nanofibers which inhibited the adsorption of metal ions on nanofibers containing higher content of GO. Therefore, the GO concentration of 0.5% is selected as optimum value for further experiments.
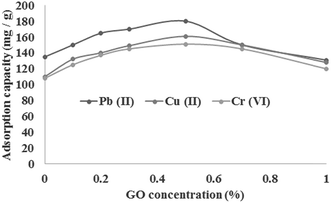 |
| | Fig. 4 Effect of GO concentration on the metal ions sorption using chitosan/GO nanofibrous adsorbent. | |
3.3. Effect of pH on the removal of metal ions
pH is one of important variable that affects the metal ions removing efficiency by protonation/deprotonation of the functional groups of adsorbent. The effect of pH on the Cu2+, Pb2+ and Cr6+ sorption using chitosan/GO nanofibers is investigated in the pH range of 2–7 for the initial concentration of 100 mg L−1, adsorbent dosage of 0.5 g L−1 and 25 °C. The results are shown in Fig. 5. As shown, the maximum adsorption capacity of Cu2+, Pb2+ and Cr6+ were obtained in pH values of 6, 6 and 3. For Cr6+, there are several forms of Cr6+ containing chromate (CrO42−), dichromate (Cr2O72−) and hydrogen chromate (HCrO4−). Based on previous studies, the HCrO4− is the dominant species in the lower pH values than 6.8.27 At lower pH values the protonation of amino (NH2 → NH3+) and hydroxyl (OH → OH2+) resulted in absorption of negatively charged HCrO4− through electrostatic attraction. At higher pH values, the efficiency of chitosan/GO nanofibrous adsorbent for the HCrO4− sorption due to the negative charge density of the adsorbent is decreased.
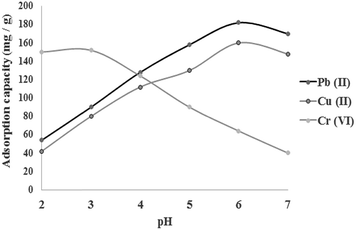 |
| | Fig. 5 Effect of pH on the behavior of metal ions sorption using chitosan/GO nanofibrous adsorbent. | |
For Cu2+ and Pb2+, the protonation of the amino and hydroxyl groups of chitosan/GO reduces the number of active sites of the prepared nanofibrous adsorbent for adsorption of the Cu2+ and Pb2+metal ions at lower pH values. By increasing pH values, the positive charge density on the surface sites of adsorbent is decreased and subsequent, the ability of the adsorbent for adsorption of Cu2+ and Pb2+ ions is increased. At pH values greater than 6, the formation of hydroxylated complexes of the copper and lead ions in the forms of Cu(OH)2 and Pb(OH)2 decreased the adsorption capacity of the chitosan/GO nanofibrous adsorbent. Similar trends are reported by other researchers.28,29
3.4. Effect of contact time and kinetic models
The influence of contact time on the adsorption of Cu2+, Pb2+ and Cr6+ is shown in Fig. 6. As shown, the adsorption of metal ions using chitosan/GO nanofibers reached the equilibrium time after only 30 min. After 30 min, the significant change in adsorption capacity of chitosan/GO nanofibers was not observed. It could be attributed to the large specific area and more number of active sites of chitosan/GO nanofibers for metal ions sorption. Therefore, the equilibrium time of 30 min is selected for further experiments.
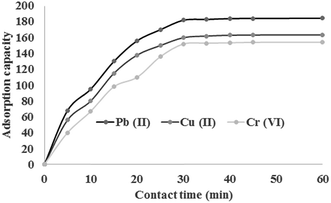 |
| | Fig. 6 Effect of contact time on the adsorption of heavy metal ions using chitosan/GO nanofibers. | |
The kinetic data of metal ions were investigated by pseudo-first-order, pseudo-second-order and double exponential kinetic models in order to understand the adsorption mechanism of metal ions using chitosan/GO nanofibrous adsorbent. The kinetic models are given as follows:
Pseudo-first-order kinetic model:30
| | |
qt = qe(1 − exp(−k1t))
| (2) |
Pseudo-second-order kinetic model:31
| |
 | (3) |
Double-exponential kinetic model:32
| |
 | (4) |
where
qt and
qe are the adsorption capacity (mg g
−1), respectively, at time
t and at equilibrium time;
k1 and
k2 are the pseudo first-order and pseudo-second-order rate constants;
D1 and
D2 (mg L
−1) are rate constants of the rapid and slow steps;
kD1 and
kD2 (min
−1) are constants controlling the mechanism and
xads (g L
−1) is the adsorbent concentration. The kinetic parameters are shown in
Table 1. Based on the values of regression coefficient (
R2) of kinetic models, it was found that the double-exponential kinetic model (
R2 > 0.997) better than both pseudo-first and second order kinetic models described the kinetic data of metal ions. The values of constant parameters of double-exponential kinetic model indicated that the both external diffusion and internal diffusion are effective in the Cu
2+, Pb
2+ and Cr
6+ sorption using chitosan/GO nanofibrous adsorbent.
Table 1 Kinetic parameters of metal sorption onto the chitosan/GO nanofibrous adsorbent
| Metal ion |
Pseudo-first-order model |
Pseudo-second-order model |
Double-exponential kinetic model |
| q eq (mg g−1) |
K 1 (min−1) |
R 2 |
q eq |
K 2 (g mg−1 min−1) |
R 2 |
q eq |
D 1 (mg L−1) |
K D 1 (min−1) |
D 2 (mg L−1) |
K D2 (min−1) |
R 2 |
| Pb2+ |
176.2 |
0.0294 |
0.990 |
202.3 |
0.00052 |
0.994 |
184.5 |
56.32 |
0.0384 |
30.64 |
0.152 |
0.998 |
| Cu2+ |
156.3 |
0.0276 |
0.986 |
180.6 |
0.00059 |
0.996 |
160.2 |
34.20 |
0.0523 |
19.38 |
0.234 |
0.999 |
| Cr6+ |
150.6 |
0.0282 |
0.993 |
165.3 |
0.00039 |
0.992 |
155.0 |
37.30 |
0.0498 |
21.46 |
0.185 |
0.997 |
3.5. Isotherm models
In order to investigation of adsorption equilibrium of metal ions, Freundlich, Langmuir and Redlich–Peterson isotherm models were applied. These models could be expressed as follows:
Freundlich isotherm model:33
| |
 | (5) |
Langmuir isotherm model:34
| |
 | (6) |
Redlich–Peterson isotherm model:35
| |
 | (7) |
where
kF (mg g
−1) and
n are Freundlich parameters related to the sorption capacity and intensity of the sorbent, respectively.
qmax (mg g
−1) and
b (mg
−1) are the Langmuir model constants.
q m is the maximum value of metal ion adsorption per unit weight of membrane that is related to the monolayer adsorption capacity and b is related to the enthalpy of adsorption. P (L mg−1) and α (L mg−1) are the isotherm constants of Redlich–Peterson isotherm model and β is the exponential term which lies between 0 and 1. The parameters of isotherm models were calculated by nonlinear regression of qeversus Ce using MATLAB software. The results are shown in Table 2. By comparing the correlation coefficients, it was found that the Redlich–Peterson isotherm model (R2 > 0.990) fitted better than both Freundlich (R2 > 0.910) and Langmuir (R2 > 0.980) isotherm models, the equilibrium data of metal ions using chitosan/GO nanofibrous adsorbent (Fig. 7). The β constants of the Redlich–Peterson isotherm equation was close to 1 which indicated that the monolayer reaction of metal ions by chitosan/GO composite nanofibers was the predominant reaction, but it was not the sole monolayer adsorption.
Table 2 Isotherm parameters for metal adsorption onto the chitosan/GO nanofibrous adsorbent
| Metal |
T (°C) |
Freundlich isotherm |
Langmuir isotherm |
Redlich–Peterson isotherm |
| K F (mg g−1) |
n |
R 2 |
q max (mg g−1) |
K L (L mg−1) |
R 2 |
P (L mg−1) |
α (L mg−1) |
β |
R 2 |
| Pb2+ |
25 |
139.21 |
5.241 |
0.951 |
438.2 |
0.07258 |
0.982 |
23.32 |
0.1023 |
0.9412 |
0.996 |
| 35 |
148.65 |
5.637 |
0.956 |
452.7 |
0.09931 |
0.986 |
25.61 |
0.1239 |
0.9215 |
0.994 |
| 45 |
160.21 |
5.926 |
0.954 |
461.3 |
0.14280 |
0.980 |
26.91 |
0.1365 |
0.9269 |
0.997 |
| Cu2+ |
25 |
130.15 |
5.523 |
0.946 |
390.8 |
0.05040 |
0.983 |
20.67 |
0.0856 |
0.9210 |
0.992 |
| 35 |
138.22 |
5.672 |
0.923 |
407.9 |
0.06238 |
0.982 |
22.79 |
0.0944 |
0.9150 |
0.993 |
| 45 |
143.64 |
6.011 |
0.920 |
423.8 |
0.07968 |
0.985 |
24.31 |
0.1038 |
0.9020 |
0.990 |
| Cr6+ |
25 |
88.35 |
5.371 |
0.932 |
286.2 |
0.04512 |
0.985 |
11.25 |
0.0623 |
0.9310 |
0.995 |
| 35 |
95.36 |
5.651 |
0.917 |
298.3 |
0.05231 |
0.982 |
12.38 |
0.0742 |
0.9170 |
0.993 |
| 45 |
101.42 |
6.122 |
0.910 |
310.4 |
0.05967 |
0.983 |
14.21 |
0.0751 |
0.9065 |
0.996 |
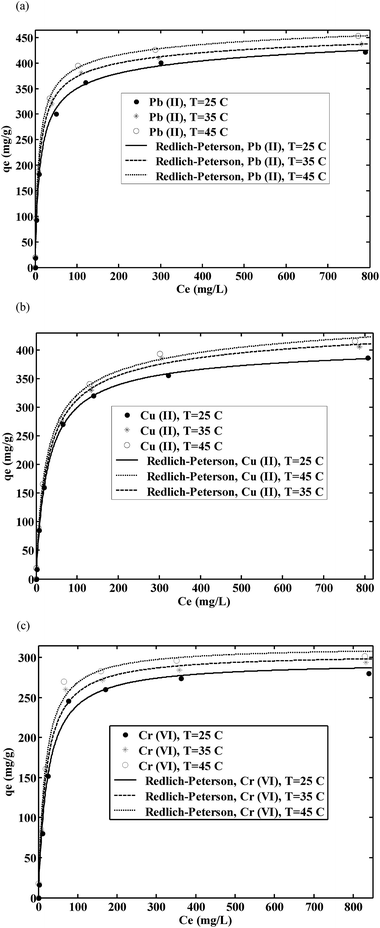 |
| | Fig. 7 Redlich–Peterson isotherm plots for (a) Pb(II), (b) Cu(II) and (c) Cr(VI) sorption onto the chitosan/GO nanofibers. | |
As shown in Table 2, the maximum monolayer capacity of the chitosan/GO nanofibrous adsorbent for the removal of Cu2+, Pb2+ and Cr6+ metal ions were found to be 461.3, 423.8 and 310.4 mg g−1, respectively, at 45 °C. The sorption selectivity of Cu2+, Pb2+ and Cr6+ onto the nanofibers was in order of Pb2+ > Cu2+ > Cr6+. The main reason for this phenomenon could result from atomic mass, molecular size and deformability of metal ions. This behavior could be attributed to the higher diffusivity and mass transfer rate of Pb2+ from the bulk liquid to the pores of the nanofibers compared with Cu2+ and Cr6+. Similar trends are reported by other researchers.36,37 Furthermore, the chemical interaction between negative groups of chitosan/GO such as N–H, C–N, C–O and O–H groups with metal ions took place that affected the metal ions sorption mechanism onto the chitosan/GO nanofibers.
The maximum adsorption capacity of chitosan/GO nanofibrous adsorbent for the removal of Cu2+, Pb2+ and Cr6+ metal ions is compared with other nanofibrous adsorbents reported in the literature11,12,38–42 which results are shown in Table 3. It can be concluded that the maximum adsorption capacity of metal ions using chitosan/GO nanofibrous adsorbent was higher than all of the nanofibrous adsorbents in these literatures, therefore, chitosan/GO nanofibers had a significant potential for adsorption of metal ions from aqueous solutions.
Table 3 Comparison of adsorption capacity (mg g−1) of chitosan/GO composite nanofibrous adsorbent with other nanofibrous adsorbents
| Adsorbent |
Adsorbate |
Adsorption capacity (mg g−1) |
Ref. |
| PEO/chitosan |
Pb2+ |
237.2 |
11 |
| PEO/chitosan |
Cu2+ |
310.2 |
11 |
| Chitosan/HAp |
Pb2+ |
296.7 |
12 |
| PVA/Nafion |
Cu2+ |
59.1 |
38 |
| PVA/ZnO |
Cu2+ |
162.5 |
39 |
| PAN |
Cu2+ |
116.5 |
40 |
| Fe2O3/Al2O3 |
Pb2+ |
23.75 |
41 |
| Fe2O3/Al2O3 |
Cu2+ |
4.98 |
41 |
| PEI/PES |
Pb2+ |
94.34 |
42 |
| Chitosan/PVC |
Cu2+ |
161.29 |
42 |
| Chitosan/GO |
Pb2+ |
461.3 |
In this study |
| Chitosan/GO |
Cu2+ |
423.8 |
In this study |
| Chitosan/GO |
Cr6+ |
310.4 |
In this study |
3.6. Thermodynamic parameters
The thermodynamic parameters including Gibbs free energy change (ΔG°), enthalpy change (ΔH°), and entropy change (ΔS°) were evaluated to determine the feasibility and nature of the adsorption reaction. These parameters were calculated by the following equations:| |
 | (8) |
| |
 | (9) |
| |
 | (10) |
where R (kJ mol−1 K−1) is the gas constant, and T (K) is the temperature. Ces and Cel are the values of solid and liquid phase concentration in equilibrium (mg L−1) respectively. The thermodynamic parameters were calculated and listed in Table 4. The positive values of ΔH° indicated that the Cu2+, Pb2+ and Cr6+ sorption were endothermic in nature. The more negative ΔG° values by the increasing temperature revealed that the adsorption process was spontaneous for metal ions sorption using chitosan/GO composite nanofibers. The positive values of ΔS° suggested that the disorder was increased at the solid–solution interface during the adsorption process.
Table 4 Thermodynamic parameters for metal adsorption onto the chitosan/GO nanofibrous adsorbent
| Metal |
K C |
ΔH° (KJ mol−1) |
ΔS° (KJ mol−1) |
ΔG° (KJ mol−1) |
| 25 °C |
35 °C |
45 °C |
25 °C |
35 °C |
45 ° |
| Pb2+ |
21.32 |
24.56 |
28.87 |
52.31 |
0.1670 |
−7.580 |
−8.197 |
−8.891 |
| Cu2+ |
19.34 |
22.32 |
26.92 |
47.59 |
0.1234 |
−7.339 |
−7.952 |
−8.705 |
| Cr6+ |
7.87 |
10.35 |
13.10 |
43.32 |
0.0925 |
−5.113 |
−5.984 |
−6.801 |
3.7. Regeneration of chitosan/GO nanofibrous adsorbent
Desorption of saturated chitosan/GO nanofibers was carried out by 1 M HCl and results after five adsorption–desorption cycles are shown in Table 5. As shown, the adsorption capacity of metal ions using nanofibers decreased slowly by increasing cycle number. It could be attributed to decrease in availability of active sites of adsorbent for metal ions sorption by increasing cycle number. However, more than 90% of total adsorption in first cycle take placed in fifth cycle for metal ions. Therefore, the chitosan/GO composite nanofibers could be utilized extensively in industrial activities.
Table 5 Nanofiber regenerate efficiency for metal ions sorption
| Recycle times |
Pb2+ (mg g−1) |
Cu2+ (mg g−1) |
Cr6+ (mg g−1) |
| 1st |
182 ± 3 |
160 ± 3 |
150 ± 2 |
| 2nd |
176 ± 2 |
155 ± 2 |
146 ± 3 |
| 3rd |
173 ± 4 |
152 ± 1 |
143 ± 3 |
| 4th |
170 ± 2 |
149 ± 3 |
140 ± 2 |
| 5th |
169 ± 3 |
147 ± 3 |
137 ± 3 |
4. Conclusion
The electrospun chitosan/GO composite nanofibers was an effective adsorbent for the removal of metal ions. The SEM images of chitosan/GO nanofibers indicated that loading of GO into the chitosan/GO nanofibers up to 0.5% resulted in decrease in the diameter of nanofibers. The optimum pH values for the removal of Cu2+, Pb2+ and Cr6+ were found to be 6, 6 and 3, respectively. The kinetics of adsorption process followed by double-exponential mechanism which indicated that the both external diffusion and internal diffusion are effective in the Cu2+, Pb2+ and Cr6+ sorption using chitosan/GO nanofibrous adsorbent at equilibrium time of 30 min. The results of equilibrium studies indicated that the Redlich–Peterson isotherm model could described well the experimental data of metal ions. Calculation of thermodynamic parameters of the adsorption process showed the endothermic and spontaneous nature of Cu2+, Pb2+ and Cr6+ ions adsorption using chitosan/GO nanofibers. The adsorbent could be used up to fifth cycle of regeneration retaining 93, 91.5 and 91% of the initial adsorption capacity for Pb2+, Cu2+ and Cr6+ ions sorption.
References
- M. Nourbakhsh, S. Illhan and H. Ozdag, Chem. Eng. J., 2001, 85, 351 CrossRef.
- M. Irani, A. R. Keshtkar and M. A. Mousavian, Chem. Eng. J., 2011, 175, 251 CrossRef CAS.
- T. G. Kazi, N. Jalbani, N. Kazi, M. K. Jamali, M. B. Arian, H. I. Afridi, G. A. Kandhro and Z. Pirzado, Renal Failure, 2008, 30, 737 CrossRef CAS PubMed.
- M. Irani, M. Amjadi and M. A. Mousavian, Chem. Eng. J., 2011, 178, 317 CrossRef CAS.
- M. Irani, A. R. Keshtkar and M. A. Moosavian, Chem. Eng. J., 2012, 200, 192 CrossRef.
- L. Roshanfekr Rad, A. Momeni, B. Farshi Ghazani, M. Irani, M. Mahmoudi and B. Noghreh, Chem. Eng. J, 2014, 256, 119 CrossRef.
- J. Wang, K. Pan, E. P. Giannelis and B. Cao, RSC Adv., 2013, 3, 8978 RSC.
- D. K. Sharma, J. Shen and F. Li, RSC Adv., 2014, 4, 39110 RSC.
- Z. Ma, H. Ji, Y. Teng, G. Dong, J. Zhou, D. Tan and J. Qiu, J. Colloid Interface Sci., 2011, 358, 547 CrossRef CAS PubMed.
- K. Saeed, S. Haider, T. J. Oh and S. Y. Park, J. Membr. Sci., 2008, 322, 400 CrossRef CAS.
- M. Aliabadi, M. Irani, J. Ismaeili, H. Piri and M. J. Parnian, Chem. Eng. J., 2013, 220, 237 CrossRef CAS.
- M. Aliabadi, M. Irani, J. Ismaeili and S. Najafzadeh, J. Taiwan Inst. Chem. Eng., 2014, 45, 518 CrossRef CAS.
- S. Haider and S. Y. Park, J. Membr. Sci., 2009, 328, 90 CrossRef CAS.
- N. Gupta, A. K. Kushwah and M. C. Chattopadhyay, J. Taiwan Inst. Chem. Eng., 2012, 43, 125 CAS.
- A. H. Chen, S. C. Liu and C. Y. Chen, J. Hazard. Mater., 2008, 154, 184 CrossRef CAS PubMed.
- Y. Chen, L. Chen, H. Bai and L. Li, J. Mater. Chem. A, 2013, 1, 1992 RSC.
- L. Li, L. Fan, M. Sun, H. Qiu, X. Li and H. Duan, Colloids Surf., B, 2013, 107, 76 CrossRef CAS PubMed.
- T. Liu, Z. L. Wang, L. Zhao and X. Yang, Chem. Eng. J., 2012, 189, 196 CrossRef.
- J. Zhao, W. Ren and H. Cheng, J. Mater. Chem., 2012, 22, 20197 RSC.
- G. Zhao, J. Li, X. Ren, C. Chen and X. Wang, Environ. Sci. Technol., 2011, 45, 10454 CrossRef CAS PubMed.
- H. L. Ma, Y. Zhang, Q. Hu, D. Yan, Z. Yu and M. Zhai, J. Mater. Chem., 2012, 22, 5914 RSC.
- X. Mi, G. Huang, W. Xie, W. Wang, Y. Liu and J. Gao, Carbon, 2012, 50, 4856 CrossRef CAS.
- S. T. Yang, Y. Chang, H. Wang, G. Liu, S. Chen, Y. Wang, Y. Liu and A. Cao, J. Colloid Interface Sci., 2010, 351, 122 CrossRef CAS PubMed.
- Y. Liu, M. Park, H. K. Shin, B. Pant, J. Choi, Y. W. Park, J. Y. Lee, S. J. Park and H. Y. Kim, J. Ind. Eng. Chem., 2014, 20, 4415 CrossRef CAS.
- L. Shao, X. J. Chang, Y. L. Huang, Y. H. Yao and Z. H. Guo, Appl. Surf. Sci., 2013, 280, 989 CrossRef CAS.
- H. R. Pant, C. H. Park, L. D. Tijing, A. Amarjargal, D. H. Lee and C. S. Kim, Colloids Surf., A, 2012, 407, 121 CrossRef CAS.
- J. Zhu, S. Wei, H. Gu, S. B. Rapole, Q. Wang, Z. Luo, N. Haldolaarachchige, D. P. Young and Z. Guo, Environ. Sci. Technol., 2012, 46, 977 CrossRef CAS PubMed.
- M. Irani, A. R. Keshtkar and M. A. Mousavian, Korean J. Chem. Eng., 2012, 29, 1459 CrossRef CAS.
- A. R. Keshtkar, M. Irani and M. A. Moosavian, J. Taiwan Inst. Chem. Eng., 2013, 44, 279 CrossRef CAS.
- S. Lagergren, Handlingar, 1898, 24, 1 Search PubMed.
- Y. S. Ho and G. McKay, Process Biochem., 1999, 34, 451 CrossRef CAS.
- N. Chiron, R. Guilet and E. Deydier, Water Res., 2003, 37, 3079 CrossRef CAS PubMed.
- H. M. F. Freundlich and J. Am, Chem. Soc., 1906, 57, 385 CAS.
- I. Langmuir and J. Am, Chem. Soc., 1916, 38, 2221 CrossRef CAS.
- O. Redlich and D. L. Peterson, J. Phys. Chem., 1959, 63, 1024 CrossRef CAS.
- Y. Shuhonga, Z. Meipingb, Y. Honga, W. Hana, X. Shana, L. Yanb and W. Jihuia, Carbohydr. Polym., 2014, 101, 50 CrossRef PubMed.
- A. H. Sulaymon, B. A. Abid and J. A. Al-Najar, Chem. Eng. J, 2009, 155, 647 CrossRef CAS.
- D. K. Sharma, F. Li and Y. Wu, Colloids Surf., A, 2014, 457, 236 CrossRef CAS.
- H. Hallaji, A. R. Keshtkar and M. A. Moosavian, J. Taiwan Inst. Chem. Eng., 2015, 46, 109 CrossRef CAS.
- P. Karimi Neghlani, M. Rafizadeh and F. A. Taromi, J. Hazard. Mater., 2011, 186, 182 CrossRef PubMed.
- A. Mahapatra, B. G. Mishra and G. Hota, J. Hazard. Mater., 2013, 258, 116 CrossRef PubMed.
- M. Min, L. Shen, G. Hong, M. Zhu, Y. Zhang, X. Wang, Y. Chen and B. S. Hsiao, Chem. Eng. J, 2012, 197, 88 CrossRef CAS.
|
| This journal is © The Royal Society of Chemistry 2015 |
Click here to see how this site uses Cookies. View our privacy policy here. ![[thin space (1/6-em)]](https://www.rsc.org/images/entities/char_2009.gif) 000 rpm for 10 min and washed with HCl (5%) and deionized water several times until the pH of the supernatant was neutral. Finally the material was dried and then sonicated to obtain brown GO.
000 rpm for 10 min and washed with HCl (5%) and deionized water several times until the pH of the supernatant was neutral. Finally the material was dried and then sonicated to obtain brown GO.


